Climate Science Glossary

Term Lookup

Enter a term in the search box to find its definition.

Settings

Use the controls in the far right panel to increase or decrease the number of terms automatically displayed (or to completely turn that feature off).

Term Lookup

Settings


All IPCC definitions taken from Climate Change 2007: The Physical Science Basis. Working Group I Contribution to the Fourth Assessment Report of the Intergovernmental Panel on Climate Change, Annex I, Glossary, pp. 941-954. Cambridge University Press.

Home Arguments Software Resources Comments The Consensus Project Translations About Support

Twitter Facebook YouTube Mastodon MeWe

RSS Posts RSS Comments Email Subscribe


Climate's changed before
It's the sun
It's not bad
There is no consensus
It's cooling
Models are unreliable
Temp record is unreliable
Animals and plants can adapt
It hasn't warmed since 1998
Antarctica is gaining ice
View All Arguments...


Username
Password
New? Register here
Forgot your password?

Latest Posts

Archives

A prelude to the Arctic melting season

Posted on 12 February 2012 by Neven

This is a summary/re-write of a recent blog post on the Arctic Sea Ice blog.

We are entering the final stage of the freezing season in the Arctic. The sea ice has reached all shores, and where there aren't shores it reaches as far south as the winds and currents will permit. Or, at least it used to go like that.

Ice growth had been relatively slow in sea ice regions like the Barents Sea, Kara Sea and Greenland Sea (see this Cryosphere Today map to get an idea of where the regions are), but nothing (much) out of the ordinary. However, in the past two weeks a persistent weather pattern emerged that is bringing Siberian cold to almost all of Europe, but warm air and water to Novaya Zemlya, the large island that separates the Barentsz and Kara Seas.

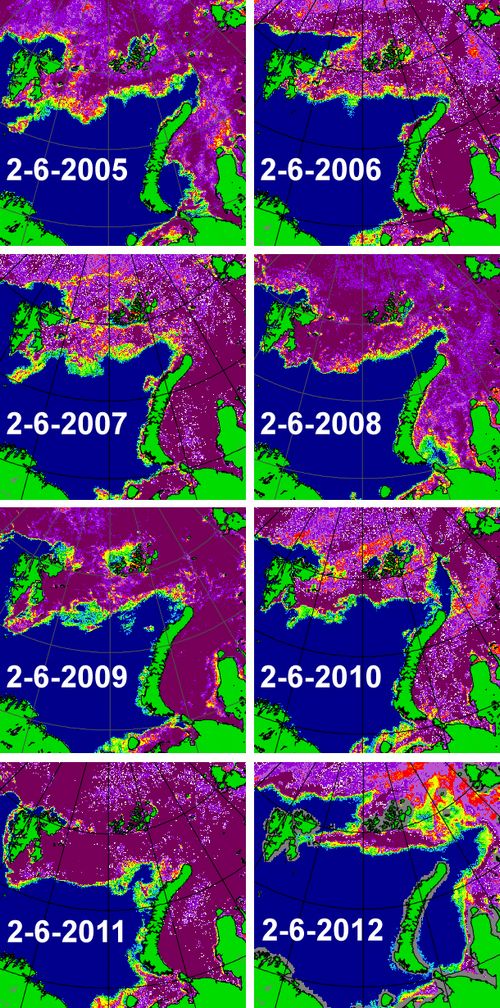
The effect this has had can clearly be seen when comparing yesterday's sea ice concentration image with those of previous years on the same date:
\

image courtesy of the University of Bremen

I have been looking at the Arctic sea ice from up close for about two years now, but this is definitely one of the most spectacular things I have seen so far. It's almost as if the melting season has already started in the Barents and Kara Seas, two months earlier than normal. The only year that looks even remotely similar to this year is 2005.

What could be causing such an early retreat of sea ice cover? The answer is probably manifold. First and foremost is the big high-pressure system over Northern Siberia that is helping Ded Moroz (the Slavic version of Old Man Winter) to hold Europe in a late frosty grip. At the same time this high draws in winds from the west, pushing the ice back in the Barents and Kara Seas. These winds also bring warm air and rain from the North Atlantic. Take for instance this data from the weather station at Svalbard for the latest 30 days:

"Average temperature was -3.3 °C, 12.2 °C above the normal. Highest temperature was 4.8 °C (29 January), and the lowest was -15.0 °C (25 January). The total precipitation was 61.3 mm. Highest daily precipitation was 25.9 mm (30 January)."

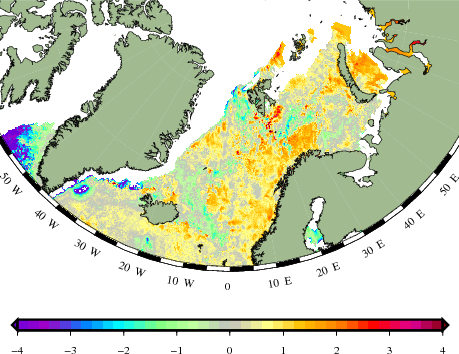
So warm winds, warm rain. How about the water? The winds are probably taking the warm waters from the North Atlantic Current some further still into the Arctic, to places where the sea water that was already exceptionally warm last melting season never really cooled down enough (relatively speaking) for some proper ice formation, as can be seen on this sea surface temperature anomaly map from the Danish Meteorological Institute:
\

According to weather forecast models the pattern will change again in the coming days. Whether we will see a late freeze-up in the Barents and Kara Seas, remains to be seen. Either way, it won't make those warm waters disappear, and it won't prevent the Sun from coming up to reclaim its reign over the Arctic in a couple of weeks from now. As things currently stand, the Atlantic side of the Arctic looks spectacular. Spectacular and ominous.

0 0

Printable Version  |  Link to this page

Comments

Comments 1 to 44:

  1. Your Ded Moroz link is not working. But if things do not improve radically over the next month the Svalbard polar bears are in for a long hard summer.
    0 0
    Moderator Response: [DB] Thanks; fixed link(s).
  2. Indeed interesting times in the Arctic. Without a late season freeze up in the Barents or Kara, if these stay open, we are going to see some very low summer sea ice extent Arctic wide as the conditions in the early melt season in both these regions have a high degree of success in indicating how low the summer sea ice extent will be. Globally, even though the Antarctic is slightly above average, the large negative anomaly in the Arctic still makes the global sea ice extent very low. It is in fact, quite possible that we'll see the lowest global sea ice area and extent in the modern satellite era in the next few weeks. Though most won't think of this way, but that would possibly mean that we'll be seeing the lowest planetary albedo during this era as well, meaning of course more solar radiation staying in the Earth's climate system.
    0 0
  3. Winter albedo in the Arctic is not that much of a factor R.Gates, don't you think?
    0 0
  4. It has been documented for quite some time that the NAO and the AO play a role in the level of ice in the Arctic Sea. Long Term Arctic
    0 0
  5. At this point there is probably no chance to build up anything but ephemeral ice thickness.
    0 0
  6. Philippe, I was thinking in terms of total global sea ice area. But you are of course correct, even with low ice in the Kara and Barents, there isn't much in the way of solar insolation hitting those areas right now. That open water is probably losing more heat than gaining I would guess (neglecting inflows of warm water through currents). Still, if the Kara and Barents remain ice-free until the traditional melt season really kicks in, it could portend 2012's summer sea ice minimum really smashing 2007's mark.
    0 0
  7. I'm curious to know what the pro ice-watchers think of this: NASA Finds Russian Runoff Freshening Canadian Arctic Increasing freshwater on the U.S. and Canadian side of the Arctic from 2005 to 2008 is balanced by decreasing freshwater on the Russian side, so that on average the Arctic did not have more freshwater. Here blue represents maximum freshwater increases and the yellows and oranges represent maximum freshwater decreases.
    0 0
  8. Camburn @4, the abstract of your cited paper reads:
    "Examination of records of fast ice thickness (1936–2000) and ice extent (1900–2000) in the Kara, Laptev, East Siberian, and Chukchi Seas provide evidence that long-term ice thickness and extent trends are small and generally not statistically significant, while trends for shorter records are not indicative of the long-term tendencies due to large-amplitude low-frequency variability. The ice variability in these seas is dominated by a multidecadal, low-frequency oscillation (LFO) and (to a lesser degree) by higher-frequency decadal fluctuations. The LFO signal decays eastward from the Kara Sea where it is strongest. In the Chukchi Sea ice variability is dominated by decadal fluctuations, and there is no evidence of the LFO. This spatial pattern is consistent with the air temperature–North Atlantic Oscillation (NAO) index correlation pattern, with maximum correlation in the nearAtlantic region, which decays toward the North Pacific. Sensitivity analysis shows that dynamical forcing (wind or surface currents) dominates ice-extent variations in the Laptev, East Siberian, and Chukchi Seas. Variability of Kara Sea ice extent is governed primarily by thermodynamic factors."
    (My emphasis) How small are the long term trends, to 2000, can be seen by noting the ice extent trends across all all four Russian Arctic seas of -0.5 thousand km^2 per decade. That means, averaged across all four seas Arctic sea ice extent fell by about 5 thousand km^2 over the twentieth century. In stark contrast, August Arctic sea ice extent has fallen by approximately 2.3 million km^2 over the last three decades: That is not an apples and oranges comparison in that it compares the entire Arctic to just the four Russian Arctic seas. Comparing summer Arctic extents over the 20th centuries show those seas to have been unusual in their limited reduction in August sea ice. That calls into question your extrapolation from a regional study to the full Arctic. Never-the-less the full comparison still shows Arctic summer sea Ice Extent to have fallen almost as much in the 21st century as it did throughout the twentieth. It is interesting to note that all of the fall in the twentieth century is post 1950. In other words, the clear pattern is that while NAO may influence Arctic sea ice extent, that influence is now imposed on an unprecedented (in modern times) long term decline in sea ice extent which is a consequence of global warming. Put differently, the difference between the 2011 and 2012 sea ice extent near Novaya Zemlya may be due to the NAO, but the difference between 2012 and the 1976-2006 mean is due to global warming:
    0 0
  9. #4, and yet when the full context of the whole Arctic ocean is considered with a broad range of historical and proxy evidence (and not just the seas marginal to Russia), in this thorough review by Polyak et al 2010, they find:
    The current reduction in Arctic ice cover started in the late 19th century, consistent with the rapidly warming climate, and became very pronounced over the last three decades. This ice loss appears to be unmatched over at least the last few thousand years and unexplainable by any of the known natural variabilities.
    0 0
  10. Tom@8: Ice loss is a regional item in the Arctic. On the whole, there has been ice loss on an annual basis. I am not confident that there are aduequate records of ice extent prior to satillites with enough resolution to provide the degree of certainty that is currently exibited. I have to logs of the St. Roch voyage in 1944. There were times when no ice was evident as far as the eye could see. This log is not in the public domain so I can't post a link to it. I can however post this: Page 92: Aug 22, noon. Barrow St. No Ice in sight. Page 93: Sep 3rd 6:pm Princess Royal Is. No ice in sight. RCMP 1945 Reports and Other Papers Realating to the Two Voyages of the R.C.M. Police Schooner "ST. Roch" This is first hand observations by the ships Master. Also, after reading the logs it is very apparant that the currents in the Arctic Sea play a huge role in ice transport etc. There is no doubt that the ice since Satillite measurements has been in decline. The reasons for said decline can be partially attributed to Global Warming, but a very significant part are the result of black carbon. Nasa Aerosols May Drive Arctic The long term picture is a complicated one that deserves much more research.
    0 0
  11. The paper presented is worth getting a copy from the local library: Bowhead Whale Historical Range in the Canadian Archipelago What this provides is evidence of Hisotrical Arctic Ice extent. One can then look at historical climatic patterns during the times of limited ice extent to understand what may lie ahead for our planet.
    0 0
  12. Camburn, you will find further details about the St. Roch's Northwest Passage voyages, written by myself, on Skeptical Science here. Things were not as benign as you seem to be suggesting.
    0 0
  13. JMurphy: I did not suggest that the voyage was benign. I am showing what was in the log. They also encountered a lot of ice in places. The point I was trying to establish is: resolution. I will read your link forthwith. Thank you.
    0 0
  14. skywatch#9: Polyak 2010 was discussed here. analysis of several hundred indicators of past Arctic sea ice extent tells us that recent losses appear to have no parallel in records going back many thousands of years (Polyak et al).
    0 0
  15. Camburn, how am I supposed to be impressed in any way by a record reporting no ice in sight in late August and September? In the anecdotal area, do you remember about the guy who was swimming in open water at the North pole a couple of years ago? Shall we put this up in the anecdote contest? Please... This anectodal record is of very little interest. This winter ice area and extent are low so far. We'll see how it turns out in late September, which is the metric that matters the most. I note that the January extent is so exactly on the linear regression of the overall decline of the month' extent that it's almost as if the ice had been rehearsing. I find the ice area graph at Cryosphere today even more concerning, it's showing the same pattern as last year, but 250k sq. Km lower. In any case, we're nowhere near the 1979-2000 average, in either metric.
    0 0
  16. Philippe: The observation from the Captains log are not anecdotal. They are reported observations. Observations are 1st hand, anecdotal are 2nd hand. The following paper from DMI is worthy of consideration to explore all avenues that affect Arctic Ice. It has been established that "Black Carbon" may be responsable for 40% of the current temp/melt. Ref link to Schmidt/Shindell posted above. DMI East Greenland Ice
    0 0
  17. As presented above: 1. There seems to be a solar influence concerning Arctic Ice flucuations. 2. Black Carbon, an anthorgenoponic emission, is also responsable for the current decline in ice. 3. Increased temperature is also responsable for the decline in Arctic Ice. The loss of Arctic Ice is a multifaceted issue.
    0 0
  18. Camburn, B.S. Anecdote, per Webster dictionary: "a short account of an interesting, often biographical incident." Any biographical incident has little bearing to the bigger picture. It is an individual occurrence. The St Roch's account is no more telling than the swim over the pole. How long did it take to cross the Northwest passage back in these days? 3 years. Recently, it was done by a small sailboat in a few weeks. This argument is so ridiculous I don't know why anyone would even put it forth. As much as 40% due to black carbon. That leaves 60% or more (could be much more) to other factors. Gee, I feel so much better knowing that. Looking back at your history here it seems you have no more to say than you ever had before.
    0 0
  19. From Camburn #17: "1. There seems to be a solar influence concerning Arctic Ice flucuations." The opposite - ice-extent reductions have increased sharply in a period that the pro-pollutionists raved and ranted was dominated by low solar activity. "2. Black Carbon, an anthorgenoponic emission, is also responsable for the current decline in ice." Sure, ABC shows up for a serious influence in this decade - that's the current picture. But the Warsaw Pact Cloud didn't have the same effect in the 70s/80s. And the clear decade of the 90s didn't produce a recovery. "3. Increased temperature is also responsable for the decline in Arctic Ice." Very true, except for the weak phrase "is also". The places to start with understanding the disruption of the Arctic ecosystem is heat conveyers - through the winds, via ocean currents north, and from freshwater runoff into the Arctic Ocean. As for the St. Roch reference - it is anecdotal. There's no metric, no baseline comparison ... it's just an amusing arctic-summer observation.
    0 0
  20. Beaufort Gyre link: http://www.whoi.edu/page.do?pid=66296 the 'flywheel' of the NH ocean current system may change direction leading to changes elsewhere, but how many 'gears' does the system have? one could assume there are several potentially stable energy levels between the various water masses, but does the potential disappearance of summer ice change the entire system even in winter?
    0 0
  21. The weather has turned in the Barents and Kara regions. In the coming 2-3 weeks we'll see how much of the ice returns. Of course, it will be much thinner than usual. I've also just published a short piece on the situation in the Bering Sea, where ice cover is anomalously high for the time of year. We'll start discussing the Northwest Passage, once it starts opening up completely in August, just like in the last 5 years. Or was it 6 years? I've lost count... ;-)
    0 0
  22. Two quick comments: 1) As the decline in Arctic sea ice continues, I'm somewhat amused by the ongoing efforts by some to downplay the significance of a warming climate as a contributing factor. Ice doesn't melt by magic. 2) I'm astounded by the temperature data for Svalbard cited in this post. Am I reading correctly that the *monthly* average temperature there is 12.2 degrees Celsius above normal? I know, it's just one month at one location, but that's an amazing observation.
    0 0
  23. Enginerd, February 8th saw a new day record on Svalbard of 7.0 degrees C. I don't know how much above the baseline that is, but I guess it's more than 12.2 degrees C. But that's just weather. Here are the temperatures of the past 12 months compared to standard temps. Both links lead to comments made by Kris on the Arctic Sea Ice blog.
    0 0
  24. Enginerd, the January anomaly for much of Alaska was 20F (11C) below normal. Part of the Svalbard anomaly is global warming (see Tom's post 8) but most of the recent Svalbard anomaly was the jet stream pattern.
    0 0
  25. owl@19: Read the links to studies that I provided. Thank you. Philippe: The 40% number came from a study by Schmidt-Shindell. If you don't agree with their findings, show us why they are wrong.
    0 0
  26. Black carbon was mentioned among all the forcings discussed here. Doesn't look like much of a player. Even worse for the BC believers is Warren et al 2008: Preliminary results indicate that the snow cover in Alaska, Canada, and the Arctic Ocean has lower BC concentrations now than 20 years ago (5-10 ppb instead of 15-30 ppb), consistent with the declining trend of BC found in air samples at Alert. -- emphasis added How can a pollutant that is decreasing in concentration contribute to an increasing melt rate?
    0 0
  27. @camburn10. So you doubt the measured data going back to 1900, but you are certain of anecdotal evidence from one year? By the way, as as Phillipe already noted, anecdotal does not mean second hand; it means an individual's observation, as opposed to a systematic set of observations.
    0 0
  28. Dan, Camburn did provide the link above, to a NASA article from 4/8/9 discussing the paper.
    The researchers found that the mid and high latitudes are especially responsive to changes in the level of aerosols. Indeed, the model suggests aerosols likely account for 45 percent or more of the warming that has occurred in the Arctic during the last three decades.
    0 0
    Moderator Response: [DB] Thank you for the correction. Tied one on last night and was more cranky than is my wont.
  29. Camburn, You can find a guest post from Dr. Shindell himself over at RealClimate here. I don't have time at the moment, I'm heading out, but I'll read it later tonight.
    0 0
  30. Sphaerica: There's a conspicuous bit missing from the quoted section on aerosols. This is from Shindell's RC post regarding Shindell and Faluvegi 2009: We also estimated that aerosols in total contributed 1.1 +/- 0.8ºC to the 1976-2007 Arctic warming. This latter aerosol contribution to Arctic warming results from both increasing BC and decreasing sulfate, and as both were happening at once their contributions cannot be easily separated ... -- emphasis added Blame the warming on that rascally EPA; first they made us decrease sulfate emissions, so they could come back and regulate our carbon.
    0 0
  31. @muoncounter30 >>There's a conspicuous bit missing from the quoted section on aerosols I'm just a bit confused by the Real Climate post. On the one hand, as aerosols decreased, the warming from CO2 increased. That's clear. But despite the overall decrease in aerosols, back carbon increased. In contrast to aerosols, black carbon increases warming. Why is that so--because of the albedo affect?
    0 0
  32. paulhtremblay@31: Yes, because of the albedo affect.
    0 0
  33. muoncounter@26: You have posted a paper that is contrast to Schmidt-Shindell. Thanks for adding to my confusion....:)
    0 0
  34. paulhtremblay#31: Isn't the idea that black carbon deposited on snow decreases ice/snow albedo? So it is two or more separate processes: aerosols increasing atmospheric albedo, BC as aerosol (short-lived) increasing atmospheric albedo, but decreasing albedo when on the ground. camburn#33: Always glad to be of service.
    0 0
  35. The next solar maximum looks to be a mild one but will likely coencide with an El Nino. That should see off at least a few of the sceptics. http://www.skepticalscience.com/pics/gcs_fig_1_big.jpg
    0 0
  36. I was thinking about the unusual jet stream pattern that has kept arctic air out of the lower latitudes more than is typical. So, I'm thinking with less mixing of air across latitudes, there would be an opportunity for it to get cooler than normal within the polar cell area. That would kind of jive with it being bitterly cold when it did plunge south, and I think we have seen that with the cold snap in Europe. Plus, it would be consistent with Neven's blog on the Bering Sea. Just guessing; I have not been able to find anomalies for that region for just the last several months.
    0 0
  37. Hmm, if this year's jet stream pattern starts to repeat in the next several years, maybe arctic ice will last a little longer than the current rate of decline would lead us to believe. No doubt that would be small consolation. Plus, if the La Nina weakens, I suspect that might snap the pattern to something else.
    0 0
  38. Chris G, I also thought that the strong polar jet bottled up cold air which then plunged into Europe, but that does not appear to be the case from these anomalies: http://ocean.dmi.dk/arctic/meant80n.uk.php After building an jet stream animation for January here http://squall.sfsu.edu/crws/archive/jetstream_archive.html I have even less confidence the bottled up theory, but frankly I don't know how to evaluate the animation.
    0 0
  39. I think it should be noted that the current data are from a different instrument as the AMSR-E instrument is not working.
    0 0
  40. May I suggest that a colour key for the first set of images would help laypeople like myself to understand what the false-colours represent?
    0 0
  41. gpwayne, you are absolutely right. I will put a colour bar showing percentage of sea ice concentration in next time (you can see it here at the source). Of course, the emphasis in this post was on ice cover vs open water.
    0 0
  42. January 2012 (GISS) is out. Gives an idea as to why the ice is in such a sorry state: [Source]
    0 0
  43. Daniel Bailey @42 I am not sure the problem is with the January temperatures in the arctic. The bigger concern may be the summer arctic temperatures when the air gets above freezing and the sun shines 24/7. source. Here is a January 1977 anomaly map when winter ice shows the largest extent in the record (compare to your 2012 graph) (article with graph of arctic ice 1972 to 2002). source. What may be more significant are the summer month anomalies. source. or-(another summer with low arctic ice area) source. And for comparative view the summer of 1977. source.
    0 0
  44. Cryosat-2 has released more results. Also a BBC story here. Some of the significant findings; Total arctic ice volume calculated by Cryosat is consistent with PIOMAS results. About 14,500 km^3 for March 2011. This confirms that the sharp drop in ice volume shown by PIOMAS over the past few years was not an error in the model. Average ice thickness was just 1.5 meters in October 2010. Rising to about 2.4 meters by March 2011. This is significant because in the past 'first year ice' was frequently about 3 meters thick. Now only 2+ year old ice is that thick. There was virtually no 5 meter thick ice remaining in October 2010, but over the winter scattered tiny pockets formed by March 2011.
    0 0

You need to be logged in to post a comment. Login via the left margin or if you're new, register here.


The Consensus Project Website

THE ESCALATOR

(free to republish)


© Copyright 2024 John Cook
Home | Translations | About Us | Privacy | Contact Us