Climate Science Glossary

Term Lookup

Enter a term in the search box to find its definition.

Settings

Use the controls in the far right panel to increase or decrease the number of terms automatically displayed (or to completely turn that feature off).

Term Lookup

Settings


All IPCC definitions taken from Climate Change 2007: The Physical Science Basis. Working Group I Contribution to the Fourth Assessment Report of the Intergovernmental Panel on Climate Change, Annex I, Glossary, pp. 941-954. Cambridge University Press.

Home Arguments Software Resources Comments The Consensus Project Translations About Support

Twitter Facebook YouTube Mastodon MeWe

RSS Posts RSS Comments Email Subscribe


Climate's changed before
It's the sun
It's not bad
There is no consensus
It's cooling
Models are unreliable
Temp record is unreliable
Animals and plants can adapt
It hasn't warmed since 1998
Antarctica is gaining ice
View All Arguments...


Username
Password
New? Register here
Forgot your password?

Latest Posts

Archives

Lindzen's Clouded Vision, Part 1: Science

Posted on 8 May 2012 by dana1981

When it comes to global climate change, there are two critical and intertwined, but distinct issues: science, and policy.  We generally focus on the science, because that is what dictates the appropriate policy response, or at least what our climate policy needs to accomplish.

Justin Gillis had an excellent article published in The New York Times this past week, which addresses both science and policy.  The science aspect of the article bears some resemblance to one of our posts from a year ago, Climate Sensitivity: The Skeptic Endgame.  The fundamental premise of both articles involves the fact that, because of the sound basic science supporting the human-caused global warming theory, there only remains one fallback position for the remaining relatively credible climate contrarians.  That fallback position involves climate sensitivity being lower than the body of scientific evidence indicates.

Gillis' article focuses mainly on Richard Lindzen, who is one of the relatively more credible climate contrarians (although he has a long history of taking contrarian positions on nearly every climate-related issue, and being almost universally wrong on those issues).  Lindzen embodies the low climate sensitivity fallback position perfectly, but as we will see here, the basis of Lindzen's argument, which itself is the basis of all remaining relatively credible climate contrarianism, is entirely false and undermined by three inescapable flaws.

Lindzen's Three Sensitive Achilles' Heels

We know that humans are rapidly increasing the level of CO2 and other greenhouse gases (GHGs) in the atmosphere, we know that this GHG increase is causing some amount of warming, and will continue to cause additional warming as long as GHG levels continue to rise.  The remaining relatively credible climate contrarians like Lindzen acknowledge these realities; where they differ from mainstream climate science is in exactly how much warming the GHG increase will cause.  This is known as the climate sensitivity - how much the planet will warm in response to increasing GHGs, including feedbacks.

For contrarians like Lindzen, climate sensitivity must be low, or they have no case to make.  They have acknowledged that GHGs will cause warming, and their only argument against taking serious action to reduce GHG emissions is this premise that the GHG increase won't cause very much warming.  That is why we described this argument as the 'skeptic' endgame, and Gillis accurately described it as the dissenters' "last bastion."

So what is Lindzen's case for low climate sensitivity?  He summed it up in the recent ABC documentary discussed by John Cook, I Can Change Your Mind About Climate (see minute 21 in this video).  In response to a comment that the average global surface temperature has warmed about three-quarters of a degree Celsius, Linzen responds:

"Yeah, and we should have seen 3[°C]"

This is a very brief encapsulation of Lindzen's pet argument, Earth hasn't warmed as much as expected.  I call it his 'pet argument' because he makes it in virtually every talk and presentation he gives, and has been making it since at least 1989, despite the fact that it's been debunked time and time again (i.e. Skeptical Science alone has debunked it here and here and here and here and here and here).

In short, if climate sensitivity is lower than resulting in climate models, then the climate should have warmed less than climate models have predicted.  In order to argue that this is the case, Lindzen claims that CO2-equivalent (the total radiative forcing for all greenhouse gases in units equivalent to CO2-caused warming) has already doubled from pre-industrial levels; therefore, if climate sensitivity is around 3°C for doubled CO2 (as in climate models), the planet should have warmed 3°C.  It has not warmed nearly so much; therefore, Lindzen asserts, climate sensitivity is low.

The problem with Lindzen's argument for low sensitivity is that it contains three separate fundamental flaws:

  • Lindzen has completely neglected all non-GHG influences on the climate.  The second-largest influence (behind CO2) is from human aerosol emissions, which have a cooling effect.  Lindzen seizes on the uncertainty associated with aerosols - the strength of their cooling effect is not well-known; however, the scientific evidence does clearly indicate that they have a cooling effect.  In fact, Lindzen's own sources on the subject conclude that aerosols have a strong cooling effect.  Yet in his argument, he has completely failed to account for this cooling effect.  In short, Lindzen treats the GHG forcing as equivalent to the net radiative forcing (which is what the climate responds to), but the two are not equivalent.
  • 3°C is the equilibrium climate sensitivity - the amount the planet will eventually warm once it reaches a new energy balance.  The planet currently has an energy imbalance (mostly stored as heat in the oceans), so there is still more warming "in the pipeline" from the GHGs we have already emitted.  Lindzen fails to account for this effect.

By themselves, each of these fundamental errors completely invalidates Lindzen's argument.  Taken together, they form a trio of Achilles' Heels which leave us puzzled as to how Lindzen has continued to make this obviously and grossly fundamentally flawed argument for over two decades.

Lindzen also Disproven by Reality

In addition to these three glaring errors, we know the Earth has warmed as much as expected because climate scientists compare their model runs to observational data.  We've done a whole series of posts looking at the accuracy of past climate model predictions, our most recent entry being Hansen et al. 1981 (Figure 1).

Hansen 1981 projections vs observations

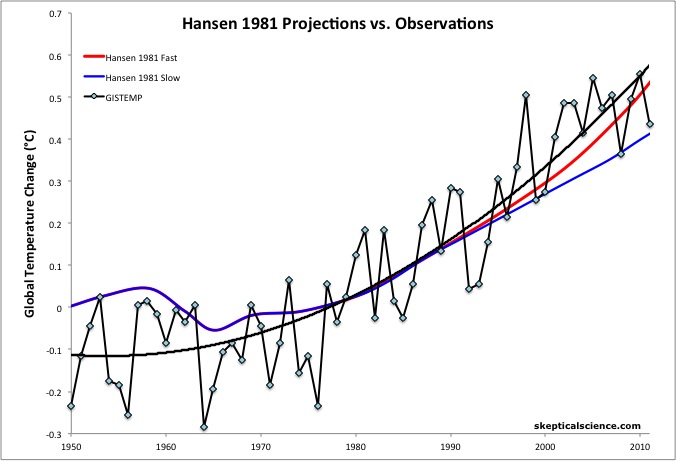
Figure 1: Hansen et al. (1981) global warming projections under a scenario of high energy growth (4% per year from 1980 to 2020) (red) and slow energy growth (2% per year from 1980 to 2020) (blue) vs. observations from GISTEMP with a 2nd-order polynomial fit (black).  Actual energy growth has been between the two Hansen scenarios at approximately 3% per year.  Baseline is 1971-1991.

Thus not only do we know Lindzen's argument is wrong due to its three Achilles' Heels, we know it's wrong just by comparing actual model results to observational data, which show the Earth has warmed consistent with model predictions.

There simply is no question - Lindzen's claim that the Earth hasn't warmed as much as expected, which is the basis of his low climate sensitivity argument, which is the basis of all remaining relatively credible climate contrarianism, is entirely false based on three fundamental physical flaws in his argument, as demonstrated by simply comparing the models and observations.

Lindzen's Cloudy Iris

In Gillis' Times article, Lindzen brings up his Iris hypothesis.  Back in 2001, Lindzen proposed that in response to global warming, increased sea surface temperature in the tropics would result in reduced cirrus cloud formation and thus more infrared radiation leakage from Earth's atmosphere.  This radiation leakage in turn would have a cooling effect, dampening global warming as a negative feedback (like the iris in a human eye contracting to allow less light to pass through the pupil in a brightly lit environment - hence the term 'iris effect').

However, within a year of the publication of Lindzen's iris paper, there was one study published concluding that Lindzen had significantly overestimated the iris effect, a second concluding that if the iris effect existed, it would lead to increased warming, and a third and fourth papers finding no evidence for the iris effect.  The vast majority of subsequent research has simply not substantiated Lindzen's iris hypothesis - it has not withstood the test of time.

All of Lindzen's Eggs in the Cloud Basket

In another challenge for the low sensitivity crowd, research has shown that the water vapor feedback (which appears to be the largest single feedback) is positive, amplifying global warming.  Therefore, contrarians like Lindzen need a large negative feedback to offset the water vapor effect, and the only credible candidate is cloudcover.  Thus, as Andrew Dessler notes in Gillis' article,

"If you listen to the credible climate skeptics, they’ve really pushed all their chips onto clouds."

Not only is climate sensitivity the 'skeptic' endgame, but clouds are the low climate sensitivity endgame.  Climate contrarians need a strongly negative cloud feedback to argue that climate sensitivity is low, which they need to be the case in order to argue that global warming is nothing to worry about.  It all boils down to clouds

Lindzen hasn't actually published any subsequent research to support his iris hypothesis, but he has attempted to show that climate sensitivity is low, and then proposed his iris hypothesis as the physical explanation for that low sensitivity, even though as noted above, the hypothesis has not withstood the test of time.

The Inconvenient Truth About Clouds and Sensitivity

Unfortunately, most recent climate research has indicated that clouds probably act as yet another positive feedback, amplifying rather than dampening global warming.  The most prominent and recent such paper was Dessler (2010), which found that the short-term cloud feedback is probably positive, although slightly negative values could not be ruled out. 

Contrarians like Lindzen still hold out hope because clouds do remain one of the biggest climate uncertainties.  However, it's not just climate models and studies of climate feedbacks that undermine the low sensitivity argument.  Paleoclimate studies (examining climate data from hundreds to millions of years ago) are also consistent with the climate model sensitivity, and inconsistent with low climate sensitivity arguments (Figure 2).

Various estimates of climate sensitivity

Figure 2: Distributions and ranges for climate sensitivity from different lines of evidence. The circle indicates the most likely value. The thin colored bars indicate very likely value (more than 90% probability). The thicker colored bars indicate likely values (more than 66% probability). Dashed lines indicate no robust constraint on an upper bound. The IPCC likely range (2 to 4.5°C) and most likely value (3°C) are indicated by the vertical grey bar and black line, respectively.  Adapted from Knutti and Hegerl (2008).

Don't Bet on the Climate Contrarians

In short, the evidence is heavily stacked against the low climate sensitivity argument.  The premise of the argument - that the Earth should have warmed more if climate models were right about climate sensitivity - is unquestionably wrong on many different levels.  The argument's last hope lies in a strongly negative cloud feedback, but so far the evidence is pointing in the other direction.  Data from the Earth's history is also inconsistent with an insensitive climate.

That's not to say that a low climate sensitivity is an impossibility.  Science is about probabilities, not certainties.  However, as we will explore in Part 2 tomorrow, while there is a very low probability that they are right, the problem is that contrarians like Lindzen refuse to even consider the possibility that they are wrong, and expect us to risk the welfare of future generations on that slim chance that they are right.

0 0

Printable Version  |  Link to this page

Comments

Comments 1 to 44:

  1. Hi Dana, Thanks for the interesting post and for keeping it unusually free of ad hominem attacks. I would like to question your claim that,
    There simply is no question - Lindzen's claim that the Earth hasn't warmed as much as expected, which is the basis of his low climate sensitivity argument, which is the basis of all remaining relatively credible climate contrarianism, is entirely false based on three fundamental physical flaws in his argument, as demonstrated by simply comparing the models and observations.
    This is a very bold statement, and I think an exaggerated and false statement. I think you would be more skeptical if you were less selective in your appeals to the literature. We have seen Gillett et al. (2012), even discussed here, that suggests the transient climate response (TCR) is in fact less than expected, based on observations. And just the other day Isaac Held published a very interesting article here arguing that Gillett et al. are probably about right. Prof. Held also argues that the observations of TCR are consistent with fixed relative humidity models with no cloud feedback. Recently, Schwartz (2012) has also argued from observations of the 20th century that equilibrium climate sensitivity is about 1.9 K per doubling of CO2. Although Held apparently has reservations about extrapolating from TCR to ECS, I do note that the IPCC AR4 states that climate models, without the cloud feedback, predict a climate sensitivity of about 1.9 K, the same as what Schwartz has found. We have seen other arguments from paleodata - e.g. Kohler et al. (2010); Schmittner et al. (2011) showing, for completely different reasons, that ECS is likely to be about 2.3 K per doubling CO2. Finally, Prof. Lindzen has referred to a number of other papers in literature that support lower sensitivity and you appear to have ignored all of them.
    0 0
  2. Alex: I'm puzzled by your response. There is certainly a real discussion on the actual values of both the TCR and the EQS. You highlighted some low estimates, we could also find some high ones. But the IPCC itself suggests estimates in the range 2-4.5C for EQS, and 1.9C certainly isn't out of the question. However, Lindzen's claim is that according to the consensus position we should have seen 3C temperature rise by now, rather than 0.75C we have seen. But that's not what the consensus scientific position says. The 3C figure he quotes is a response to total change in forcing from pre-industrial, not GHG forcing alone. And the time required for that response to be reached is measured in centuries to millenia, not decades (e.g. Hansen and Sato 2011 Fig 7, or similar figures from Held, Padilla and Vallis 2011, or Rypdal 2012). So I don't understand how Lindzen's claim can be seen as anything other than a complete misrepresentation of the consensus position.
    0 0
  3. Alex, I see no reference whatsoever to a sensitivity of 1.9˚C in the Schwartz paper. Are you sure that you are reading it properly? It's a very interesting exercise in estimating climate sensitivity, and yet it is constrained (as the paper itself points out) by the inherent errors of the observations used as inputs into the model as well as the method used. In particular, multiple sources of inputs are used, yielding a range of sensitivities that roughly cover the span presented by the IPCC AR4. And as always the issue is muddled by the difficulty in estimating the negative aerosol forcing over the past 100 years. You also seem to fail to distinguish between transient and equilibrium climate sensitivities, and the distinction is important. I suggest you read up on that. Lastly, I myself have to question any method that attempts to infer equilibrium climate sensitivity from short term observation. The reality is that I think one needs at least 100 years of clean data, maybe more, with a constant, measured forcing, in order to do so. Trying to estimate equilibrium climate sensitivity from 20th century observations is a little like trying to guess the top speed of a race car on a track by observing one minute of acceleration and braking in deep mud on a hazy day from a distance of 5 miles with an hour glass for a timer. The bottom line here is that (1) the discussion of climate sensitivity is complex and (2) Lindzen's claim is ludicrous.
    0 0
  4. alexharv074 @1 - first of all, we at SkS always keep our posts free of ad hominem attacks, so there is nothing unusual about this. Second, you're not addressing the point of the post. The point of the post is not that no evidence exists for relatively low sensitivity. The point is that Lindzen's argument - that the fact that the planet hasn't warmed 3°C means climate sensitivity is low - is wrong. Third, Schmittner's best estimate equilibrium sensitivity was 2.3°C, and there are good reasons to believe the estimate is too low, as we discussed in our post on the paper (mainly their estimate of the interglacial temperature change is much lower than any previous estimate). Fourth, Lindzen isn't arguing for ~2°C sensitivity, which would be within the IPCC range. He's arguing for ~1°C sensitivity, for which there is almost no supporting evidence. I'm glad we do at least agree that Lindzen's claim is ludicrous.
    0 0
  5. Great post, and good commenting, people are so quick to twist the truth. Even if this truth twisting is done advertently or inadvertently, climate science needs people to make sure the topic is on the right track. Keep up the good work.
    0 0
  6. Sorry to low brow the thread but I was wondering how the figure of 76% (additional) of pre-industrial CO2 forcing is arrived at? my current thinking is along the lines of: CO2 in 1750 ~= 280 ppm CO2 in 2012 ~= 393 ppm So CO2 increase is about 114 ppm which is an increase of (114/280) 41% Where am I going wrong? Is this related to the non-linear relationship between forcing and increased CO2?
    0 0
  7. DC: Good question. The relationship is indeed non-linear - logarithmic in fact. Since we are now at 1.41 x preindustrial, and 1.41=√2, the forcing is almost exactly half way to that of a doubling of CO2. The 76% figure comes from adding the CO2-equivalent of all the other greenhouse gasses we've put into the atmosphere.
    0 0
  8. Dana @4, I agree with you that Alex is missing the point. I would also argue that he is not accurately reflecting the content of Dr. Held's recent blog post, but I won't let us get sidetracked by that red herring. "He's arguing for ~1°C sensitivity, for which there is almost no supporting evidence." It is worse than that Dana. Lindzen has, for a long time, been arguing for a climate sensitivity less than < 1 C for doubling CO2. In 1997 Lindzen published a colloqium paper in PNAS, he stated that: "Indirect estimates, based on response to volcanos, suggest sensitivity may be as small as 0.3–0.5°C for a doubling of CO2, which is well within the range of natural variability." In the much refuted Lindzen and Choi (2009) paper, Lindzen and his coauthor claim that: "...and ERBE data appear to demonstrate a climate sensitivity of about 0.5 C which is easily distinguished from sensitivities given by models." There is that 0.5 C again... In Lindzen and Choi (2011), they revised their estimate upwards slightly to 0.7 C for doubling of CO2: "As a result, the climate sensitivity for a doubling of CO2 is estimated to be 0.7K (with the confidence interval 0.5K - 1.3K at 99% levels)".
    0 0
  9. What really got me when watching the video where Lindzen states that it "should have" warmed 3C by now was... If you look at any projections by any scientists, or the IPCC, there is no one anywhere who has ever put out a graph showing 3C of warming by now. Zero. None. It's a completely outrageous claim that Lindzen makes. It's the mother of all straw man arguments. I was literally slack-jawed in amazement that he made such a statement.
    0 0
  10. Sorry to even further low-brow the thread, but I'm trying to catch up on the topic. Great article, but when reading it my immediate question was in fact -- what is the time scale for equilibrium? I see in the comments that the answer is hundreds to thousands of years. Is it mistake to infer from this 1- That present warming is a result of emissions from a hundred years and more. 2- That if all CO2 emission were cut-off now, it would take hundreds of years to see the warming stop.
    0 0
  11. JoeT, I think the 'hundreds to thousands of years' you are referring to (which doesn't appear to be in the comments to this post) may be the 'long term' sensitivity. Most estimates put the eventual warming for doubled CO2 at around +6 C after all slow feedbacks have played out over hundreds to thousands of years. We're about half way to doubled CO2 forcing now, so ~3 C would be the eventual long term warming expected from current CO2 levels. However, the +3 C figure more frequently cited is the 'fast feedback' value... if we double atmospheric CO2 levels then we expect to see +3 C warming within decades. How many decades depends mostly on how fast we raise the CO2 level, but certainly less than a hundred years. The warming we've been seeing the past few decades has been the result of direct CO2 forcing (which is more or less immediate) and these 'fast feedbacks'. If we could stop CO2 at current levels then within about 50 years the FAST warming would stop at around +1.5 C (we're currently at ~ 0.8 C) and then only slowly go up to +3 C over the course of hundreds of years.
    0 0
  12. Incidentally, Professors Lindzen and Happer, plus Roger Cohen (formerly of Exxon) have responded in the letters section of the May 9th New York Review of Books to Yale Professor William Nordhaus' critique of the op-ed "No Need to Panic About Global Warming" by the group known as the Wall Street Journal 16 Their response to Nordhaus is basically a scatter gun (or Gish gallop, if you prefer!) with not much science. The most scientific parts are general attacks on climate models for not including all sources of variability, and for including aerosols as a "fudge factor" only. Perhaps a future post could cover this? Professor Nordhaus' reply is shorter, clearer and more effective, IMHO. In the Climate Casino SkS covered Nordhaus' original article here: Nordhaus sets the Record Straight
    0 0
  13. CBDunderson: Thanks very much for your post. Actually the hundreds to thousands of years was in post #2 just above, which also says the response time is not decades. What I got from your post is that there is a fast and slow time response. Could you elaborate for me -- or point me in the right direction -- as to what constitutes the physical processes that account for the two time scales. Thanks again. I've learned a great deal in the short time I've been following this site.
    0 0
  14. JoeT @10 - the timescale to equilibrium is something of an unresolved question, which I think we'll be addressing in a future blog post. Off the top of my head, I think that after 50-100 years, somewhere in the ballpark of two-thirds to three-fourths of the equilibrium warming is realized. It mainly depends on how efficiently heat mixing happens in the oceans, which is the somewhat unresolved question. So yes, if we were to suddenly stop emitting CO2, we'd see most of the consequent warming within a century, but not all of it.
    0 0
  15. shoyemore @12 - aerosols are sort of a "fudge factor" in models by necessity, simply because we don't have good measurements as to the strength of their cooling effect. We do have good measurements of the temperature change, and of most other forcings, so the aerosol focing is allowed to vary within certain constraints in order to best fit the observed temperatures. You can call that a 'fudge factor' if you like. However, as noted in the post above, they do not have zero temperature influence, as Lindzen assumes. Better to treat them as a 'fudge factor' than a neglected factor.
    0 0
  16. Dana1981 Great piece, thanks for the response. Sorry to drag on about this, but I think the issue is very important, especially to neophytes like myself. An additional blog post would be great. I'm still trying to reconcile what you wrote with #2 and #11. In your example, if we choose a simple exponential and pick that in 75 years, 0.7 of the warming will occur, that gives us a time of around 60 years. That also means that roughly 99% of the warming will occur in less than 300 years. My question -- is there only 1 time constant as in this example, or is there indeed a fast and slow time constant such that additional warming due to CO2 alone takes place over millenia? Thanks!
    0 0
  17. JoeT: I think this graph is what you are look for, from Hansen and Sato 2011. An exponential isn't a good model, because there are so many different timescales involved. Given that this curve is from a climate model, I have no real idea what the uncertainties are like. However you can also estimate the shape of the response function from past climate over various timescales. There's a nice paper by Padilla and Vallis (2011) on that.
    0 0
  18. JoeT, You have to remember that in any case these are only very simple one-dimensional mathematical models of a real world situation. What really determines how large climate sensitivity is and how long it takes to reach a new equilibrium temperature is not determined by some simple physics equation like F=ma or e=mc2. As the Arctic summer ice melts, the open ocean absorbs more radiation rather than reflecting it. This is a positive feedback, but it depends on when the Arctic summer ice melts, and how soon in the year. It can also be a self-reinforcing feedback (sooner melt = warmer planet = sooner melt), as most are, but it is bounded by the limited summer season in the Arctic. Eventually the days get dark. How long will it take (if ever) until the ocean is warm enough to start releasing rather than absorbing CO2? How long will it take (if ever) for deserts to expand or for rain forest to turn into savanna (releasing more CO2 but also increasing the albedo of the land), and how large will the net positive feedback be? How long will it take (if ever) and how much methane will be released from permafrost? The reality of the situation depends on the slow feedbacks, but any one dimensional equation intending to model them is just a very rough approximation.
    0 0
  19. @Albatross #8- At least Lindzen is moving in the right direction. Maybe he just needs a bit more 'negative feedback' from his peers so that he can finally reach equilibrium ;)
    0 0
  20. James Wight also had a very good post on the various measures of climate sensitivity (fast, slow, etc.). Rob Painting is working on a relevant post right now, and I might also do one on issues like 'warming in the pipeline', depending on what Rob covers in his post.
    0 0
  21. Joe T @16, you have already received a number of informative answers, but I'll chip in as well to clarify a particular issue. Climate sensitivity is defined by three terms: a) The Transient Climate Response is the more or less immediate response to a new forcing. It has a technical definition, but can probably be best understood as the response that will be achieved in the minimum time it takes to measure an average climate state (a climatology),ie, within 30 years. It is dependent on a number of fast factors, including (most importantly) the cloud albedo feedback, the water vapour feedback, and the lapse rate feedback, but any factor which influences the Equilibrium Climate Response (or Charney Climate Sensitivity) will influence it. b) The Equilibrium Climate Response (also known as the Charney Climate Sensitivity,or the Fast Feedback Response) is the temperature change required to restore equilibrium assuming fast feedbacks but no slow feedbacks. Fast feedbacks include the cloud albedo effect, water vapour feedback, the lapse rate feedback, but also changes in albedo due to reduced sea ice or snow cover. They are characterized by feedbacks that reach an equilibrium state with temperature within decades. In contrast, slow feedbacks such as changes in albedo due to the loss of permanent ice sheets (Greenland Ice Sheet, West Antarctic Ice Sheet), changes in albedo due to massive changes in ecology (eg, the Amazon Basin becoming Savannah with isolated rainforest); changes in heat distribution due to large scale changes in ocean currents, and equilibriation of the partial pressures of CO2 in atmosphere and deep ocean. Slow feedbacks take centuries to millenia to reach equilibrium. As indicated, the Equilibrium Climate Response only accounts for fast feedbacks, and ignores all slow feedbacks. As a result, the time scale to the Equilibrium Climate Response is dominated by the time taken to establish equilibrium between the deep ocean and the surface in terms of temperature. As indicated above by others, that results in a rapid (less than 100 years) rise to about 66% of the response, followed by a slow movement to the equilibrium state (200 years or so). c) The Earth System Climate Response (or Earth System Sensitivity) is the response after all feedbacks, fast and slow have reached an equilibrium state. This takes centuries to millenia, and in the long term is governed by the glacial rate at which ice sheets melt. (OK, so I like puns. So sue me.) Because of this, we are unlikely to ever reach the Earth System Climate Response for the full measure of human emissions to the atmosphere. That is because while the ESCR takes millenia, over millenia the CO2 concentration will be drawn down. In fact, it will be drawn down to about 25% of the initial peak atmospheric concentration within a century or two, but take tens of millennia to return to pre-industrial levels. Therefore, unless the response to short term factors drives a release of natural CO2/Methane into the atmosphere of the same order of magnitude to total human emissions, our long distant descendants will face the Earth System Response to about 25% of our peak CO2 concentration rather than to the full peak concentration. That response will be about 60% of the peak warming (with large uncertainties). Given that the climate response predicted for about 2100 for BAU is about 60% of the Equilibrium Climate Response for the emissions, that is also the temperature increase we can expect for a period comparable with the entire extent of human civilization since the invention of agriculture, although it will peak at a higher level in the period 2100-2300 (assuming emissions growth is sharply curtailed at 2100 or earlier).
    0 0
  22. Thank you all for your very informative responses. This site performs a very valuable service for those of us who just want to get a grasp on the basic science.
    0 0
  23. Figure 2: Distributions and ranges for climate sensitivity from different lines of evidence. The circle indicates the most likely value. The thin colored bars indicate very likely value (more than 90% probability). The thicker colored bars indicate likely values (more than 66% probability). Shouldn'd second statement be: The thicker colored bars indicate very likely value (more than 90% probability). The thin colored bars indicate likely values (more than 66% probability) ?
    0 0
  24. MP3CE - no, the thinner bars are wider, meaning they encompass a larger range of possible values, which is why we have more confidence (90% as opposed to just 66%) that they encompass the correct value.
    0 0
  25. MP3CE@23, "probability" is somewhat simplistic and incorrect word in this context, hence your confusion. In statistics, to indicate uncertainty, we are talking about "percentiles", which means "the fraction of the probability distribution that falls into a given range of values. So, the thick/thin bars represent 66/90 percentiles of sensitivity distribution (in common language "likely"/"very likely" outcome that the true value of sensitivity falls on the bars. 66 and 90 numbers correspond to 1-sigma & 2-sigma in normal distribution, that's why they are commonly used.
    0 0
  26. Dana #4, I don't disagree that Lindzen's estimate of climate sensitivity is an outlier. Lindzen is arguing that the cloud feedback is negative, and not many agree. On the other hand, the last couple of years has been exceptional in the number of papers that revise downwards the IPCC best estimate of 3 K per doubling of CO2. I mentioned Schwartz (2012), Kohler et al. (2010), Schmittner et al. (2011), Gillett et al. (2011). I mentioned Held's work. I could have also mentioned Loeb et al. (2012) that found a best estimate of the TOA imbalance of about half of what Trenberth et al. were requiring. Hansen et al. (2011) found the TOA imbalance just a bit higher than Loeb et al. Levitus et al. (2012) has also found the imbalance from ocean data lower than expected. Notice, these are all the most recent estimates. Are there similarly recent estimates finding higher than expected warming? You write that there are reasons to believe that Schmittner et al. might be too low, presumably echoing statements made at RealClimate. But how do you explain Kohler et al. (2010), who find the same sensitivity using a completely different method? Gavin Schmidt told me that he agrees that Kohler et al. is the best and most up to date treatment of paleo forcing. If so, one needs to see that to get a best estimate of sensitivity even as high as 2.4 K, Kohler needed to assume a "scaling factor" to increase sensitivity by some amount (10% or 15% I think), despite it being quite possible that the scaling should have been even negative (I think Hargreaves and Annan is the ref for this, I'll have to check). They also had to go with the highest value in the literature for global cooling - 5.8 K from Schneider von Deimling et al. (2006). I would forget about Schmittner et al. You need to explain why Kohler et al. is too low, if you really want to argue that 2.3 K is too low. Meanwhile I see you wrote, "first of all, we at SkS always keep our posts free of ad hominem attacks, so there is nothing unusual about this." I wish that were true. Posts here at SkS are filled with personal attacks. I could give you plenty of examples, the most obvious being the graphics at the left hand side of every page - "Christy Crocks", etc. "Christy Crocks" is a personal attack. (-snip-) In the case of the present post I contragulated you because this post is above average for this website. It still does, however, contain ad hominem attacks. The first one I find is: "[Lindzen] is one of the relatively more credible climate contrarians (although he has a long history of taking contrarian positions on nearly every climate-related issue, and being almost universally wrong on those issues)". That is, indeed, an ad hominem attack, and an extraordinary overgeneralisation. "nearly every climate-related issue" - really? Lindzen has published over 300 papers, and several books, including a widely-cited graduate textbook on atmospheric dynamics. Unless you want to claim that atmospheric dynamics is not related to climate it is nothing short of bizarre to claim that Lindzen has disputed and then been wrong "about nearly every climate-related issue". On the subject of atmospheric dynamics, Lindzen's argument for low sensitivity has always been fundamentally a dynamical one. He has argued since the late 1970s that the observed distribution of climate change during ice age cycles (e.g. in CLIMAP 1976) where the tropics cool just a little relative to the poles which cool enormously implies operation of negative feedbacks in the tropics (e.g. Lindzen, 1994, Ann. Rev. Fluid Dynam.). I look forward to a future post here where you have understood the actual history of Lindzen's thought and address his dynamical considerations too. Finally, in your post #14 you echo a popular internet confusion about the equilibration of the climate system. You write, "the timescale to equilibrium is something of an unresolved question, which I think we'll be addressing in a future blog post. Off the top of my head, I think that after 50-100 years, somewhere in the ballpark of two-thirds to three-fourths of the equilibrium warming is realized. It mainly depends on how efficiently heat mixing happens in the oceans, which is the somewhat unresolved question". It sounds like you think that the equilibration timescale can be considered separately from the matter of the climate sensitivity. However, Hansen et al. (1985) showed that the timescale for equilibrium is related to the climate sensitivity. Thus, if Lindzen was right, the system would already be virtually in equilibrium - the timescale for a sensitivity of 0.7 K is just a few years. Schwartz has also made the same point (e.g. Schwartz, 2008). It is, thus, a circular argument to say Lindzen has ignored the unrealised warming, and use that as evidence that his argument is wrong. In Lindzen's model, there is no unrealised warming.
    0 0
    Moderator Response:

    [DB] "Posts here at SkS are filled with personal attacks."

    Incorrect, as you are operating with a flawed definition of ad hominem (see below). If the focus is on the argument, and not the individual, it is not ad hominem.

    Please constrain your comments to the science. A continued focus on presumed ad hominems will be construed as tone-trolling; moderation will then ensue accordingly.

    Insinuation of malfeasance snipped.

  27. "In Lindzen's model, there is no unrealised warming." Yes, so it is clearly wrong. The Earth still has a persistent energy imbalance (Loeb [2012]) which means further warming is in the pipeline. In essence Lindzen's model assumes the oceans will not take up much heat and therefore the atmosphere warms much more rapidly. This is the basic gist of low climate sensitivity, the oceans supposedly cannot take up this extra heat so the atmosphere warms quickly instead, until the system is back in equilibrium. In contrast, mixing heat down into the deep ocean slows the response time and allows the oceans to store much more heat - much of which is eventually given back to the atmosphere. This would signify greater climate sensitivity, and greater warming in the long-term. The trouble with Lindzen's ideas on this issue is that the climate has been much warmer in the past, which indicates larger climate sensitivity. It is the No.1 climate skeptic argument at SkS. In 'Greenhouse' intervals in Earth's history, the oceans were considerably warmer according to paleoproxy data - sea surface temperatures reaching as high as 38°C in the tropics. As Dr Richard Alley would say "That's Hot!" Furthermore, the deep oceans were much warmer, as were the seas around both poles. All of this is consistent with the mainstream estimates of climate sensitivity, but incompatible with low climate sensitivity, such as that argued by Lindzen.
    0 0
  28. To follow up on Rob P's comment, let me put up a simple analogy that explains why a suggestion that we can determine longer term CS from what has transpired to date is wrong. I own a swimming pool complex made up of 3 toddlers wading pools and an olympic size swimming pool. These pools are all connected by modest size pipes so they share a common water level. For convenience I label the toddlers pools A, I & L, and the Olympic pool O. I have a simple float valve system that maintains the overall water level - if it is a bit low the float valve starts to let some water in and brings the level back up until the float valve shuts off. I look at my pool complex and decide that the overall water level is being maintained too low so I adjust the float-valve to maintain a higher level. So water start to flow in. The float valve is located in my 'A' toddlers pool so this starts to fill. And the level in A starts to rise compared to the other 3 pools. As a result of this flows start to happen in the pipes connecting all the pools, transferring some water from A to I, L and O. So what will happen eventually? The levels of all the pools will reach a new equilibrium and the float valve will close. But what happens in the short term? Initially the level in A starts to rise because water is being added to it. So now it is higher than the other pools, so this start to create flows in the pipes across to the other pools. Eventually the flow out of A in the pipes matches the flow rate being added to A by the float valve. At this point the water level in A can't rise until the water levels in the other pools rises. This would only matter a little if we were just dealing with 'I' and 'L'. They are similar sizes to 'A' so the net impact of their presence would be to reduce the rate at which A is filled to one third. But O is an Olympic size pool. It is huge compared to the toddlers pools. So in the end, the rate at which the water level rises is limited by O. To raise the level of A by 1 inch, I have to add enough water to also raise I, L and particularly O, by 1 inch. So if I sit there with a ruler measuring the rise in A every 10 minutes after I start I will completely underestimate how long it will take to fill A because the volume of O is the main determining factor. So how does my analogy relate to Climate Change? The water is Heat. The water level is Temperature. A is the Atmosphere, I is Ice, L is Land and O is the oceans. The relative size of my 4 pools? A is 3, I is 3, L is 4, O is 90 - these proportions come from the last IPCC report. And the Float Valve? That is GH gas levels. Adding GH gases is akin to adjusting the float valve to raise the water level. So we add some GH gases, adjust the valve for a higher water level, then sit back and watch. At first Air temperatures rise. Then Ice melt and Land temperatures start to follow. And the Ocean starts to warm - slowly. So if we add some GH gases; adjust the float valve, the first response we see is that the water level in 'A' starts to rise. This is the transient climate response, the Transient Climate Sensitivity (TCS). Then the drain of water (heat) across to I, L & O will start to slow this rise and impose a slower rise rate, driven mainly by the size of 'O'. Eventually, over a much longer time period, all 4 pools will reach balance. This is the Fast Climate Response; remember, climate is about Mother Nature's timescales - decades are fast! The long term Equilibrium Climate Sensitivity over centuries and millenia is the equivalent of remodeling the swimming complex, changing the pumps and putting in different sized pipes. But there is an additional wrinkle to this. We haven't adjusted the float valve once and that's it! We keep on adjusting it every single day. Every day we add some more GH gases we are giving the valve another 'tweak'. So the level in A - the Atmosphere - will keep rising a bit because of our continual tweaks. When we eventually stop adding GH gases, the slower equilibration from I, L and O will produce a balance. Decades or centuries into the future. This is obviously a simplified description but it is still broadly valid.
    0 0
  29. Alex: I think you have still misundertood or misread Dana's argument. The first half of the article, whose conclusion you quoted and objected to in your first post, is not about the value of the EQS. It is about the fact that Lindzen either misunderstands or misrepresents the very meaning of the term. Dana's argument would stand whether the actual value is 3.0C, or 2.3C, or even 1.5C. Thus, arguing about the value is a strawman. In the second half of the article Dana discusses what is, as far as I am aware, the most recent comprehensive review of climate sensitivity in the literature. If you know a more recent one, then please tell us. You mention some recent papers, but I notice you don't mention Kirk-Davidoff (2009) or Tanaka (2009). There are many other recent works you've missed, off the top of my head Padilla et al (2011) and a 2011 paper by Cook? at Leeds. Given the different definitions of EQS as highlighted by Hansen & Sato's 'Paleoclimate implications', a comprehensive review is non trivial, and probably worthy of another Nature paper rather than half a blog post.
    0 0
  30. Alex #26 wrote: "That is, indeed, an ad hominem attack" In reference to: "[Lindzen] is one of the relatively more credible climate contrarians (although he has a long history of taking contrarian positions on nearly every climate-related issue, and being almost universally wrong on those issues)". 'Argumentum ad hominem' refers to a claim that a person possesses some negative trait completely unrelated to the topic of discussion in the hope that this will lead others to disregard that person's position on the topic. Lindzen's history on other 'climate-related issues' is certainly not completely unrelated to his 'cloud iris' position. Saying 'Lindzen does not make his alimony payments' (note: I have no idea if Lindzen has ever been married / even has alimony payments) would be an ad hominem argument to raise in regards to his stance on climate science. His previous stances on climate science are not. You seem to be redefining 'ad hominem' as 'said something bad about a person'. Skeptical Science does indeed say negative things about people... but that is not 'ad hominem' as the term is commonly understood. Rather, it is known as criticism. These people have said things about climate science which are provably untrue. Identifying these false climate science positions and explaining why they are wrong is basically the purpose of this web-site. Thus, you'll see plenty of criticism, but it will be on topic (i.e. relevant to climate change) and thus not 'ad hominem'.
    0 0
  31. alexharv074@26, you said: Posts here at SkS are filled with personal attacks. I could give you plenty of examples, the most obvious being the graphics at the left hand side of every page - "Christy Crocks", etc. "Christy Crocks" is a personal attack. You know that right? Your assessment of the nature of SkS articles is false and indicates that you likely misunderstand the meaning of "personal attack". Therefore, please take a note of the correct meaning of the term you are using, i.e. in wikipedia: ad hominem [...] is an attempt to negate the truth of a claim by pointing out a negative characteristic or belief of the person supporting it The characterization of someone's discourse as "Crocks" (slang term for "foolish talk, nonsense") does not imply "personal attack". It may be considered verbal abuse if it is not justified, however IMO it is justified and understood if you click at "Christy Crocks" button and read the author's debunking of various arguments by prof Cristy. Please also note that verbal abuse is not ad hominen. A hand waving statement "You know that right?" is the only support of your assessment. It is not only meaningless but can be considered the form of "shouting" similar to "upper-casing" prohibited by the comment policy on this site.
    0 0
  32. For contrarians like Lindzen, climate sensitivity must be low, or they have no case to make. They have acknowledged that GHGs will cause warming, and their only argument against taking serious action to reduce GHG emissions is this premise that the GHG increase won't cause very much warming. That is why we described this argument as the 'skeptic' endgame, and Gillis accurately described it as the dissenters' "last bastion."
    Sadly, no. There's also:
    • Climate scientists are right about how much warming to expect, but warming is good.
    • OK, it's bad, but anything we do to stop it would be worse.
    • OK, it's worth stopping, but we'll never get international agreement to do so.
    • OK, we could have stopped it, but it's too late now. If only those damn climate scientists had done a better job of warning us!
    Could probably fit a few more steps in there somewhere, too.
    0 0
  33. Kevin C, I think it's Crook not Cook. Also Andrews 2012 I think estimates best guess around 3.4K equilibrium sensitivity. FWIW Gillett was an estimate of transient sensitivity, not sure there's an easy "conversion" factor for equilibrium sensitivity... Overall I agree that none of this impacts the basic point that Lindzen was wrong to suggest we should have already seen 3C. Alexharv074 said: "Thus, if Lindzen was right, the system would already be virtually in equilibrium - the timescale for a sensitivity of 0.7 K is just a few years." But Lindzen was referring to what we should have seen if he was wrong, i.e. if sensitivity was 3K...so, he's still wrong!
    0 0
  34. Alex@26, I'm sorry but your entire post is essentially off topic and not relevant to the main post. Dana noted @4 that "...you're not addressing the point of the post", and you are still continuing to do so by presenting what could be construed by some as a Gish gallop of irrelevant and/or off-topic statements. Doing so is not helping your nor Lindzen's case. All that needs to be said/acknowledged is that Lindzen was wrong when he claimed "Yeah, and we should have seen 3[°C]".
    0 0
  35. alexharv074 @26 - apparently we agree on the substance of the post above, which is that Lindzen is wrong. It's true that by neglecting the global energy imbalance, Lindzen's "model" would effectively have zero 'unrealized warming'. However, since we know there is a global energy imbalance, we know his "model" is wrong (which is simply another way to describe the third Achilles' Heel from the post above). As for recent sensitivity estimates, that's a different subject. Some recent studies put it towards the lower end of the IPCC range, some in the middle, some towards the higher end. I'm not aware of any that put the value outside the IPCC range, except the flawed Lindzen and Choi papers. As for ad hominem, a couple of comments including CBD @30 have explained why you are incorrect on this point. Saying someone is wrong, or consistently wrong, is not ad hominem.
    0 0
  36. #23 @dana1981 and #24 chriskoz: Thank you both for clarifying me my mistake.
    0 0
  37. Alex is using the standard contrarian functional definition of ad hominem, which is roughly 'someone has stated that a named contrarian's idea/s is/are wrong'.
    Thanks for the interesting post and for keeping it unusually free of ad hominem attacks.
    It's very hard to see this as a constructive opening if the science is really what's at issue here...
    0 0
  38. Dana, (-Snip-) (-Snip-) Meanwhile, we do not agree that Lindzen is 'wrong'. I don't see where I said that so I am surprised that you feel we agree on that point. What we agree on is that Lindzen's estimate for climate sensitivity is lower than everyone else's, and that he may be wrong.
    0 0
    Moderator Response: [DB] Tone-trolling and moderation complaints snipped. Future comments constructed thusly will be deleted in their entirety. FYI.
  39. Alex @38, To be frank, it is very telling that you are concerned with "tone" and semantics in lieu of providing compelling scientific evidence that Lindzen's assertion is correct, doing so also speaks to the weakness of both his and your case. In fact, I'm surprised that some of your posts have not been deleted for being off topic. The comments policy states: "No off topic comments. Stick to the subject at hand." But I digress, given that you have elected to defend Lindzen, please demonstrate for us all here mathematically how we should have seen 3 C warming by now. I for one, will judge your defence/case solely on the merits of your theoretical argument.
    0 0
  40. "We should have seen 3C.". I will be pleasantly surprised when Alex states "this is wrong."
    0 0
  41. So, back to addressing the arguments, Alex, was Lindzen wrong to say we shouldve seen 3C by now?
    0 0
  42. (-Snip-)
    0 0
    Moderator Response:

    [DB] Your continued tone-trolling makes clear you cede the field on the topic of the OP of this thread: Lindzen's Clouded Vision, Part 1: Science.

    For the record, if you are unable to mount a presence here that focuses on the actual science & is presented in compliance with this site's Comments Policy (which poses no undue burden to the vast majority of commentators here), then you are welcome to take your interactions in climate science blogs to other venues.

  43. I posted something yesterday, and I don't see it here. I think I got carried away and broke the comments policy... sorry! Anyway, Lindzen's claims that models show higher climate sensitivity than empirical data bothers me a lot. After all, he's a working climate scientist, and can't possibly be unaware of all the papers on sensitivity, both from models and empirical data, that are largely consistent with each other (as shown in fig. 2).
    0 0
  44. Alexandre @43 - join the club! Lindzen's behavior has bothered me for a long time. He constantly says things which any climate scientists should know are untrue (hence our series of posts on his statements).
    0 0

You need to be logged in to post a comment. Login via the left margin or if you're new, register here.


The Consensus Project Website

THE ESCALATOR

(free to republish)


© Copyright 2024 John Cook
Home | Translations | About Us | Privacy | Contact Us