


 Arguments


New Research Confirms Global Warming Has Accelerated
Posted on 25 March 2013 by dana1981
A new study of ocean warming has just been published in Geophysical Research Letters by Balmaseda, Trenberth, and Källén (2013). There are several important conclusions which can be drawn from this paper.
- Completely contrary to the popular contrarian myth, global warming has accelerated, with more overall global warming in the past 15 years than the prior 15 years. This is because about 90% of overall global warming goes into heating the oceans, and the oceans have been warming dramatically.
- As suspected, much of the 'missing heat' Kevin Trenberth previously talked about has been found in the deep oceans. Consistent with the results of Nuccitelli et al. (2012), this study finds that 30% of the ocean warming over the past decade has occurred in the deeper oceans below 700 meters, which they note is unprecedented over at least the past half century.
- Some recent studies have concluded based on the slowed global surface warming over the past decade that the sensitivity of the climate to the increased greenhouse effect is somewhat lower than the IPCC best estimate. Those studies are fundamentally flawed because they do not account for the warming of the deep oceans.
- The slowed surface air warming over the past decade has lulled many people into a false and unwarranted sense of security.
The main results of the study are illustrated in its Figure 1.
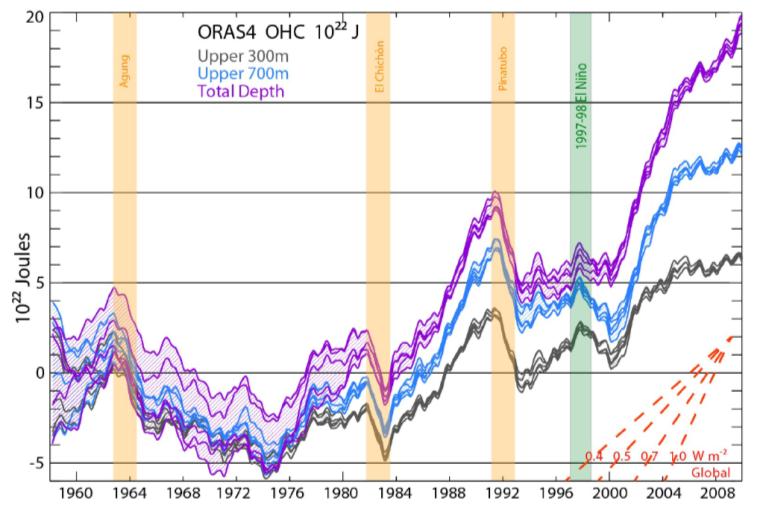
Figure 1: Ocean Heat Content from 0 to 300 meters (grey), 700 m (blue), and total depth (violet) from ORAS4, as represented by its 5 ensemble members. The time series show monthly anomalies smoothed with a 12-month running mean, with respect to the 1958–1965 base period. Hatching extends over the range of the ensemble members and hence the spread gives a measure of the uncertainty as represented by ORAS4 (which does not cover all sources of uncertainty). The vertical colored bars indicate a two year interval following the volcanic eruptions with a 6 month lead (owing to the 12-month running mean), and the 1997–98 El Niño event again with 6 months on either side. On lower right, the linear slope for a set of global heating rates (W/m2) is given.
The Data
In this paper, the authors used ocean heat content data from the European Centre for Medium-Range Weather Forecasts' Ocean Reanalysis System 4 (ORAS4). A ‘reanalysis’ is a climate or weather model simulation of the past that incorporates data from historical observations. In the case of ORAS4, this includes ocean temperature measurements from bathythermographs and the Argo buoys, and other types of data like sea level and surface temperatures. The ORAS4 data span from 1958 to the present, and have a high 1°x1° horizontal resolution, as well as 42 vertical layers. As the authors describe the data set,
"ORAS4 has been produced by combining, every 10 days, the output of an ocean model forced by atmospheric reanalysis fluxes and quality controlled ocean observations."
Accelerated Global Warming
As illustrated in Figure 1 above, the study divides ocean warming into three layers for comparison – the uppermost 300 meters (grey), 700 meters (blue), and the full ocean depth (violet). After each of the Mt. Agung, Chichón, and Pinatubo volcanic eruptions (which cause short-term cooling by blocking sunlight), a distinct ocean cooling event is observed in the data. Additionally, after the very strong El Niño event of 1998, a cooling of the upper 300 and 700 meters of oceans is visible as a result of heat being transfered from the surface ocean to the atmosphere.
One of the clearest features in Figure 1 is the rapid warming of the oceans over the past decade. As we have previously discussed, the warming of the shallower oceans has slowed since around 2003, which certain climate contrarians have cherrypicked to try and argue that global warming has slowed. However, more heat accumulated in the deeper oceans below 700 meters during this period. The authors describe the ocean warming since 1999 as,
"the most sustained warming trend in this record of OHC. Indeed, recent warming rates of the waters below 700m appear to be unprecedented."
Their results in this respect are very similar the main conclusion of Nuccitelli et al. (2012), in which we noted that recently, warming of the oceans below 700 meters accounts for about 30% of overall ocean and global warming. Likewise, this new study concludes,
"In the last decade, about 30% of the warming has occurred below 700 m, contributing significantly to an acceleration of the warming trend."
The warming of the oceans below 700 meters has also been identified by Levitus et al. (2012) and Von Schuckmann & Le Traon (2011), for example.
Some 'Missing Heat' Found
Kevin Trenberth's past comments about 'missing heat' drew considerable attention. The phrase refers to the fact that the heat accumulation on Earth since about 2004 (e.g. from warming oceans, air, and land, and melting ice) that instruments were able to measure could not account for the amount of global heat accumulation we expected to see, based on the energy imbalance caused by the increased greenhouse effect, as measured by satellites at the top of the Earth's atmosphere.
These new estimates of deeper ocean heat content go a long way towards resolving that 'missing heat' mystery. There is still some discrepancy remaining, which could be due to errors in the satellite measurements, the ocean heat content measurements, or both. But the discrepancy is now significantly smaller, and will be addressed in further detail in a follow-up paper by these scientists.
So what's causing this transfer of heat to the deeper ocean layers? The authors suggest that it is a result of changes in winds related to the negative phase of the Pacific Decadal Oscillation and more frequent La Niña events.
Good News for Climate Sensitivity? Probably Not
Recently there have been some studies and comments by a few climate scientists that based on the slowed global surface warming over the past decade, estimates of the Earth's overall equilibrium climate sensitivity (the total amount of global surface warming in response to the increased greenhouse effect from a doubling of atmospheric CO2, including amplifying and dampening feedbacks) may be a bit too high. However, as we previously discussed, these studies and comments tend to neglect the warming of the deep oceans below 700 meters.
Does the warming of the deep ocean support these arguments for lower equilibrium climate sensitivity? Probably not, as Trenberth explained (via personal communication),
"it contributes to the overall warming of the deep ocean that has to occur for the system to equilibrate. It speeds that process up. It means less short term warming at the surface but at the expense of a greater earlier long-term warming, and faster sea level rise."
So the slowed warming at the surface is only temporary, and consistent with the 'hiatus decades' described by Meehl et al. (2011). The global warming end result will be the same, but the pattern of surface warming over time may be different than we expect.
The real problem is that in the meantime, we have allowed the temporarily slowed surface warming to lull us into a false sense of security, with many people wrongly believing global warming has paused when in reality it has accelerated.
Global Warming Wake Up Call
Perhaps the most important result of this paper is the confirmation that while many people wrongly believe global warming has stalled over the past 10–15 years, in reality that period is "the most sustained warming trend" in the past half century. Global warming has not paused, it has accelerated.
The paper is also a significant step in resolving the 'missing heat' issue, and is a good illustration why arguments for somewhat lower climate sensitivity are fundamentally flawed if they fail to account for the warming of the oceans below 700 meters.
Most importantly, everybody (climate scientists and contrarians included) must learn to stop equating surface and shallow ocean warming with global warming. In fact, as Roger Pielke Sr. has pointed out, "ocean heat content change [is] the most appropriate metric to diagnose global warming." While he has focused on the shallow oceans, actually we need to measure global warming by accounting for all changes in global heat content, including the deeper oceans. Otherwise we can easily fool ourselves into underestimating the danger of the climate problem we face.
Note: this post has been incorporated into the new rebuttal to the myth "No long tail means climate sensitivity is low", as well as "global warming stopped in [insert date]" and "Trenberth can't account for the lack of warming".
Also see this Carbon Brief post on the Balmaseda et al. paper.


That confirms my opinion pronounced here a year or two ago, that we should use OHC as the measure of GW rate. We should virtually discontinue watching the LST with their ElNino/LaNina perturbations. Those perturbations have much lesser impact on OHC. In fact, current LaNina cycle should have "apparently" increased the OHC, contributing to the subject acceleration.
Few yaers back, we did not know how to measure OHC, now with the ARGO float we do measure it better and better. At some point I guess we may measure it so accurately that the difference betwen OHC and AHC (from global and vertical temps profile) will be used as a measure of ENSO.
Does the ocean heat data suggest that 'global warming' only started around 1975 (ironically as solar irradiance started to decrease somewhat). Or rather what little warming did occur before that date was being dumped into the low thermal mass of the atmosphere? I suppose we would need to know more about ocean temperatures before the 1950s to confirm that, but based on the limited timespan of measurements it's an interesting possibility.
Chris - could you kindly translate your plethora of acronyms into plain english please ?
Ps: OHC - Acronyms and Abbreviations - The Free Dictionary
acronyms.thefreedictionary.com/OHCAcronym, Definition. OHC, Overhead Camshaft. OHC, Outer Hair Cells. OHC, Ocean Heat Content. OHC, Ontario Health Coalition (Canada). OHC, Order of the ...
- What does D-LST stand for? D-LST Acronym / Abbreviation Meaning ...
worddetail.org/acronym_and_abbreviation/d-lst25+ items – Find out more on D-LST similar meanings, acronyms and ...
No Abbreviation Stand For
1 D-LST Drug lymphocyte stimulation test
1 D-M Diencephalon-mesencephalon
What does LST stand for? LST Acronym / Abbreviation Meaning ...
worddetail.org/acronym_and_abbreviation/lst/2LST abbreviation stands for: Leishmanin skin test. There are 62 meanings or full forms for LST in total. | Page: 2.
Dana,
Eyeballing the figure, it look as if the warming rates of all layers have been faster in the first half of last decade 2000-4 than today. What's the explanation? Would it be that current ENSO have been slowly transitioning to ElNino?
Second question. Those dashed W/m2 lines are hard to align with 3 trends in order to estimate how the ocean is balancing its energy. If we were to estimate that, would it be in the order of 0.5 or 0.7W ? And what's the relationship between that energy flux and TOA radiative imbalance? I guess not necessarily 1:1...
Chappo@4
OHC - Ocean Heat Content (you found it)
LST - Land surface temps
AHC- Atmosphere Heat Content (I concede may have made it up)
ENSO - ElNino Southern Oscilation Index
ARGO - refered in the article itself
What brought about the shift from increasing atmospheric temperatures to increasing ocean temperatures?
Will this change be sustained or will the air go back to rapid warming again?
Presumably the oceans are being warmed by the atmosphere, or alternatively the atmosphere is being cooled by the ocean acting as a heat sink. With the reduced warming of the atmosphere will the warming of the oceans slow down or is the CO2 concentration warming the oceans independently of the air temperature?
I was under the impression the ARGO buoys only measure down to 700m at present. Is there a program under way to measure temperatures all the way down to the sea bed?
Sorry for all the questions but the paper seems aimed at specialists who probably know all this wheras I am just an inquisitive amateur.
Thanks Chris. But you'd do your yourself a service, and us, and perhaps the planet, if you'd use plain english :)
I am also curious about what would cause the proposed increased heat content of the oceans to "come out" and thus warm the climate. My curiosity is built around the assumption that the warmer air mass must have transferred heat to the ocean ( warmer to colder ) and that raises the thought that the atmosphere would have to get colder than the ocean for it ( the air ) to be warmed by the sea.
In the meantime the atmospoheric CO2 continues to rise leading to a warmer atmosphere.
Craig, here's Levitus et al. 2012. The methodology section will give you part of the answer.
CO2 does not warm the oceans independent of the indirect downward longwave radiation mechanism (increased skin temp forces a "deepening" of the convective temp gradient) and the direct method of surface layer mixing.
Also, the ocean-atmosphere relationship is extraordinarily complex and is the reason why modeling requires massive computing power. One can also add ice into the mix: global ice mass loss has accelerated in the last decade, despite what appears to be a surface temp flattening.
Craig: One way that the ocean can transfer heat to the atmosphere even though the local air temperature is warmer than the water temperature is through evaporation. When water evaporates, the water vapor carries off the heat energy required to change from the liquid sate to a gaseous state, leaving the remaining water a little cooler. Air masses are more mobile than the ocean waters, and when they move to a cooler region, the water vapor condenses as rain or snow, leaving the heat energy in the atmossphere.
Craig King - In short, ocean variations such as the ENSO affect the rate of heat absorption by the oceans - La Nina exposing colder waters to the surface, warming the ocean faster but cooling the atmosphere, while El Nino slows ocean warming leaving more of the energy imbalance in the atmosphere. Given that >93% of warming is going into the oceans, ~2.3% into the atmosphere, even a small rate change in ocean warming relative to the total greenhouse gas imbalance will have a huge effect on air temperatures.
Note that the energy flow is sun -> ocean -> atmosphere -> space, not the atmosphere -> ocean. A warming atmosphere causes ocean warming by slowing that energy flow from the ocean to the atmosphere. But if ENSO and other variations bring cold water to the surface, reducing atmospheric heating, air temperatures will then drop.
In other words, the atmosphere is to the ocean as the tail is to the dog - tied to ocean temperatures, but far more variable, even moving backwards at times.
If we state that we know total OHC, then by definition, we are stating that we know the integrated profile of ocean 'masses X temps' globally from sea-surface to sea-bed. If so, then it is certainly possible to express OHC not only as joules but as avg-weighted temp by simply dividing OHC by total mass. Note: I am simplifying this math by assuming Cp is constant thru-out the ocean profile. Rigorous research would include Cp variations [=fx(T & salt-content, etc)] into the profiling if found significant.
Better yet: Has any research been done to express O+AHC (combine the two) on an integrated "mass x heat capacity" weighted-avg basis (I would be very surprised if not). If so, this expression would be better because it would keep ENSO events 'inside the thermal box' and thus eliminate the "confounding" ENSO factoring when looking at OHC or AHC in isolation (as is common on LST graphs & also done in Fig-1 above, i.e. with the 1998 El-Nino notation).
Same as with my paragraph #1 above, if we state that oceans are 90% of the heat content, then we are stating that we know all the masses & heat capacities globally (from outer atmos down to lower sea-bed). Therefore, we have all the know-how to express O+AHC on either a joule basis or, better yet, on a 'wgtd mass x Cp' temp basis (the latter simply by dividing the joule value by total 'mass x Cp'). In my opinion, the latter is a more visceral, and therefore, better expression.
Is any research moving in the direction of developing a total integrated weighted-avg O+A heat content or temp? This would seem to be worth consideration.
Trenberth recently mentioned the mising heat here;
http://www.rmets.org/weather-and-climate/climate/energy-and-climate-dr-kevin-e-trenberth
perseus @2 - the pre-1975 ocean data in this paper look similar to the surface data, in that they did not warm much during mid-century, likely due to aerosol cooling offsetting greenhouse gas warming. That's an interesting point, because some suspect that the mid-century surface 'cooling' was due mainly to natural cycles, but if that were the case, we would expect to see ocean warming during that period. That being said, the uncertainty during that timeframe is rather large.
chriskoz @4 - could be due to increased aerosol emissions, or the transition to Argo data, or something else. The W/m2 trends depend on what timeframe you're looking at. Since 2000 it's close to 1 W/m2, but obviously the trend decreases if you start before that.
Craig @6 - see the end of the Some 'Missing Heat' Found section. They suspect it's due to a shift to the negative PDO phase, though that was discussed in the supplementary info, which I didn't have a chance to read.
C_p is in fact very constant with pessure and temperature, (less than 1% for realistic values). Though it does vary with considerably with salinity (drops in saline water such as the Med where the salinity can be about 37-38ppt rather than the more normal 35ppt). What varies considerably with temperature is the thermal expansion coefficient. Warm water expands a lot more than cold water. Typical values of the thermal expansion coefficient are 0.0551e-3 0.1690e-3 0.2591e-3 and 0.3351e-3 for 0, 10, 20 and 30 degrees C respectively.
a) Heat going into the deep ocean slows sea level rise
b) Monitoring sea level rise will give clues as to where the heat is going. The fact that it is seems to be a fairly constant 3.2 mm/year despite rapidly increasing ice melt indicates that a lot more of the heat must be going into the lower ocean
chriskoz @ 1
That has long been the opinion of Roger Pielke Senior, whose views have received some attention here at SkS. While OHC may be the best indicator, nothing would be better than the completest accounting of all the energy in the system - surface, ocean, ice, atmosphere etc.
As for mechanisms, for one thing, Antarctica is producing a lot less very-cold "bottom water" in the offshore basins.
http://www.skepticalscience.com/Southern-Ocean-research-shows-continuing-deep-ocean-change_CSIRO.html
The apparently very low rate of ocean heat content increase from 1958 to 1984 was very puzzling to me, even accounting for the error bars. I had assumed for some time that despite the 1940-1970 slowdown in global surface warming (partially explained by a rising concentration of sulphate aerosols) the OHC was still increasing very much during that period as the continued sea level rise apparently testifies. But now, if the mid 20th century slowdown in global surface warming occurs at the same time as a slowdown in OHC increase, how do we account for the lack of slow down in the rate sea level rise from 1958 to 1984?
StBarnabas's remark seemd very enlightening and suggestive to me. Could it have been that much more heat was propotionately gained by the upper warmer layers of the oceans (where the thermal expansion coefficient is much higher)? Unfortunately, the breakdown of layers in Figure 1 above doesn't seem to support that hypothesis. So I remain puzzled. What caused the sea levels to rise so much during that period of very slow OHC increase? (Melting ice sheets contributed little, I think).
I have a question for the crowd. A recent paper suggested that volcano aerosol emissions were to blame for a lack expected warming over the last decade or so. Here's a link to climatecentral's coverage: http://www.climatecentral.org/news/volcanoes-may-mask-lost-warming-15683
This research would seem to contradict that paper. Are these papers in fact contradicting each other or ????
mehus @19 - I believe that paper is actually discussing the lack of warming higher in the atmosphere, but it could also explain the slight slowdown in ocean warming over the past few years.
@mehus #19:
The article that you have provided the link to is:
Volcanic Eruptions May be Masking ‘Lost’ Warming by Alex Kirby, Climate News Network/Climate Central, Mar 11, 2013
As fate would have it. the following article by the same writer was posted today:
Volcanic Eruption in Iceland Did Little to Lower CO2 by Alex Kirby, Climate News Network/Climate Central, Mar 25, 2013
Both articles are based on peer reviewed published papers that suggest volcanic aerosols have played a part in the recent slow down of atmospheric warming. Neither article suggests that volcanic aerosols were the sole cause.
barry:
I remember Roger Sr.'s arguments in favour of using ocean heat content (OHC), rather than atmospheric temperatures. I think he was active in discussions at both SkS and RealClimate at the time. A few things I remember were:
- I had the impression he really only wanted to look at recent OHC, particularly Argo data, and particularly the 0-700m depth. I also had the impression that he wanted to do that because it suggested less warming (compared to 0-2000m data) and was a much shorter record than surface temperatures. The short record made it easier to justify a "wait and see" position - a "we don't have enough data for long enough" position. Overall, an argument for the status quo, AKA "business as usual". I thought his preference was based on the conclusions he could draw from it (avoiding stuff that gave the "wrong" message), rather than a rigorous scientific analysis.
- I remember discussions (particularly at RC) about him claiming that you could "see the heat moving" and actually estimate the fluxes just by looking at changes in ocean temperature. He seemed to not have a clue about the differences between "flux" and "flux divergence", and could never actually describe a methodology by which you could calculate the fluxes. It was all pretty hand-wavey, and left me with the impression that he really didn't know what he was talking about.
That said - yes, the total energy content of the earth-atmosphere system would be a nice thing to have, but keep in mind a couple of things:
- even though it is noisier, the records of surface air and sea surface temperatures go back a long way, and we have well over 100 years of near-global coverage
- surface temperatures and deeper ocean temperatures are linked by physics, so the long surface temperature record can't wander willy-nilly all over the place, independent of deeper ocean temperatures.
- thus, limitations noted, the surface temperature record is still useful.
Pierre-Normand:
Due to time lags in moving energy/heat around, there is no reason to think that deeper ocean temperature changes will be in lock-step with surface changes. The upper ocean mixed-layer (60-100m) will interact with the atmosphere quite quickly, but deeper ocean temperatures can be responding to surface changes from decades ago.
A similar phenomenon happens on land: at depths of a few tens of cm, the daily cycle of surface temperature is both reduced in amplitude and lagged in time. The maximum or minimum temperature at 10-20 cm depth will happen several hours after the surface max/min. (Details depend on the thermal properties.)
Craig
'The ocean lag means heat will come out of the oceans' idea is a common interpretation of the meaning of the lag but it is wrong. An anlogy might help.
I have two swimming pools I want to increase the level of, a little toddlers pool and an olympic size pool. They are connected by a pipe so water can flow between them and they will have the same water level. I start adding water to the toddlers pool and it's level rises. As that happens water starts to flow through the pipe to the olympic pool. But it's level rises much more slowly because of its much greater volume.
Eventually I might even see the rise in the level in the toddlers pool slow down so that it is only rising as fast as the olympic pool. What is happening is that as fast as I add water to the toddlers pool, the same amount flows out through the pipe to raise the level of the big pool. This will continue until I stop adding water to the toddlers pool and they can all reach equilibrium.
The big pool is restricting the rate at which the little pool can rise. But when I stop adding water, the final level in the toddlers pool isn't because water starts flowing into it from the olympic pool. It is because water stops flowing out of it to the olympic pool.
The water in my anaolgy is heat, toddlers pool is the heat content of the atmosphere, the olympic pool is the heat content of the oceans.
To extend the analogy, instead of just turning on a tap to fill the pools, imagine that I have a float valve - if the level is too low, water flows in until the level rises to the setting on the valve then the valve closes. The height setting on the float valve is the Greenhouse Effect. This determines how much heat needs to be in the system.
So if I increase the GH effect by adding CO2, I am doing the equivalent of adjusting the float valve to a higher level. If I was just filling the toddlers pool (atmosphere) the level would have risen very quickly. But since most of the extra water (heat) actually has to go into filling the olympic pool (ocean) that retards the rise of the toddlers pool.
If I make a one-off adjustment to the float valve, it takes some time for it all to catch-up. In reality I am continually lifting the valve higher and higher; continually adding more and more CO2. So even the toddlers pool alone would need to keep rising to catch up although alone it could do that quickly. But even if I stopped right now, and didn't adjust the valve any further, it would still take substantial time for the Olympic pool to catch up and all rising to stop.
But at no time does water (heat) need to flow the other way.
We could extend this analogy; instead of 1 olympic pool, we could have a linked series of mini-olympic pools, each one connected to the next. The rise of each pool would be retarded by the delay in raising the level of the next pool in the chain. Each of these mini-olympic pools would then correspond to different layers and regions in the oceans.
Given that the increased activity of above ground volcanoes is supposed to be stopping global warming, I presume this increased activity is limited to those 30% of volcanoes and not the 70% that we can't see under the oceans. Given that there are enormous numbers of undersea volcanoes (I have seen estimates of a million or more) I guess there would have to be some extra deep ocean warming when more erupt than usual.
The tectonic plates are now supposed to be moving a little more than they were in the 20th C. This should manifest in a higher incidence of great (8+) earthquakes. In fact since 2004 the incidence rate has increased by around a factor of 6 or 7. I don't think there a good enough records to measure how much the above ground volcanic activity has increased but if Alex Kirby is correct then the same must be occuring undersea.
Bob Loblaw,
Tanks for helping me there. Reading your post I had an 'Aha!' moment and wondered how I hadn't thought of that obvious time delay explanation. I knew a bit about the mixed layer, thermocline, etc. But trying to think it through, much of my puzzlement remains. Such an explanation would possibly explain a pause in sea level rise while OHC continues to rise. But how can the reverse occur? If the ocean rise is a delayed response to past warming, this means that heat previously sunken in deep layers is now moving to upper layers... How might this happen?
El Nino or neutral events that follow La Nina events also tend to result in a net transfer of run-off water from lands to oceans. So this may also contribute to the sea level rise in spite of the reduced OHC increase. El Ninos events of course promote such a reduction.
Brenty - The increased level of atmospheric sulfate aerosols from tropical volcanoes over the last decade, blocked sunlight reaching the Earth's surface, which has contributed to a very slight reduction in warming. This is not the same as your claim.
There are a number of problems with the idea of undersea volcanoes warming the ocean, but the greatest obstacle is that the volcanoes would have to be upside down on the sea surface, because the heat is originating at the surface and propagating downwards.
Pierre-Normand - There is some scientific literature that suggests a slowdown in sea level rise (SLR) coinciding with the slowing of ocean heat content during the 1960's to 70's.
Church (2004) has this SLR slowdown during the 1960's, and Kohl & Stammer (2008) have this persisting into the 1970's.
There is a great deal of variation between all the sea level estimates prior to modern satellite-based observations, but it may not be necessary to invoke novel mechanisms.
Add in the fact that much more of the Antarctic than previously thought is grounded below sea level (reported on the BBC web site; full paper here), and things have taken a decided turn for the worse. Warmer oceans + lots of ice grounded below sea level … do I need to join the dots?
Maybe Hansen was right back in 2007 about the potential for very rapid sea level rise:
– and the scary thing is that Hansen issued this warning without the latest data on how much of the Antarctic is grounded below sea level.
Rob Painting,
That's very useful. Thank you. If there indeed was this slowdown in sea level rise, aerosols and ENSO would seem to possibly account for everything, including Figure 1 above. Aerosols would account for part of the reduction in OHC trend, while El Nino dominated ENSO would further flatten this trend while contributing to the remaining small rate of sea level rise through water run-off (adding up to the small contribution from continued ice-sheet and glacier melt). Everything seems to fit.
@Glen . . thanks for that analogy but surely ultimately the two pools would be at the same level. Likewise surely the atmosphere cannot be warmed by the ocean to a temperature higher than the ocean.
With regards to the evaporation, surely while it does lower the temperature of the water it cannot raise the temperature of the air above that of the ocean. I am thinking at a global rather than a topical sense.
Couple Questions...
1. The purple line "overall depth" ... Is this 0-2000m, or is this 0-700m? (I'm looking for a chart that shows 700m-2000m warming over the past 30 years. (presumably this is the whole matter being discussed anyway). From what I think I'm seeing, the purple line minus the blue line gives us the bottom 1300m?
2. More frequent La Ninas and the negative phase of the PDO are the reason for the increased transfer of Global Warming contribution into the deeper oceans in the last 15 years... This means previously the oceans were not the receptor of as much GW heat content? What allows us to track with relative certainty the variable contribution percentage of GW into the deep ocean?
Craig King wrote:
I think this reveals a misunderstanding, though I'd be hapy to be educated by the climate scientists. The ocean can be cooler than the atmosphere and still modify the atmosphere's temperature in an upward direction compared to an even colder ocean. It doesn't have to provide the heat (which comes from the sun); it just has to modify the heat flows.
Can cold milk make a hot coffeee hotter? Simplistic thinking would say no, because how could heat flow from the milk to the coffee?
But what if I usually whiten my coffee with icecream, and one day I replace the icecream with cool milk? The use of cool milk will lead to a warmer coffee than the original situation - not because heat has flowed from cool milk to hot coffee, but because less heat has flowed into the whitener than when icecream was used.
"So what's causing this transfer of heat to the deeper ocean layers? The authors suggest that it is a result of changes in winds related to the negative phase of the Pacific Decadal Oscillation and more frequent La Niña events."
OK... I'm sort of puzzled here. The PDO is what it is and the Meehl paper seems to explain the heat transfer.... though warm water going down seems "odd" ... but how does the wind carry heat into the deep ocean? Wind can carry less heat away from the surface? Is this a loosely worded summary that misleads? Looking at what the links to the briefs on Meehl say I am missing something ?
bjchip, try Skyllingstad et al. (2000), Schewe & Leverman (2010), the wiki on Langmuir cells, the wiki on Ekman pumping, and Stewart & Thompson (2012). Wind can drive vertical circulation in a variety of ways, from micro to macro scales.
Salamano @32 - the purple is at least 0-2000m, though I think I recall reading it's even deeper than that, like to 5000 meters. I could be wrong, but that's what I recall.
Pierre-Normand:
I was only thinking in terms of the heat transfer and temperature changes, and have not thought through the implications for sea level rise. My limited understanding is that the pressure changes with depth affect the rate of expansion for a given temperature change, and the actual temperature has an effect, too - e.g., maximum density of fresh water is at 4C, so either cooling or warming at that point will cause expansion. (If water continued to contract as it approached freezing, lake ice dynamics would be very different!) Salinity plays a role on density and movement, too.
...but I think that most of the short-term variations (a few years) are related to the water cycle and movement of water between land and oceans.
Craig King: "evaporation ... cannot raise the temperature of the air above that of the ocean."
Evaporating water at the surface requires energy - lots of it. As the water vapour rises, it will eventually condense and form clouds, and then rain out. Globally, it's pretty hard to have a situation where evaporation and precipitation don't balance out on any reasonable time scale.
What do you think happens to the energy that is released when water vapour condenses back into liquid water? Is there a potential that it affects air temperature?
Craig King - Further to Bob Loblaw's comments; that global surface air temperatures are warming faster than upper ocean temperatures is well-observed and completely uncontroversial.
You will have to reconsider what you think you know about this topic. Consider, for instance, that the heat capacity of the ocean is about a thousand times that of the atmosphere. What happens when this ocean heat is exchanged with the overlying air?
BJ Chip - Note that observations do lend support to the modelling shown in Meehl (2011). For instance: Decadal Spinup of the South Pacific Subtropical Gyre - Roemmich (2007).
And the observed warming of the oceans shows heat penetrating down to the depths, in ocean basins, at the latitudes occupied by gyres (large slowly rotating masses of water). As in the figure below from Levitus (2012).
It will be very interesting to read the follow up paper to Balmaseda (2013).
Regarding heat flow between the ocean and atmosphere, keep in mind that hte average surface temperature of the global oceans is about 17C, which is warmer than the near-surface atmosphere (on average). Heat exchange occurs at the boundary (surface water/air), so it is not a case of a cooler ocean warming a warmer atmosphere - on average.
In reality, there is constant flux with sea surface temps being at different times and places, cooler and warmer than air temps. This is the weather, and is largely responsible for heat flow between atmosphere and ocean.
But a couple of analogies above cover the possibilities. The oceans and atmosphere are at different temperatures, but they will affect the other if the energy in either is changed. Heat or cool either one, and the other will heat or cool accordingly. If I've been using ice cream to whiten my coffee, then using milk instead - even though it is cooler than the coffee - will result in hotter coffee than when I used ice cream. (I like that analogy, Leto)
Same with the upper and lower atmosphere. If you were able to heat the stratosphere, the troposphere below would also warm up, even though the stratosphere is cooler than the troposphere. The dynamics that keep them at different temperatures do not stop heat flowing between them.
Craig @31
"...surely ultimately the two pools would be at the same level...". Yes, but the ultimately is the time lag. In the shorter term they aren't.
bjchip
Further to Rob P's comment, some thoughts.
Winds can be part of what drives the gyres, just as blowing on water can move it. So changes in any of the regular winds such as the trade winds can potentially change the speed of a gyre. Any circular water flow will tend to push water in towards it's center - sea levels are higher at the centre of the gyres as a result. If water is being pushed towards the centre it has to go somewhere and down is the only option. So a gyre can create a downwelling at its centre. Change the speed of the gyre and you would change the speed of the downwelling, and thus the amount of heat carried with it.
barry @ 41:
Averaging can hide a lot of sins, so your point about variable conditions is quite important.
As a further complication, one must keep in mind that both atmospheric and oceanic energy transfer is dominated by turbulent mixing, not conduction. Although it is a reasonable simplification to think of the transfer of thermal energy in a conduction-like model - where flux is related to the temperature gradient using a turbulent transfer coefficient - it is quite possible to have time-averaged flux moving in the opposite direction to time-averaged temperature gradient.
I'll start by only considering a one-dimensional case - the vertical (because that's the primary direction to think about when we're looking at ocean-atmophere fluxes). Instantaneous turbulent thermal transfer is the result of instantaneous vertical movement (of air or water), multiplied by the thermal energy content. Gradients are irrelevant - in this instantaneous case. To get the average flux over time, you need to average the instaneous variations in (motion x heat content). You can also get fluxes of other things the same way - by measuring humidity, CO2, or whatever. For atmospheric fluxes, measurements of this type are called "eddy correlation" or "eddy covariance", and you can actually buy systems off the shelf. By averaging over time, you can also get the average vertical velocity (which should be zero if you aren't in a plume) and average temperature - and gradients if you measure at more than one height.
The catch with such measurements is that the turbulence that transfers the energy is not independent of the temperature gradients. The atmosphere changes in its stability - a strong vertical temperature gradient can either increase turbulence (if it is warmer below - warm air wants to rise) or decrease turbulence (cold air below - tends to resist upward movement). [Note: I've greatly simplified this explanation of stability - I can go into more detail.] You can have a long period of cold air at the surface with little turbulent mixing and little energy transfer, followed by a short period of a warm surface and lots of turbulence and energy transfer - ending with a time average of warm over cold, but a time average of upward energy transfer. Thus, by looking at time averages, it looks as if energy flow is going against the gradient. This is not a problem with the physics (no 2nd Law violations here!) - it is a problem with the simplified model of looking at time averages, and expecting turbulent transfer to look just like conduction.
The same can happen with oceans, although the density changes with temperature and the stability considerations for turbulence are not the same. Oceans also add salinity, which affects density and motion.
[And this is the sort of detail that Roger Pielke Sr. seems to be unable to understand... which is why I said earlier that he didn't seem to know what he was talking about]
Fascinating. I wasted 2 hours last week trying to find detailed ocean current mass & velocity info to figure out whether kinetic energy is significant. I gather it isn't, from a totally uninformed estimate by me I suppose it's maybe ~4 decimal orders of magnitude less than the magnitudes of heat changes ?
mehus@19 dana1981@20 John Hartz@21 I inferred from Kevin Trenberth lecture on Utube that "missing heat" was discrepancy between radiation imbalance (KT stated 0.9 wm**-2) & delta ocean heat expected from it. If so, volcanos aerosols & others would not affect "missing heat". Did I misunderstand what the discrepancy was ? Was it rather a discrepancy twixt the underlying physics, or models, & prior delta ocean heat measured ?
@grindupBaker:
Unlike most SkS authors, I am not a climate science wonk and therefore am not able to respond to your question. I suspect that others will do so however.
GrindupBaker - Dr Trenberth was lamenting the inadequate state of global observations. He was not literally saying the heat was missing - just that we lacked the ability to measure where it was i.e the deeper ocean. In essence, he was urging scientists to work harder on solving this problem. Contrarians have predictably twisted the intent of Dr Trenberth's words, but that comes as no surprise.
The ARGO network has remedied the inadequacy of the ocean measurements to some extent, but they still only measure down to 2000 metres - whereas the the global oceans are over twice that depth on average.
Still a lot of work to be done, and a deep-ocean observation system would be desirable but, as Balmaseda (2013) has demonstrated, the observations show that global warming has actually accelerated over the last 16 years.
This implies that the climate sensitivity (the temperature increase with a doubling of atmospheric CO2 concentration) is at the higher end of the range of estimates.
Question:
Does this data indicate that Trenberth's modeled global energy budget (http://www.skepticalscience.com/Tracking_Earths_Energy.html) underestimated surface absorption and consequently underestimated Aerosol-cloud cooling?
The AR-5 reduced its estimates for the value of negative forcing caused by aerosols. Does this then indicate that there is a higher uncertainty for these values, potentially stronger negative forcing?
Balmaseda et al., 2013 has reanalyses of OHC
http://onlinelibrary.wiley.com/doi/10.1002/grl.50382/abstract
the divergences of the traces since 2000 seemed interesting so i plotted the differences
http://membrane.com/sidd/balmaseda-2013.html
when will the Kraken rise ?
sidd