Climate Science Glossary

Term Lookup

Enter a term in the search box to find its definition.

Settings

Use the controls in the far right panel to increase or decrease the number of terms automatically displayed (or to completely turn that feature off).

Term Lookup

Settings


All IPCC definitions taken from Climate Change 2007: The Physical Science Basis. Working Group I Contribution to the Fourth Assessment Report of the Intergovernmental Panel on Climate Change, Annex I, Glossary, pp. 941-954. Cambridge University Press.

Home Arguments Software Resources Comments The Consensus Project Translations About Support

Twitter Facebook YouTube Mastodon MeWe

RSS Posts RSS Comments Email Subscribe


Climate's changed before
It's the sun
It's not bad
There is no consensus
It's cooling
Models are unreliable
Temp record is unreliable
Animals and plants can adapt
It hasn't warmed since 1998
Antarctica is gaining ice
View All Arguments...


Username
Password
New? Register here
Forgot your password?

Latest Posts

Archives

The significance of the CO2 lag

Posted on 18 May 2010 by John Cook

When we examine past climate change using ice cores, we observe that CO2 lags temperature. In other words, a change in temperature causes changes in atmospheric CO2. This is due to various processes such as warmer temperatures causing the oceans to release CO2. This has lead some to argue that the CO2 lag disproves the warming effect of CO2. However, this line of thinking doesn't take in the full body of evidence. We have many lines of empirical evidence that CO2 traps heat. Decades of lab experiments reveal how CO2 absorbs and scatters infrared radiation. Satellite measurements find CO2 trapping heat and surface measurements confirm more radiation at CO2 wavelengths returning to the Earth's surface. So the full body of evidence gives us these two facts: warming causes more CO2 and more CO2 causes warming. The significance should by now be obvious. The CO2 lag is evidence of a climate positive feedback.

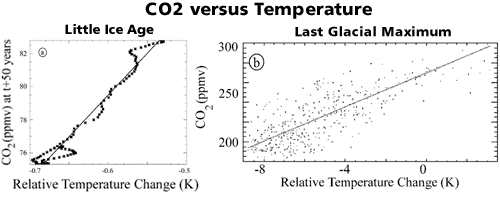
The magnitude of this positive feedback is calculated in Positive feedback between global warming and atmospheric CO2 concentration inferred from past climate change (Scheffer 2006). In this paper, they use reconstructions of past CO2 and temperature to empirically calculate the positive feedback between global warming and CO2. First, they look at pre-industrial CO2 variations during glacial cycles and the Little Ice Age. The relationship between CO2 and temperature is roughly linear.
CO2 vs Temperature: Little Ice Age and Last Glacial Maximum
Figure 1. Relationships between past atmospheric CO2 concentrations and reconstructed temperatures. (a) Reconstructed Northern Hemisphere temperatures of the period 1500-1600 plotted against CO2 levels 50 years later from the Law Dome record. (b) CO2 vs temperature for a 400.000 years period of glacial cycles reconstructed from the Vostok ice core.

Over these periods, changes in CO2 are assumed to be primarily driven by temperature. This is because mechanisms other than changing CO2 (such as changes in solar output) drove temperature over these periods. So looking at Figure 1, we can calculate the effect that temperature change has on CO2 levels. However, this is complicated by the fact that different carbon cycle processes operate on different time scales. On a time scale of years, warming has an effect of around 3 ppm of CO2 per degree Celsius. On a scale of centuries, the effect is much larger - around 20 ppm of CO2 per degree Celsius.

What we're interested in is the expected global warming by the end of the 21st century so century time-scales are the focus. The most important period for estimating sensitivity of CO2 to temperature on century time-scales is the Little Ice Age. Figure 1a shows how CO2 levels dropped (with a time lag of 50 years) in response to the drop in temperature in this period. From this is calculated a positive feedback of between 15 to 78% on a century-scale.

The benefit of this study is it provides an independent, empirical method of calculating the positive feedback from the CO2 lag. These results are consistent with what's been found in simulation studies. So when someone mentions to you that CO2 lags temperature, remind them they're actually invoking evidence for a positive feedback that further increases global warming by an extra 15 to 78%.

0 0

Printable Version  |  Link to this page

Comments

1  2  Next

Comments 1 to 50 out of 57:

  1. I don't have time to read the paper yet, but I do wonder: as I understand it, a lo of the feedback is mostly from the oceans. Henry's Law says that both temperature and partial pressure of CO2 control the rate of CO2 dissolving. We now have drastically increased partial pressure by a factor of larger than the temperature change: might this not stop the CO2 feedback? At most, we should just expect a declining percentage of dissolving CO2 and eventually an increasing airborne fraction.
    0 0
  2. "warming causes more CO2 and more CO2 causes warming" Taken to its logical conclusion, this statement implies a runaway effect... (assuming an unlimited supply of CO2).
    0 0
  3. no it doesn't RSVP let's take the value of a [CO2] response to warming of 15 ppm (equilibium rise in [CO2]) per oC. let's say that during the early Holcene (no human contribution to changes in atmospheric [CO2]) the Earth temperature was suddenly to rise by 1 oC. Atmospheric [CO2] would slowly rise from 270 ppm to 270 +15 = 285 ppm. We can esily calculate the consequent temperature response. Let's assume a climate sensitivity of 3 oC (of Earth surface warming at equilibrium per doubling of [CO2]). The temperature rise is close to 0.23 oC. This will induce a recruitment of more [CO2] (the CO2 response to enhanced temperature). This is 15 ppm x 0.23 = 3.6 ppm. The temperature response from this enhanced [CO2] (285 + 3.6 ppm = 288.6 ppm) is around 0.05 oC. This will recruit an extra 15 ppm x 0.05 = 0.75 ppm of [CO2]... ...and so on. In other words the two feedacks: [CO2] feedback (15 + 3.6 + 0.75 + .....) ppm temperature feedback (0.23 + 0.05 + ...) oC converge to new equilibrium values. i.e. no "runway effect"
    0 0
  4. does not anyone find this a bit scary ??
    0 0
  5. RSVP writes: "warming causes more CO2 and more CO2 causes warming" Taken to its logical conclusion, this statement implies a runaway effect... (assuming an unlimited supply of CO2). Nope, that's wrong. In addition to Chris's explanation, see this other thread here and the graphs here. A given forcing (of either CO2 or warming) will produce more CO2 and more warming, because of the positive feedbacks. But unless the forcing keeps increasing, both CO2 and temperature will converge on some new, higher value, with no runaway effect (unless you add enough heat or CO2 to cause a regime shift a la Venus).
    0 0
  6. This paper should also be included in this discussion. Like Scheffer et al, Frank et al (2010) analyse pre-industrial Holocone temperature/CO2 relationships to extract a range of likely [CO2] feedback response to temperature change. They consider high values to be rather unlikely. So probably not quite so scary as the numbers in the top article might imply tadzio! That's not to say that there won't be nasty surprises ahead, since these analyses are for relatively non-perturbed natural environments, and unexpected responses to rapid temperature increases might push us into new regimes where theses analyses don't apply (e.g. heat-stressed rain forest die-back and the accompanying loss of carbon sequestration)..... Also it would be good if we would stop cutting down rainforest....
    0 0
  7. "However, this is complicated by the fact that different carbon cycle processes operate on different time scales." ... and it is very important: the essence - the heart of the matter. There is a huge range of uncertainty as "... Carbon Cycle Processes Operate On Different time scales ..." react (respond) to the temperature rise. For example, land. 11 the computer models, gave for 2,100 years (as projected in different p.CO2 for 2100 - 730 - 1020 ppm) results differ by up to circa 20 GtC/yr ! (Fig 1. (e), (f) - Climate–Carbon Cycle Feedback Analysis: Results from the C4MIP Model Intercomparison, Friedlingstein P. et al., 2006). # 2. MarkR It would be worth on this issue, once again to discuss (on this website) Segalstad's these words: "The IPCC postulates an atmospheric doubling of CO2, meaning that the oceans would need to receive 50 times more CO2 to obtain chemical equilibrium ..." According to me about the amount of CO2 in the atmosphere does not decide the ocean. That soil. I am currently working hypothesis - the scheme: the beginning of warming = increase soil respiration = increase of CO2 in the atmosphere. Remember that, with the highest content of soil humus, there are a temperate climate - warmer version (ie 4% of northern Ukraine, southern 7% humus in the soil). There synthesizing microbes humic acids dominate. The proposal - in the long term warming stimulates the synthesis of humus. Warming (especially tundra) = first increases respiration (p.CO2 increase in the atmosphere), then the succession of microbial groups, biocoenoses synthesize humus (final result: taiga) = increase in humus content = decrease of CO2 in the atmosphere. Delay (tens of years), is due to the fact that there is no simultaneous microbial succession of the whole team. Different species move at different speeds with the progressive warming. I recommend a very interesting publication: Temperature-associated increases in the global soil respiration record. Bond-Lamberty B, Thomson A, Nature. 2010.
    0 0
  8. Okay I almost fully understand the principles of CO2 temperature lag but there is still another aspect which suddenly doesn't seem to fit, unless it is an effect that occurs during the time lag period which still doesn't seem to fit. I am referring to Ocean acidification which is (stating the obvious I know) the absorption of CO2. Now you say that the oceans releases CO2 as the temperature rises(first paragraph). So where does CO2 get absorbed into the oceans in this great cycle of events to bring about all this acidification that the oceanographers are screaming about? Are they simply getting jealous about the atmospheric scientists getting all the publicity? :-0) Only joking honest! I know acidification does destroy coral reefs but there seems to be a contradiction here. Has anyone done any research as to this aspect other than to say 'oceans get more acidic and this leads to the destruction of corals etc'? It happens to be a very pertinent point which if a mere amateur like me can spot it then I am sure the idiots who insist its all a scam will no doubt have spotted it too and be busy refuting climate science as another excuse to increase taxes (well here in the UK at least). So can you point me in the direction of some very simple research that will allow me to get my head around that sequence of events so that I can then set the record straight if anyone starts arguing the point. Specifically how CO2 gets absorbed by the oceans, yet is released by the oceans when the temperature increases. Yet there is a temperature lag from increased CO2 in the atmosphere, but the oceans are getting more acidic as atmospheric CO2 increases. But the increased atmospheric CO2 increases atmospheric temperature which increases ocean emissions of CO2. Which surely must reducer oceanic CO2 concentrations which must in turn reduce the acidification unless there is something that I have missed which says that CO2 is absorbed by the oceans from some other third party source. But which source would that be or by which mechanism does this occur? Its one of those silly niggling points that will bug me all day now.:-0) Any help with that would be very gratefully appreciated.
    0 0
  9. John, Thanks for reminding everyone that CO served as a feedback in past climate change and therefore MUST follow the initial climate forcing (e.g., the warming at the end of an ice age). However, temperature is not the main factor causing CO2 to change. The temperature dependence of CO2 solubility in seawater is well known. On glacial time scales the combined effects of changes in the temperature and salinity of seawater could have accounted for only about a fifth of the observed changes in atmospheric CO2 (e.g., W.S. Broecker, Glacial to interglacial changes in ocean chemistry, Progress in Oceanography 2(1982) 151-197). Over the time period covered by the ice core CO2 record the primary factors regulating atmospheric CO2 involved changes in ocean and atmospheric circulation that determine the amount of CO2 stored in the deep ocean, as shown by a number of recent studies. See for example: Anderson et al., Science 323(2009) 1443-1448, and the related Perspective by Toggweiler (same issue, p. 1434). Skinner et al., to appear in Science next week, and the related perspective. George Denton and coworkers have a review (in press) in Science that documents the complete sequence of conditions and events at the end of the last ice age, including the ocean and atmospheric processes that caused CO2 to rise. They emphasize and the importance of CO2 as a feedback to complete the termination of the last ice age. The science is certainly not settled on this issue, and competing hypotheses warrant further examination. But it’s an exciting time to see so many new insights concerning the links between past climate change and CO2.
    0 0
  10. So what does this mean in our present time frame? In the current decade- 2010-2020? Would we see a global rise of around .3 degree F? Most climate models see this decade warming as much as the period of 1970-2010.
    0 0
  11. During previous interglacial periods, natural warming (initially caused by Milankovitch Cycles) cause the oceans to release CO2 into the atmosphere. Milankovitch Cycles are base upon sine-waves but feedback processes (from CO2, water vapor, albedo, etc) change the sine-waves into a resultant saw-tooth wave. See the second graphic on this page: www.southwestclimatechange.org/climate/global/past-present The problem with the current interglacial (which started 11,700 years ago) is that industrial humans have precharged the atmosphere with industrial CO2. As the oceans continue to warm, dissolved CO2 will fizz out then add to the CO2 we have already released. Humanity will be hit with a double whammy. Scientists "have speculated" that our oceans hold 50 CO2 molecules for every CO2 molecule in the atmosphere. Let's hope the warming oceans are able to retain some of it.
    0 0
  12. Mythago: The answer to your question is that in the past the temperature was forced (changed) by some other cause (like solar variation). CO2 was released by the ocean as temperatures increased. In the current situation, CO2 is being released by humans. This CO2 causes (forces)the temperature to rise. The ocean absorbs CO2 from the atmosphere now, changing ocean pH (and decreasing temperature rise). It is not yet known how long the oceans will continue to absorb CO2, or how much will be absorbed. Because the change in temperature is caused by a different forcing, the CO2 response (release, absorbtion) in the ocean is different. The CO2 lead/lag is also caused by the difference in the forcing.
    0 0
  13. Mythago, the details of this are very complicated, but the big picture isn't too bad. There is an equilibrium between CO2 in the atmosphere and CO2 in the ocean that shifts as a function of temperature. If you kept the total CO2 in the system constant but heated the ocean, CO2 would move from the ocean to the atmosphere (if you cooled the ocean, the opposite would happen). But we're not keeping CO2 constant, we're adding CO2 to the atmosphere at a rapid rate. This pushes it higher than the equilibrium value, so some of it gets taken up by the ocean (see below for references). But as it gets warmer, less gets taken up by the ocean than would happen if it were cooler. So, when CO2 was only a feedback rather than a forcing, the ocean would behave as described in the first paragraph of the article at the top of this thread (giving off CO2 when the ocean warmed). But now that CO2 is both a feedback and forcing, the ocean is "forced" to take up some CO2 even though it's warming, because there's so much going directly into the atmosphere. The other complicating factor here is the slow mixing time of the deep ocean. Originally (pre-1970s) most people weren't concerned about AGW because it was assumed that the deep oceans would take up more CO2 than we could ever emit. But from the 1950s to the 1970s evidence began to accumulate that this was incorrect. Because the surface layer takes a long time to mix with the deep ocean, the surface layer becomes saturated with CO2 much more rapidly, and its uptake is limited. Both of these factors mean that if you add a lot of CO2 to the atmosphere, the following chain of events will occur: (1) CO2 very rapidly increases in the atmosphere. (2) CO2 rapidly increases in the surface ocean, leading to a decrease in pH. (3) Because of (1), the atmosphere and surface ocean warm. (4) Because of (3), the surface ocean takes up less CO2, leading to a further increase in (1). (5) On long time scales (centuries to millennia) the CO2, warming, and low pH signal all propagate slowly into the deep ocean. Once you stop adding CO2 to the atmosphere, the following occur: (6) The atmosphere and surface ocean fairly rapidly come into equilibrium. (7) CO2 and temperature of the atmosphere and surface ocean very slowly decrease, and pH correspondingly slowly begins to return to normal. (8) The long memory of the deep ocean spreads out the process of returning to normal conditions over a timescale of millennia. A couple of useful papers (taken from our list here): Climatological mean and decadal change in surface ocean pCO2, and net sea–air CO2 flux over the global oceans (Takahashi et al. 2009) The Oceanic Sink for Anthropogenic CO2 (Sabine et al. 2004) I hope this helps. It is indeed a very confusing subject. When I was in grad school in the 1990s we had a lecture & lab exercise on ocean/atmosphere CO2 exchange and the oceanic carbon cycle, and we had to reprise them twice over because the professor (former director of a world-class climate science research institute) kept discovering essential details that he'd left out of the previous, simpler version. All of us students had nightmares about that part of the course!
    0 0
  14. The real problem with this argument is that it is simply illogical. Just because CO2 lags temperature does not prima fascia rule out the possibility that CO2 can also cause temperature to increase. That's the beauty of global warming skeptics - of all the skeptic arguments, all of them except for one are not just scientifically wrong: they are simply logical fallacies.
    0 0
  15. WAG: What's the one exception?
    0 0
  16. Full citation is Scheffer et al., Geophys. Res. Lett.,33,L10702,doi:10.1029/2005GL025044,2006 online here
    0 0
  17. The data in 1b do not look linearly related to me.
    0 0
  18. Although the present discussion rehashes concepts that have been explained many times before, scientists must never tire of the need to repeat them as often as necessary. Kudos to SkepticalScience.com for having taken up the gauntlet once again. The argument that the rise in temperature preceding the rise in CO2 (in the Pleistocene ice record) disproves AGW remains one of the most beloved and commonly-encountered arguments in AGW Denialism. The enduring appeal of this argument is partly related to its simplicity. After all, the correlation is so obvious, even a 'caveman' could see it: First temperature increases, then CO2. The other major appeal (to some) is that it (superficially) appears to 'debunk' AGW (so long as one doesn't look too carefully). Yet, in one of the many "ironies" that characterizes AGW Denialism, many wannabe skeptics cannot resist the temptation of piggybacking onto this another favorite Denialist argument: that "correlation does not imply causation". This scientific axiom is often conveyed with a sanctimonious withering (virtual) sneer, as if real scientists failed to grasp this concept, or as if the entire theory of AGW rested on this correlation. Check it out yourself: A Google search on: "correlation does not imply causation" + temperature increase leads CO2 yields ~4,500 'hits', most of them being denialist (i.e. pseudo-skeptical) in nature. Wouldn't it be nice if Denialists understood their own advice enough to actually adhere to it? After all, if a simple correlation between temperature and CO2, documented throughout the geologic record, does not in and of itself prove causation, then why should the ~800 year lag in the Pleistocene ice record necessarily disprove it? The 'bottom line' is that a valid understanding of the interrelationship between temperature and CO2 requires a more complex understanding of the processes affecting the system, although once these processes are understood, a primary forcing on temperature by CO2 emerges. Our current understanding of what happens to atmospheric CO2 remains incomplete even in regards to contemporary proesses, and we have a great deal more to learn regarding the geochemical cyclicity of CO2 in the atmosphere, hydrosphere, and lithosphere on a geologic time scale, but while we're still studying and learning, it is important to interpret the presently available data without bias or agenda. If AGW is wrong, it's not because of the ~800 year "lag". So, true skeptics: Keep looking for legitimate weaknesses in AGW. It's your right and duty; And denialists, could we please move on? This argument is getting a bit threadbare.
    0 0
  19. Co2 lags and leads. 1. Increased solar activity leads to T increase. 2. Oceans warm up slowly 3. Once oceans have warmed up (the 800 year lag story), they cannot hold the CO2, which is emitted. 4. The emitted CO2 causes a positive feedback. At this point, CO2 leads. That's what the 'skeptics' generously ignore. 5. In the case of the Vostok ice core, deglaciation owing to CO2 followed initial CO2 release from oceans warmed by solar activity. monckhausen http://friendsofginandtonic.org/
    0 0
  20. It seems to me that the paper by Scheffer does not apply the "lag" argument, instead it uses a very subtle approach, depending on several quite difficult estimates. Stating the upper limit as "78%" sounds a little ridiculous taking the great uncertainties into account. Is it possible to use the lag of CO2 levels after temperature to make an independent estimate on the feedback effect?
    0 0
  21. Addendum: Human-emitted CO2, in contrast to the ocean-emitted CO2, does not lag, it is emitted instantaneously. Following the logic applied by 'skeptics' like Joanne Nova, something 800 years ago must have triggered our present human CO2 emissions. This, of course, does not make any sense. However, since oceans and humans can emit CO2 simultaneously, CO2 can lag and lead at the same time, depending on its source. monckhausen http://friendsofginandtonic.org/
    0 0
  22. It is always amazing to me how many otherwise intelligent people can't seem to grasp that in a positive feedback loop, order is irrelevant. A causing B causing A, etc is the same as B causing A causing B, etc. Also, few seem to understand that not all positive feedbacks are "runaway". As Chris noted above, any positive feedback loop from A to B and back to A that generates between 0 and 1 new A's for each one at the beginning of the loop will converge to some finite value. Only if one or more A is created during each loop will the the system diverge and "run away". If less than zero A's are "created", it is a negative feedback. CO2 appears to be a convergent amplifier to climate change under the ranges earth typically experiences.
    0 0
  23. "The benefit of this study is it provides an independent, empirical method of calculating the positive feedback from the CO2 lag. These results are consistent with what's been found in simulation studies". Yes, but don't the simulations ignore other possible natural warming factors which are also time-lagged, irrespective of the concomittant increase in C02?. My question is, how does one know that the several hundred year time lag in T after glacials is not caused by other natural factors, such as eg: slow re- distribution of heat from the deep oceans, time lag effects from slow ice break-ups which alter ocean currents, century scale changes in vegetation, century scale changes in high latitude albedo once ice sheets break up, global cloud cover changes once temperatures reach a tipping point, etc etc, and not just from c02 slowly being released from the oceans?
    0 0
  24. One other point, there is a study somewhere, published in a peer reviewed journal, I believe, of the relative amount of cloud cover in Little Ice Paintings (particularly Dutch) compared to before and after, which appears to indicate that cloud cover was greater in Europe during the Little Ice Age. Does the Scheffer 2006 paper incorporate possible changes in cloud cover during/after the Little Ice Age? I'm guessing it doesn't. Temperatures slowly warm by increase in solar output, clouds gradually dissipate, c02 lag naturally follows the reduction in cloud cover as the oceans also gradually warm and release their c02, which therefore correlates with, but which has little effect on, rising T. ??? Correlation is not causation. I don't think the "Cloud Cover is greater in Little Ice Age Dutch Paintings" is on the skeptic argument list yet.
    0 0
  25. Thingadonta it would be highly useful if you were to beaver through some of the relevant literature and discover whether the factors you mention are indeed actually missing from simulations. Tying your two posts together, I'm personally more willing to attach weight to modern simulations than works of Dutch masters, though I've always been partial to their work.
    0 0
  26. VoxRat (#15): The one exception is Lindzen's conjecture that water vapor will produce negative, not positive feedbacks. I'm not saying Lindzen is right--my understanding is that his "iris effect" has been debunked--but only that it is not illogical. Lindzen agrees with his colleagues that doubling CO2 will lead to about a 1 degree C increase in temperature, leaving water vapor feedback as the key variable. He's at least proposing a scientific mechanism, however dubious, for why doubling CO2 might not lead to the temperatures predicted by other models. I am not a scientist though. To any who are, does this sound roughly correct?
    0 0
  27. I'm glad you keep returning to this topic John, and I hope you continue to do. (Not least because I usually seem to arrive late when the insults have already been hurled and everyone seems to be packing up and going home). I also think it's helpful to remind our selves what we may be arguing about, and that we may arrive at rather different conclusions from reading the same paper. Reading the Scheffer paper, I found it to be a worthy and cautious academic paper which presents an alternative (not better) method of modeling, primarily, the effect of temperature on atmospheric CO2 concentrations (this being the more problematic side of the issue). They highlight, and seem well aware of, complexities, and seem quite honest and open about assumptions and possible sources of error. In fact, most of the discussion appeared to be acknowledging these matters. Now, what I did not find is this: I did not find a masterful tour-de-force of non-linear mathematics modeling systems with multiple feedbacks. I expect the authors didn't think so either. That was why I was so pleased to find the "Science of Doom" site that you directed people to earlier this week. It seems a great educational site, and I was fascinated by the "Strange Case of Stratospheric Water Vapour, Non-lineaities and Groceries". Fascinated, but not surprised at learning about one more variable to throw into the pot. I too would urge peole to go and read on this site. Am I expecting too much from the Scheffer paper? I don't think so, because as some one else has already commented elsewhere on this site, if this science is being used to justify proposed changes to our economic and technical way of life (not to mention taxes!), then it's gonna have to be exceptionally good. A model using "the mid-range IPCC estimation of the greenhouse gas effect on temperature [to] suggest that the feedback of global temperature on atmospheric CO2 will promote warming by an extra 15-78% on a century-scale" just doesn't do it for me. Sorry. As far as other details of the Scheffer paper goes, it doesn't really seem to say much about lag phases (not to me, anyway). Enzyme kineticists commonly observe lag-phases with simpler sytems that don't have the feedback mechanism of CO2-based warming. A lag-phase doesn't necessarily rule-in or -out the meat of the argument which is the quantitative aspect. The existence of a lag-phase certainly merits a qualitative explanation of the deviation from a simple rate-equation, and I think it is always important to keep in mind what assumptions underly a model. Assumptions that are forgotten can come back and bite you if a model is applyed to cricumstances where they no longer hold. Thank you to Ned (post#13), interesting abstracts though I doubt I shall find time to read the whole papers.
    0 0
  28. We should not abandon our sense of humour either, which is why I post this bit separately. Did anybody else start sniggering at the back when they read: "A review of biospheric feedbacks on temperature suggests that the effect may be small on a time-scale of years (about 3 ppmv CO2 /0C), and moderate at millennium time-scales (about 13 ppmv CO2 /0C), but large at a scale of centuries (about 20 ppmv CO2 /0C)" ? -So it's the middle bit that's the problem (which can be another way of saying that you can get any result you want from a model by selecting the starting and end points of your observations). This suggests two approaches to reducing problems associated with “global warming”: Either a) Wait a few hundred years until the “long term” sets in, and any problem will auto-correct, or b) Start taking measurements later on (or, better still, not at all) because then you will never progress from the short-term to the medium-term, which seems to be where the main problem lies. In either case the solution is to simply ignore the problem or don't try and measure it at all. Now that's what I call kinetics! Discuss.
    0 0
  29. Interesting article! Now we know, that the positive feedback is 15 to 78% on a century scale. But does this mean that we should expect an additional warming in the next century? No, because the positive feedback – if it exists – is already included in the observed warming of the last century. From 1910 to 2009 the global temperature rose 0.71 degrees while the CO2-concentration rose 87.7 ppm (from 299.7 to 387.4 ppm). If the positive feedback is 15-78%, we can calculate that 0.40 to 0.62 degrees of the observed warming were due to direct heat trapping and 0.09 to 0.31 degrees due to the positive feedback. A simple extrapolation to the next century: in 2110 the CO2-concentration could be 560 ppmv. We can expect a total warming of 0.71 x (560-387.4)/87.7 = 1.4 degrees. Of this warming 0.8 to 1.2 degrees will be due to direct heat trapping (supposing that this effect is not yet saturated) and 0.2 to 0.6 degrees to positive feedback. Not much to be worried about, I think.
    0 0
  30. "it would be highly useful if you were to beaver through some of the relevant literature and discover whether the factors you mention are indeed actually missing from simulations. " Granted, but the few papers that I have perused do not investigate/discuss possible/modelled cloud cover changes and their effects on T. Cloud cover is also one of Roy Spencer's pet skeptical arguments against strong AGW, I think. There is no discussion in Sheffer 2006 of other various factors in their LIA c02 feedback calculations, a fact they readily acknowledge. They only mention that the various models/simulations are consistent with each other. But they are obviously not incorporating some modern cloud cover trends and their known effects on T. For example, the point on cloud cover and its effect on average T has been used to criticise some claims made about Australia's more recent warming trends. Australia's SE current/recent extended drought means that average annual temperatures are going to be superficially enhanced because cloud cover is obviously reduced during drought periods, and temperatures will therefore average out higher (eg annually), even if there is no 'background' warming. Furthermore, any changes in prevailing wind regimes, at low or high levels, will also change average T, regardless of 'overall' warming. Changes in wind regimes could also enhance night time average temperatures as well, if the wind changes during drought periods are towards a more northerly direction for eg Australia (eg from the Indian ocean-inferred for SW WA extended lower rainfall totals since the 1970s). The same goes for before/after the LIA. Not only can cloud cover changes affect T, but changes in European wind regimes could also affect T. (The recent European winter was bad partly because of the prevailing winds. Changing European wind regimes were even mentioned by some ancient historians about the time the Roman Empire collapsed, I think, but I will have to look that one up). I'm guessing these sort of effects are not 'covered' in any of the paper simulations, whether past Ice Ages, or recent LIA.
    0 0
  31. Thingadonta, Your "guessing" based on "the few papers I have perused" does not sound to me like a serious review of the relevant literature. The effects you mention are normally included in models of the climate. If they were not included the models would not be state of the art and publishable. The papers do not give a laundry list of everything in their model, it would take too much space. If you want to participate in an integellent discussion you need to inform yourself of what is already known. It is not the responsibility of those you are debating to find all this information and "proove" it to you. Why do you think these effects were not included in this paper? The only reason I see offered is that it allows you to discount the findings. You need to offer evidence to support your claim that these effects were left out, a "guess" is not evidence.
    0 0
  32. Notes about "not ocean": 1st Ocean - a direct exchange of gas (CO2) is really small - as indeed gives literature cited here. 2nd ... and soil: "We estimate that the global RS in 2008 (that is, the flux integrated over the Earth’s land surface over 2008) was 98 ± 12 Pg C", "The scientists [B. Bond-Lamberty and A. Thomson, JGCRI/Pacific Northwest National Laboratory] also calculated the total amount of carbon dioxide flowing from soils, which is about 10-15 percent higher than previous measurements. [80.4 (range 79.3-81.8) Pg C - CDIAC]". 3rd Currently, all the time, the ocean absorbs more CO2, than emits. 4th So now as in the past high concentration of CO2 in the atmosphere was strongly correlated with the delta 13C (then always increase the amount of carbon isotope of light, ratios to heavy isotope of carbon). 5th During El Nino is strong growth in CO2 emissions (from carbon-light). Airs on maps (eg http://www.nasa.gov/images/content/403382main_portalBigPollution.jpg) often observed a significant increase in the concentration of CO2 in some the areas of high NPP in the oceans. This is most likely the result of violent mortality of algae (and subsequent strong development of putrefactive bacteria) in the phase of El Nino, rather than reduce the solubility of CO2 in warmer water. The study of this compound (algae - bacteria putrefaction - El Nino - CO2) has been neglected in the science - now I could only quote the work of research showing the agreed methodology.
    0 0
  33. It should be noted that while increases in the CO2 concentrations measured in Antarctic cores lag observed increases in calculated temperatures obtained from isotope ratios from those same cores and from Southern ocean sediment cores, that same lag is not seen in mid-latitude core samples. In the March 14, 2003 issue of Science, page 1730, Caillon et. al. state the following: "We follow Petit et al. (1) in assuming that CH4 can be used as a time marker of the glacial- interglacial warming in the Northern Hemisphere. The CH4 increase at 2810 m, which occurred when _40Ar reached its first maxima, would thus signal a first warming in the North leading to some equivalent of the Bølling-Allerød interval. We point here to the existence of a cold reversal at the start of termination III (1), now firmly identified in both our detailed deuterium and _40Ar Vostok profiles. The sudden increase of 150 ppbv practically coeval with the _40Ar maximum would be linked to the main deglaciation, thus indicating that Vostok temperature began warming _6000 years (Fig. 3) before the associated warming in the Northern Hemisphere (1)" (Their reference 1 is 1. J. R. Petit et al., Nature 399, 429 (1999).) In other words, while changes in the Earth's orbit relative to the Sun may have been the driving force for the warming of the Southern Ocean and Antarctica, the elevated CO2 concentrations from the outgassing of the Southern Ocean was likely a major, if not the major, driver in the warming and deglaceration of the Northern Hemisphere.
    0 0
  34. @ fydijkstra #29 Your analysis is not correct on several levels. Some clarification. First, it makes no sense to subtract out the effect of feedbacks from the direct effects of CO2 on climate. Just because they are indirect effects doesn't mean they won't respond add to the direct effects of increasing CO2. You're basically assuming the feedbacks that amplify the effects of CO2 on climate will magically cease to apply to the next century. Second, the feedbacks you are talking about are not the ones discussed in this paper. There are fast feedback mechanisms -- like water vapor, clouds, lapse rate -- that are involved in the response of our current climate to CO2. These sorts of feedbacks are included in typical climate sensitivity estimates based on modern models and empirical measurements. The paper here is addressing SLOW feedback mechanisms. These are not included in typical climate sensitivity measurements because they take a long time (often a century or more) to be manifest. They often include complex processes that are hard to predict. One example includes the feedback of temperature on albedo through ice sheets, sea ice extent and sea level. The topic of this paper -- changes to the carbon cycle in response to temperature -- reflect changes in the processes that store C in the oceans and land and take centuries to adjust to new temperature regimes. Time scales are governed by lifetimes of soil carbon, vegetational shifts and lags in ocean temp and deep water circulation. Given the complexity and the slow development of these feedbacks, it makes sense to look back in time to see how the system as a whole responded, so as to calibrate our expectations for the future. Because these feedbacks have not had time to manifest, they add to the sensitivity we estimate based on the direct effects of CO2 and the fast feedbacks. Moreover, because they are slower and have not been manifested yet, they actually mean the climate is more sensitive to CO2 that we think based on the fast feedback mechanisms we can observe over short time scales and in the models.
    0 0
  35. @ Frogstar "A review of biospheric feedbacks on temperature suggests that the effect may be small on a time-scale of years (about 3 ppmv CO2 /0C), and moderate at millennium time-scales (about 13 ppmv CO2 /0C), but large at a scale of centuries (about 20 ppmv CO2 /0C)" ? This sequence of scales refers to effects of soil microbial and plant physiological responses to temp (short term: years to decades), changes in soil and terrestrial plant carbon inventories (medium term: centuries), and deep ocean turnover, glacial loss and (perhaps) vegetation expansion (long term: centuries-millenia). Different mechanisms working on different time scales may have opposite effects on the relationship between temp and CO2. Unfortunately, most of the ones working in the short-medium scales seem to exacerbate the problems facing us. Of course, I'm mostly interested in getting through the next couple centuries...unless Monckton has a cure for old age as well as AIDs, that is.
    0 0
  36. A couple of points to keep in mind here: CO2's feedback effect is very small, compared, say to the hypothetical water vapor feedback. A degree C increase leads to a release of ~10ppmv of CO2, which by the logarithmic relationship of CO2 and temperature increases the temperature by ~.1 times the sensitivity. Ultimately, this means that we can't use the CO2 time lag to diagnose sensitivity in *either* direction(as either positive or negative). Secondly, it is pretty hard to take the 20ppmv/deg C number seriously, when just by eyeballing the graph of CO2 and temps, we see that there the actual relationship is more like 10ppmv/deg. C. If, in fact, the 20ppmv number were the correct one, we would be forced to conclude that the correct pre-industrial value should be approximately 340ppmv CO2(ie the depths of the ice age had temps 8C lower at a CO2 concentration of ~180ppmv if each degree of warming released 20 parts of CO2, the 1600s should've had an atmospheric CO2 level of ~340ppmv. Cheers, :)
    0 0
  37. fydijkstra (#29) Your first paragraph: Good point, I think. I think it helps illustrate some of the problems with feedback-effects in what I would loosely call "self-referencing systems" By way of a verbal analogy (and with no political point), this reminds me of "strong market" Economists who can be very fond of heavy-duty mathematics without emphasizing some of the pitfalls. Strong- (or "efficient")-market theories hold that the movements of markets are forward-looking, efficiently and rapidly incorporating all important information as it becomes available. So (in the absence of earthquakes etc) stock-market prices today already efficiently anticipate the future, which is why individuals can't "beat the market". And there are some good reasons to believe this, not least because central bankers effectively tell banks what the next interest-rate movement will be, (even though they won't tell the rest of us.) But as soon as you ask the question "So do efficient-markets anticipate the actions of the market itself ?" then it rapidly appears that you may have stumbled on a paradox, and that "The Emperor has no Clothes".
    0 0
  38. Many thanks to 'Ned' and Michael Sweet for answering my question about the CO2 relationship between the atmosphere and the ocean. I now understand. Simple answer that I should have known was 'equilibrium' or 'establishing a balance' between the ocean and the atmosphere, (to put it another way). Thanks gents for the assistance. Very useful explanation and one I can understand easily.
    0 0
  39. @Ogemaniac at 10:47 AM on 19 May, 2010 "few seem to understand that not all positive feedbacks are "runaway". " True if the control system use a discrete time sampling model. (Which climate models do but, as far as we know, mother nature doesnt.)
    0 0
  40. @chris, Ned, et al. RSVP claim is that "A causes more of B cause more of A is a runaway solution". This claim is valid. The straw man attack on RSVP claim is to claim RSVP stated "A causes B cause A", which he never did.
    0 0
  41. batsvenson, if common sense doesn't help, if chris's numerical example above doesn't help either, try the math yourself or see here.
    0 0
  42. While CO2 levels may lag temperatures in the Vostok ice core samples, this only indicates the state of the climate in the extreme Southern Hemisphere. Lea's paper in 2003 [1]compares the Vostok CO2 data against proxy data for the Pacific SST. His conclusion - "The strong correspondence of a proxy SST record from the eastern equatorial Pacific and the Vostok CO2 record suggests that varying atmospheric carbon dioxide is the dominant control on tropical climate on orbital time scales. This effect is especially pronounced at the 100 000-yr cycle." This tends to support Caillon's hypothesis (post 33) that the changes in the Earth's orbit relative to the sun initially caused the greatest warming in Antarctica with little to no warming in the tropics and Northern Hemisphere. The warming of Southern Ocean caused the release of CO2 which accelerated the warming of the Southern Ocean and started the warming of the tropics and Northern Hemisphere.
    0 0
  43. RSVP, positive feedback <1.0 of the forcing will NOT be runaway. For each forcing, a feedback of 0discretely or continuously calculated, each effect will be smaller, each feedback will be smaller, and the total effect damps out to a total of 1/(1-x), as chris put it very well.
    0 0
  44. KR at 07:03 AM on 28 May, 2010,"positive feedback <1.0 of the forcing will NOT be runaway" Perhaps one reason being is that it is negative feedback, but then perhaps that can also runaway.
    0 0
  45. johnd > "Perhaps one reason being is that it is negative feedback" This shouldn't need to be said, but a positive feedback < 1.0 is not negative. A negative feedback would be a factor < 0.0 of the forcing.
    0 0
  46. e at 08:31 AM on 28 May, 2010, perhaps you can show a simple equation to demonstrate. Using the example by Chris above, an initial forcing of 1oC results in a additional temperature rise of 0.23oC giving a total rise of 1.23oC. That is positive feedback. If the temperature only responded to the initial 1oC forcing and the total rise including feedbacks remained at 1oC, that is neutral feedback. If the initial forcing is 1oC and the total rise is less than 1oC, that would be negative feedback.
    0 0
  47. johnd, you're confusing net temperature gain with the feedback factor (aka ratio or percentage). In your example, the feedback factor is: 1-(1/1.23)= 0.187, which is a positive number < 1.0. That's what KR was referring to. If the feedback factor is positive but < 1.0, then each successive feedback is smaller than the previous by a constant factor. This geometric series converges to a finite number, hence the warming is not runaway. If the feedback factor is >= 1.0, then yes, you would have a runaway warming.
    0 0
  48. johnd - the important issue is the sum of all feedbacks. (Yes, I'm opening a Pandora's box here, but...) If the sum of all feedbacks (positive and negative) sums to -1 < x < 0, then you have a reduction or a reduction with damping oscillation after a forcing (depends on time constants). If the sum of all forcings is 0 < x < 1, then you have an amplification. Both sum to 1/(1-x) if I recall correctly, where the sum is rather smaller if x < 0. Feedbacks of the form x < -1 are run-away oscillators - each swing larger. These are sometimes used as frequency generators in electronics, limited by input voltages/energy. Feedbacks x > 1 are run-away growth until some other limit (non-linear limit on available energy?) kicks in. Neither tend to exist in nature. At least, not for long...
    0 0
  49. Ah - a clarification. 0 < x < 1 is a stable positive feedback. -1 < x < 0 is a stable negative feedback. x = 0 is no feedback at all.
    0 0
  50. e at 09:57 AM on 28 May, 2010. e, can you clarify something for me as my understanding of the formula to determine the feedback factor is apparently different to yours. It may be just another case of confused terminology. My understanding of the feedback factor is derived from the formula: DTfinal = DTforcing + DTfeedback where DTfinal is the overall change in temperature between the initial and final equilibrium states, DTfeedback is the temperature change resulting from feedback, and DTforcing is the initial change in temperature due to radiative forcing. That equation can also be written as: DTfinal = fDTforcing where f is the feedback factor, thus f=DTfinal/DTforcing. see http://www.global-climate-change.org.uk/2-8.php The formula you have used appears to be: feedback factor = 1-(1/DT forcing + DT feedback). I think. Can you clarify if that is the correct interpretation and from what has the formula been derived. It is obvious that if the same values are plugged into each, the results are totally different, so perhaps there is some fundamental difference in what the term "feedback factor" actually defines in each case.
    0 0

1  2  Next

You need to be logged in to post a comment. Login via the left margin or if you're new, register here.


The Consensus Project Website

THE ESCALATOR

(free to republish)


© Copyright 2024 John Cook
Home | Translations | About Us | Privacy | Contact Us