


 Arguments


Air pollution and climate change could mean 50% more people going hungry by 2050, new study finds
Posted on 8 August 2014 by Guest Author
This is a re-post from Roz Pidcock at Carbon Brief
The combination of rising temperatures and air pollution could substantially damage crop growth in the next 40 years, according to a new paper. And if emissions stay as high as they are now, the number of people who don't get enough food could grow by half by the middle of the century.
Burning question
Feeding the world's rapidly growing population is a serious concern.
Research shows rising temperatures are likely to lead to lower crop yields. Other work suggests air pollution might reduce the amount of food produced worldwide. But nobody has considered both effects together, say the paper's authors.
The two effects are closely related as warmer temperatures increase the production of ozone in the atmosphere. Here's lead author Professor Amos Tai from the Chinese University of Honk Kong to explain.
The new study looks at global yields of the four principle food crops - wheat, rice, corn and soybean - and how they're expected to change by 2050 under different levels of future emissions.
Together, these provide nearly 60 per cent of all the calories consumed by humans worldwide.
Global losses
The maps below show some of the results.
The top panel is an optimistic scenario in which greenhouse gases stabilise at 630 parts per million (ppm) by 2100. For reference, we're at about 400 ppm now.
The team compared this with what might happen if greenhouse gases continue to rise as rapidly as they are now. That's the bottom panel.
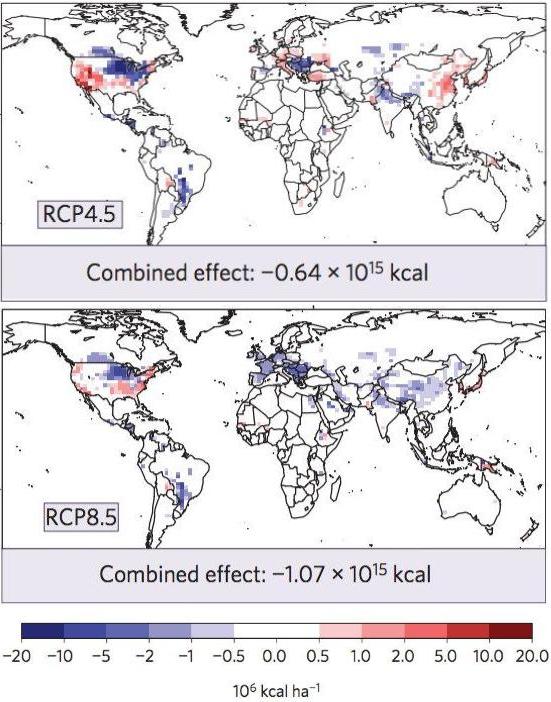
How global crop yields are expected to change between 2000 and 2050 for RCP4.5 (top) and RCP8.5 (bottom). Total annual crop losses for each scenario compared to today are in the purple boxes below. Source: Tai et al. ( 2014).
Global food production falls by 2050 in both scenarios, as shown in the purple boxes below each map. If emissions stay high, total global yield falls by about 15 percent compared to today. But if emissions are kept low, the drop is reduced to just over nine percent.
The coloured shading shows how the total yield for all four crops varies region to region. Red is a higher yield than now, blue is lower.
Food security
Does this mean more people won't get enough to eat?
If emissions continue as they are, the drop in crop yields will means many more people globally will be undernourished, as the graph below shows.
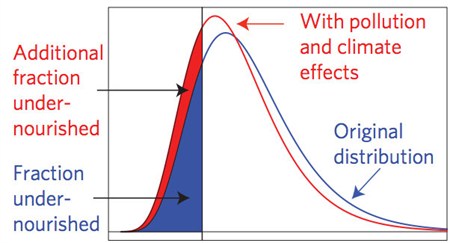
The blue shading is the fraction of people in developing countries who consume less than the minimum amount of energy required per day. At the moment it's about 18 per cent.
The red and blue shading together is the fraction of undernourished people by 2050 under the high emissions scenario. It's about 27 per cent - about 50 per cent more than now.
The projections include expectations of a 40 per cent rise in global population by 2050. But they don't take into account measures to increase resilience, such as changing farming practices.
Are we heading for global famine?
A headline in yesterday's Daily Mail suggested the new research meant "climate change and air pollution will lead to famine by 2050". But Tai tells us that's a "little bit of a stretch".
Famine is more complex than just food shortage, he explains:
"Famine is an extreme form of undernutrition with significant fatalities caused by not only crop failure but also a variety of socio-economic factors, which our study did not examine. The problem of undernourishment, in a more general sense, is usually more subtle but widespread and persistent".
Different crops, different pressures
The scientists found not all crops are affected in the same way. For example, corn is more susceptible to heat, while ozone exposure is more of a problem for wheat.
How badly different countries are affected will depend on how bad air pollution is already and which crops they grow, the paper explains. For policymakers trying to decide how to deal with the problem, different countries may need to try different approaches. Tai tells us:
"Depending on the crops of interest and where you are, you may want to focus more on air pollution reduction or climate adaptation more."
For example, tougher air quality regulations in the United States could lead to a sharp decline in ozone production, lessening the impact on crops.
"Talk to each other"
The authors are calling for greater collaboration between agricultural planners and air quality managers to set goals for food security and public health. Tai tells us:
"For policymakers and people in the field, including farmers, air pollution managers … they do have to talk to each other … We really call for greater collaboration between stakeholders of different interests and fields … they cannot just be concerned about their own fields because their objective is ultimately affected by decisions made in other sectors."
Scientists know cleaning up air quality will have a significant impact on public health. This new research suggests cutting domestic air pollution as well as curbing warming could have big benefits for food security in some parts of the world too.


this is why we are in a hurry and that means the risk of using a combo of nuclear power + renewables to get fossil fuels retired faster is far less than insisting on 100% renewables which causes fossil fuels to hang around longer
To elude that more people will go hungry if the climate warms is so ridiculous it's almost funny. Globally much more land would become viable farm land than would be lost. Not to mention CO2 is a plants best friend. Everyone should agree that using up all the fossil fuel this planet has is a dumb idea... however making up "consequences" is just going to hurt credibility.
[PS] Please see Dai et al and CO2 is plant food to come to a rather more informed position.
Donny,
This is a scientific board. The OP uses data to show that there is great risk that billions of people will be left undernurished by AGW. They only look out to 2050, after that it will be much worse. Your argument from ignorance has no standing. You must provide data to support your wild claims.
If fact, currently in the USA the cost of beef has gone up substantially due to AGW related drought in the midwest. California is losing billions of dollars from AGW related drought damaging agriculture. Where is the new farmland going to come from, under the glaciers in Greenland?
Although this may be regarded as heretical, Steve McIntyre at Climate Audit has given a reasoned critique plus the use of appropriate references to show globalyield of most major food crops has steadily increased. The number of under/mal-nourished dropped by 17% between 1990 and 1992 and dropped further from 995 million in 1992 to 827 million in 2013. He notes that there is a significant difference between the IPCC report and the Food and Agricultural Organisation (FAO)of the United Nations with the IPCC reporting an increase of 75 million and the FAO a decrease of 46 million in the global number of the undermourished. The data from the FAO suggest that global undernourishment may not be as severe as previously thought. The URL is www.climateaudit.org
[Rob P] The post is about falling future crops yields due to rising surface temperatures and air pollution. The issue here is not about past trends, but future ones.
I've read only the abstract of the Tai et al. study, plus the description here. Based on what I've seen, I suspect that Tai et al. may not have considered the effects of predicted drought. My suspicions on this point were aroused by the top map (for RCP 4.5), in which yield increases were predicted for western USA--precisely the region where the impacts of drought are predicted to be most severe.
Ashton @4, the IPCC wrote (Section 7.1):
I cannot find the FAO document referenced for 2008, but was able to find "The State of Food Security in the World 2008", which writes (2nd Key Message):
Therefore the 75 million increase cited for 2007 is an accurate report of FAO figures of the time.
The 2012 citation is to the "The State of Food Security in the World 2012", which states (key messages):
So, again the IPCC accurately cited FAO figures.
Why, then, the evident discrepancy between the IPCC figures and the "The State of Food Security in the World 2013" quoted by McIntyre and shown in Figure 1 of the report (as posted by McIntyre)?
The answer is largely given by showing the equivalent figure from 2012:
If you look at the green line, it is revised upward from a plateau around 900 million in the early twentieth century to show a peak at about 940 million in the later figures. At the same time, the end figures are revised downward. The downward trend McIntyre finds so obvious, therefore, is a result of revision of earlier figures - a revision that had not taken place in the documents to which the IPCC had access. Indeed, even if the IPCC got rid of its policy of looking only at documents available by a certain date (to prevent a process of continuous rewriting and reassessment preventing publication), the revised figures were not published until October 2013, by which time the IPCC report was essentially complete.
There you go, thirty minutes of research and writing time and we find the IPCC mad no errors, but that more recent FAO documents have revised the figures on which the IPCC relied. Too much trouble, apparently, for McIntyre who was content merely to wrongy tarnish the IPCC with shoddy research.
Michael I love the "scientific graph" under the"food security" heading. ... [snip]. Just your assumption alone that gw will cause drought even though it's predicted to also produce increased water vapor tells me all I need to know about your scientific background. How about you provide some evidence backing your wild claim.... and yes we know that Greenland supported crops not that long ago. .... hence the name.
[JH] Please note that posting comments here at SkS is a privilege, not a right. This privilege can be rescinded if the posting individual treats adherence to the Comments Policy as optional, rather than the mandatory condition of participating in this online forum.
Please take the time to review the policy and ensure future comments are in full compliance with it. Thanks for your understanding and compliance in this matter.
[RH] Inflammatory tone snipped.
Donny,
Your post hardly rates a response but I will give you one more post. I have a Masters Degree in Organic Chemistry. I teach chemistry at the College level (google Hillsborough Community College Chemistry). I noticed that you post no qualifications yourself. On Skeptical Science people are usually judged by the quality of their arguments and data, not their degrees. So far you have produced no data or links that support your wild claims. The OP supports my claims that food prices will change. It has been pointed out above that the OP did not consider drought (or sea level rise) in their analysis. This makes the decrease they predict a better than best case analysis.
It is well known that the Vikings raised only cattle, it was too cold to raise plant crops (potatoes and cabbage are now, for the first time, raised in Greenland). It was called "Greenland" as a sales tactic, some people are still fooled by this. Under the ice is only rock, as with most of the Arctic. Read Collapse by Jahred Diamond.
Increased food prices in the USA hardly need to be referenced but here is the first of many articles how AGW related drought has caused price increases in beef.
It has been predicted for decades that AGW will cause wet areas to get wetter and dry areas to become dryer. This includes a single location becoming dryer during the dry season and wetter in the wet season. The increased temperature will drive water cycle faster than in the past. Your claim that you are not aware of this indicates that you have not done your homework.
You have yet to provide any data or links that support your wild claims. Please remember that an unsupported claim can be dismissed with a hand wave.
Tom,
Thank you for looking up the data on McIntyre. It is typical for him to produce shoddy reports and claim others have made the mistakes. Will he audit his own report and rewrite it to reflect the actual data available at the time?
Ashton, perhaps you could copy this data to Climate Audit and tell us his reply.
Donny at 7--I shouldn't engage with a troll (should these be aloud on this site?) but really, your statement here is just stunningly...well, let's just call it simplistic. Every global warming model I know of (and just common sense, if you bother to think for more than a few seconds) predicts that some places (mostly those that are already rather wet) will get wetter, while other places (especially those that are already dry or in the interior of continenents) will get drier. Heat, after all, dries things out, and where predominant weather patterns don't bring ample rain, that drying will be intense. Of course, many places will (already are) swing between more and more intense drying spells, and every more severe downpours--both very bad for vegetation (and most every other form of life).
I'm not sure you should call me a troll because I disagree with your opinion. However the models have said a lot of things over the past 15 years.... a lot of which have been revised over the years because of inaccuracies. Yes heat can dry areas out.... but it will also produce a larger percentage of the globe to be covered in water thus increasing water vapor and cooling from evaporation. Why do you get mad that I would want to explore different opinions? I disagree with the hypothesis that dry spots will necessarily be dryer and wet wetter. I also think it is funny that the moderator tries to influence opinions. ... instead of just moderating discussion/debate. I am no expert but do have a degree in environmental biology with a interest in weather and climate. Wili... why would you want to censor someone with a different opinion?
Donny... The problem is that you're disagreeing without even knowing what you're talking about. You're presenting a "different opinion" that is not based on any science.
As the saying goes, you're entitled to your own opinion, but you're not entitled to your own facts.
If you can't find any research that supports your opinion then, well, that opinion isn't worth very much. My suggestion would be to do your research. If you can find something that supports your position, then present it. If you can't find anything, you should probably consider changing your position to conform to the available facts.
Donny said... "However the models have said a lot of things over the past 15 years.... a lot of which have been revised over the years because of inaccuracies."
I'm also going to formally make a request that you substantiate this statement before you make attempts to post anything else. Until you either substantiate or retract this statement I'm going to suggest the moderators delete any additional comments.
It's a very serious claim that you've made here and it needs to be rectified before moving forward.
michael sweet @9, I cannot accept the thanks, and must revise my condemnation of McIntyre who did look up the relevant data. I have expressed my apology to him at Climate Audit, and will do so again here. McIntyre in fact looked up both the 2008 and 2012 reports from the FAO, and discusses primarilly the change in estimates between them, due in part to a revised methodology in 2012. That change along with changes in estimates of population, population height and dietary energy supply reverse the trend in world hunger from 2002-2007 as previously reported in FAO reports. The turn around is a net change of 53 million between 2011 and 2012, with a further 22 million change between the 2008 and 2011 reports. The change consists primarilly in an increase in estimated hunger in 2002, but with a decline by 35 million in estimated hunger in 2007. Both figures were further revised upwards in 2013, by 38 million for 2002 and and 8 million in 2007 in the 2013 report, while the 2012 figures were revised down by 25 million. (All years are approximate because the FAO does not report for single years, and changes the range of years reported from report to report).
McIntyre did lead of his article with the discrepancy with the 2013 report, which is not something for which the IPCC can be blamed. He also compared the world figures (reported by the IPCC) with the undeveloped nation only figures (shown in the graph above). That did not justify Ashton above not mentioning the rest of his article, nor my unaccountable (except for extreme tiredness) failure to notice it on my first read through.
Finally, McIntyre certainly quotes the IPCC out of context. The IPCC wrote:
McIntyre only quotes the two sentences after the bolded section. Most probably, in the context of the entire paragraph, the first sentence that McIntyre quotes, and that he dissects, is intended to illustrate the "impetus" to "World-wide attention on food access". As such, it is an appropriate citation although the sentence containing it is insufficiently clear. It may also be that the IPCC does not accept FAO revisions which are at odds with other data, a fact that may explain the FAO taking time to respond to criticisms of its index in the 2013 report. Notably, the FAO 2013 writes:
The underlined sentence indicates that if, in a given nation, the proportion of food eaten by one sector of the population increases, with a consequent decrease for another portion of the population, this will not be reflected as in increase in hunger in the FAO data. That is significant in that there was a sharp increase in food prices in 2007/8 that is likely to have caused such a shift in consumption habits and may have caused a spike in hunger that is not captured by the FAO methodology. However, while I can see this as a possibility, I do not know enough about the subject to know if it was actually the case, ie, whether the wide spread increase in hunger reported at the time was accurate, or the currently revised figures of the FAO are more accurate.
Donny, you say "I disagree with the hypothesis that dry spots will necessarily be dryer and wet wetter."
Big deal. You give no well articulated reasons.
This is also not "just" a hypothesis. Research has already found an increasing incidence of both dry and wet periods over the last 30 years, exactly as you would expect with global warming. For example research by James Hansen on climate data over the last 30 years. You can find this on the NASA website.
http://www.nasa.gov/topics/earth/features/warming-links.html
Michael Sweet. Tom Curtis @14 has replied to your condemnation of Steve McIntyre in what can only be described as a very gracious post. You suggest
"Ashton, perhaps you could copy this data to Climate Audit and tell us his reply".
Tom Curtis has done exactly that and has entered into a fairly extensive dialogue with Steve McIntyre that you might like to read. It does appear at the moment to be an unfinished dialogue.
[Rob P] Note that any further comments on that subject are off-topic and will likely result in deletion. Thread-derailment is frowned upon here, but you are being given the benefit of doubt in this instance.
http://www.huffingtonpost.com/peter-h-gleick/water-and-conflict-in-syr_b_5404774.htmla
Drought has driven the already tensions in the area higher contributing to the fighting. Like California, they are overusing their groundwater supplies to make up for the drought.
Donny @11.
For myself, I feel you are being asked to produce too much by the commenters here. It is correct that a troll is more than somebody who holds a contrary opinion. However you do manage to make some egregiously troll-like statements here. Take, for instance, your reply to the flippant question "Where is the new farmland going to come from, under the glaciers in Greenland?" You reply:-
This outlandish assertions raises some big questions. Of course, Greenland is a big island, four-times the size of France. But 81% of it is covered with a permanent icecap. How much of this ice is going to melt away by 2050? And how is that area of exposed bedrock to be converted into productive farmland to help feed the world, again by 2050 (that being the subject of discussion)?
And your assertion that Greenland was named thus because it "supported crops not long ago," flies in the face of the usual interpretation of the naming. (That usual interpretation runs " That summer Eirek went to settle that land which he had found, and which he called Greenland, for he said that many men would desire to visit it if he gave the land a good name.") So, on what basis do you dismiss this usual interpretation?
Another action that would increase food security and reduce the number of undernourished would be to stop using food for fuel.
It's Final — Corn Ethanol Is Of No Use
To me is is unethical to use food for fuel. I also find it peculiar that we did not figure out upfront that using food for fuel would reduce the amount of crop availabel for food and increase food prices.
Ma Rodger... I was responding flippantly to a non scientific jab with regard to where the new farming land would come from. There are huge tracks of land to the north of current farming belts... like southern Canada and across Asia. .... but anyone here can look at a map and see that. But rather than discuss these issues people like Rob Honey will probably ask me to find a study proving there is land in southern Canada.
However. ... this is a compilation of models. ... that don't seem to have done so well. .. www.drroyspencer.com/2013/04/global-warming-slowdown-the-view-from-space/
Donny:
Sure, there is lots of land in Canada north of current farming belts.
Some of us that can read maps can also read soil maps. Care to back up your flippant comment with some information to demonstrate that you know something about the soils in those "huge tracks [sic] of land"? I'll give you a hint: if you look in the prairie provinces, you'll find that current agricultural zones pretty much stop at the border between the grasslands and boreal forest. Further north than that, the soils are not very good. Can you demonstrate a single area in Canada where the northern regions have good soil for agriculture, so that shifting climate zones are not a problem for relocating farms?
You're long on opinion, but awfully short on information.
Here is another study and question for Mr Honeycutt. ... why would Risbey et al (2014) be studying model simulation results with regard to ENSO and throwing around the term ocean heat uptake... if all models have been doing such a stellar job? Seems like they are trying to figure out where the expected surface heat went.....and why the predictions are off.
Bob.... the boreal forest soil diffiencies are climate driven.....
Donny,
Please provide a reference to support your wild claim that a significant area of forest in Canada can be converted into farmland to replace California and Texas. Provide a cite to show boreal forest will covert to farmland on a human time scale. You have yet to provide a single reference to support your wild claims. You obviously know nothing about soils or you would answer Bob Laidlaw's question.
Donny should be required to provide data to support his wild claims. People who make uninformed claims only add to the noise, they do not add to the discussion.
Donny @21... Roy Spencer's post shows absolutely nothing supporting the statement that, "[T]he models have said a lot of things over the past 15 years.... a lot of which have been revised over the years because of inaccuracies."
The models state what they've always been stating. Climate modelers regularly improve their methods, but those have resulted in only very minor difference. In the article you post, Roy is only discussing the discrepancy between models and satellite data, where it's just as reasonable to assume that it's the satellite data that is getting it wrong.
Also note, Roy is improperly centering the comparison between the models and the satellite data by arbitrarily chosing the start point of the data.
Donny @23... Again, with Risbey, you fail to even grasp what you originally stated.
Again, you said, "However the models have said a lot of things over the past 15 years.... a lot of which have been revised over the years because of inaccuracies."
1) The models have not said "a lot of things over the past 15 years." The models have been relatively unchanged over the past 15 years.
2) The models have also not been "revised over the years because of inaccuracies." Models are coded based on known physics, they're not just plugging in random numbers to try to make things fit. Model outputs are the emergent results of the underlying physics, plain and simple.
Now, again, I would request that you retract your inaccurate statements.
[PS] Please put all replies concerning "reliability of models" on the appropriate thread in the followup that Tom Dayton has provided above. Debate works better to when you stick to one point at a time and substantiate your claims. Failure to do you will be treated as just trolling and be deleted.
Donny @20,
This is what portions of Siberia look like. Try farming that with or without heavy equipment.
https://www.youtube.com/watch?v=WKyRHDFKEXQ
[JH] Activated link.
Donny, I have responded to your citation of Spencer's "models are wrong" graph on a thread more appropriate than this one: "Models are Unreliable."
Donny@24:
No, climate is not the only difference. Your ignorance is blatantly obvious - or you are just trolling.
Here is a link to a report titled "Mapping the Quality of Land For Agriculture In Western Canada".
Figure 12 in that report is the following:
Classes 1, 2, and 3 (shaded black) are "good". Classes 4 and 5 are "severe" and "very severe" limitations. Class 6 is "marginally suitable for forage crops", and class 7 is "unsuitable for any agricultural use".
Current agriculture already fills the "good" areas. There is absolutely no way that a climate shift will cause soil changes in anything other than geological time scales.
All: Donny's most recent comment has been deleted.
Donny:
Please note that posting comments here at SkS is a privilege, not a right. This privilege can and will be rescinded if the posting individual continues to treat adherence to the Comments Policy as optional, rather than the mandatory condition of participating in this online forum.
Moderating this site is a tiresome chore, particularly when commentators repeatedly submit offensive or off-topic posts. We really appreciate people's cooperation in abiding by the Comments Policy, which is largely responsible for the quality of this site.
Finally, please understand that moderation policies are not open for discussion. If you find yourself incapable of abiding by these common set of rules that everyone else observes, then a change of venues is in the offing.
Please take the time to review the policy and ensure future comments are in full compliance with it. Thanks for your understanding and compliance in this matter.
Bob.... try to follow me here...of course there are areas now that aren't suitable. ... this is primarily due to temperature! We are talking about when the climate Shifts!
[PS] Please provide supporting evidence for this assertion and that areas can become suitable in the timescale of climate change.
Again, Donny... First, you should drop the snark. Second, you should provide sources for your claims, as everyone else here is doing.
You've still not supported your statement that, "[T]he models have said a lot of things over the past 15 years.... a lot of which have been revised over the years because of inaccuracies."
The following study gives some idea about the variation between models. It is worthwhile reading the conclusion. Is it obvious to anybody what will happen with crop yields?
North American Climate in CMIP5 Experiments: Part III: Assessment of 21st Century Projections
"Although many projected changes in NA climate are robust across CMIP5 models, substantial disagreement in some areas helps to define priorities for future research. The sign of mean precipitation changes across the southern U.S. is inconsistent among models. Models disagree on annual mean precipitation changes in the NA monsoon region. Models disagree on snow water equivalent changes on a regional basis, especially in transitional regions where competing effects occur due to greater snowfall and warming temperatures. In the southeastern U.S., the multimodel mean diurnal temperature range (DTR) signal is rather weak, accompanied by larger variance among the models. The western U.S. is characterized by large intermodel variability in the number of frost days in the Western U.S., where multimodel mean decreases in frost days (greater than 70 days in RCP8.5) are also largest. Models do not agree on how intraseasonal variability will change over the Caribbean and Gulf of Mexico, which may have implications for future modulation of hurricane activity. Projected changes in seasonal mean Atlantic and east Pacific tropical cyclone activity are inconsistent among models, which disagree on the sign and amplitude of changes in environmental factors that modulate hurricane activity. Models are highly inconsistent in projecting how the ENSO teleconnection to NA will change."
Bob Loblaw @30, the map you show is of a very restricted portion of Canada. How restricted can be seen in this map of mapped areas for land use capacity from the CLI. Looking for more general information, the most comprehensive I could find was Mills (1994). Peter Mills finds that under a doubled CO2 scenario, arable land in Canada will increase by approximately 40%, from 39 to 55 million hectares. He does not that may be accompanied by a loss of arable land in the US or Southern Canada due to reduced water supply.
To put that into context, assuming an equivalent increase in Russia, based on world wheat production statistics, that would increase potential grain and cereal production by 10%. I believe that means the additional land available will be insufficient to offset loses in production due to heat in warm regions, and loss of water.
Further to my @36, the increase in 16 million hectares for Canada compares to 11 million hectares of arable land in California, and 53 million hectares in Texas. That is, it is just 25% of the arable land in those two states. The loss of more than that 25% in those two states due to increased drought as a result of climate change will result in a net negative balance in arable land between CONUS and Canada.
Tom @ 9:36am (now 36, but number will probably change as more posts from Donny are deleted):
Your fiirst link does not lead directly to a map. It leads to a general information page on the Canada Land Inventory (CLI, which is also what was used for the previous map I included). The CLI is generally limited to areas not far beyond current agricultural zones, but at the limits it does show severe limitations not based on climate. When you get a corrected link to the map you wished to present, we can discuss it.
Your second link (Mills, 1994) leads to a paper that focuses on north-west Canada and Alaska. Its Table 5 lists areas of "potentially arable soils", and provides the CLI classes. Of the 194 million hectares included in the table, roughly 175 million hectares are in classes 5, 6, and 7. These classes are the "very severe limitations", "marginally suited for forage", and "unsuitable for any agriculture" classes I referred to above.
Mills makes the statement (p121) that "The results shown in table 6 indicate that a number of MLRAs [Major Land Resource Areas] were identified as being limited by the current climate and hence were deemed non-arable". Most of the "improvement" in arable area in Table 6 is based on shifting CLI classifications from classes 5-7 to classes 1-3.
I do not see anything in Mills (1994) to support the claim that the soil limitations are are mis-applied climate limitations. Mills' conclusions appear to be highly dependent on that assumption. I have travelled in northern Manitoba, northern Saskatchewan, northern Alberta, the Mackenzie Valley, and the Yukon. With the exception of the Peace River area, I have seen little land that I think would make a good candidate for agricultural expansion. Rocks, bogs, etc. don't make for good soils, just because the climate changes.
Perhaps you can tell me just what it is about Mills' paper that you find convincing?
There is a very important point in here. If climate change occurs slowly, then there is time for soils suitable for agriculture to develop as ice recedes - but it is a long process over centuries and millenia, not decades. Our problem isnt that the climate is changing - it that it is changing too fast.
Further to the question of possible expansion of arable land in Canada, in eastern Canada (primarily Ontario and Quebec) the current agricultural zones usually butt up against PreCambrian Shield zones, which have very little potential for agriculture. Growing up in Ontario, I saw many regions of abandoned farms that people attempted to settle in the 1800s, but could not make a go of it due to poor soils (not climate!).
The major exception I can think of in Ontario and Quebec is the Clay Belt. That is one area of reasonable soils, where changes in climate would increase agricultural potential.
The huge tracts of land that Donny is speaking about exist only in his imagination.
[PS] Please keep the tone civil.
Bob Loblaw @38, the initial link was to the correct location. The map at that location shows the limited area of Canada that has been thoroughly mapped as to soil type. However, as that causes confusion, here is a map of the Canadian Prairie from wikipedia:
As can be seen the area of the prairie approximately corresponds with the area shown by your map. Specifically, your map is bounded by Lake Winnipeg in the east, the Rockies in the west, and does not extend far north of the top of Lake Winnipeg. It includes not more than two thirds of Alberta and Saskatchewan, and much less a proportion of Manitoba. It is overall a small portion of Canada. I do not think we can reasonably argue to the lack of suitable soils for agriculture in Northern Canada from a map that does not show any of Northern Canada.
To make up that lack, I looked up Mills (1994). IMO, Mills (1994) shows that there are currently some lands in Canada suitable for agriculture as regards their soil, but on which agriculture is prevented by climate. Some of those lands will be openned up to agriculture by climate change. However, the total amount of land potentially opened up to agriculture by global warming is small relative to the total arable land in the USA plus Canada (approx 8%), and very small relative to world agricultural land (approx 1.2%). Even assuming a similar expansion in available agricultural land in Russia results in a small overall impact on abailable food production, and probably insufficient to compensate for other climate related losses.
The additional agricultural land represents just 1.6% of Canada's total land area, so I am certainly not trying to contradict your argument. Rather, I am providing a peer reviewed estimate (if dated) so that Donny can try to make his case if he thinks he has one, and noting that I do not think he does (hence my comment about comparison with global wheat production, and comparison with the arable land area of Texas and California).
Another factor missing from this discussion of potential crop yields vis-a-vis Canada is latitude and available sunlight.
The Great Valley in California for example lies between 35 & 40 North. Central Canada in contrast is roughly between 50 & 55 North.
This is the relative amounts of sunlight arriving at noon for different latitudes and time of year. From here:
It isn't just temperature and soil type that restrict crop yields in Canade vs lower latitudes. It is also available sunlight and length of growing season.
Glenn Tamblyn @42, that is a very important point. The current agricultural zone in Canada extends to about 55 North, so that future agriculture made possible by global warming will be north of that. However, noon insolation is not the best indicator of the effect on agriculture. Although at 60 North, noon insolation is less than at 45 North, the longer summer day at 60 North results in more summer insolation overall, as shown on this chart of total daily insolation by latitude and day of year:
As can be seen, however, the price of that increased summer insolation is a much shorter growing season overall. It high northerly latitudes, at most one growing season will be available per year regardless of temperature and soil quality.
Glenn Tamblyn @42, for an anecdotal test of the importance of insolation versus climate, visit England (I just did for the first time, among other things we visited Kew Gardens and the Cambridge Botanical gardens, as well as traveling by train between Cambridge and London). London's at 51 30' N, Cambridge at 52 12' N, and we were struck by how vigorous some of the plants were compared to their counterparts near Boston.
This is different climate moderation from what is expected in the future for Northern Canada so I'd expect different results then/there, but it is also an example showing that very healthy plant growth is entirely possible beyond latititude 50N.
And if I were the sort of person to plan for disaster, I'd be putting a lot of thought into figuring out how to remediate, improve, or adapt to agriculture in terrible soils. Hubris, I know, and no substitute for prevention, but draining swamps is known and ancient technology.
dr2, I think the main thing we're talking about here is not just any plant but major food crops--wheat, soy, corn...I'm not sure that these can grow in short, hot seasons as well as some of the plants you might have seen thriving. And swamps aren't as much of a problem as simple bare rock--most of the soil was scraped off of most of the Canadian Shield by the ice sheet during the last ice age, and not much soil has developed since. http://en.wikipedia.org/wiki/Canadian_Shield
And you can't quickly remediate or improve soils. It is far easier to adjust to a civilization with very few carbon fuel inputs (most past civilizations had none, after all) than to a civilization without soil (I can think of no civilization that existed without this vital resource in abundance).
Donny... It happens that Scaddenp's statement is not a wild claim. And you have still yet to substantiate any of your statements, at all.
[JH] The comment you are responding to has been deleted because it was nothing more than argumentativie sloganeering. Donny is on the verge of recusing himself from posting on SkS.
Tom@41:
The first link didn't have a map, and had several links to spots, so I wasn't sure which link you wanted me to follow there. I presume the link with the map you are referring to is this one:
http://http-server.carleton.ca/~msmith2/45211/Module5/CLI/mapping_agriculture.html
[As an aiside, the web page looks like it is course material from a course offered at Carleton University. The professor whose name is listed in the URL is Michael Smith - now retired - who was my undergraduate thesis advisor.]
As to the geographical restriction, remember that I was responding to Donny's claim (@24) that boreal forest soils are climate-driven. I presented an example where they are not, in a region of Canada where the agricultural/non-agricultural boundary coincides with the edge of the boreal forest. It's an area that I know quite well, and the boreal forest soils are severely limited by underlying geology - not climate. The map I showed included the transition from grasslands to boreal forest, and things don't improve further north from there.
As for the Mills paper, I repeat my interpretation: the paper does not adequately justify its claim that large portions of the class 5-7 soils will become classes 1-3 under climate change. The Carleton link also leads to full descriptions of the soil classes, as well as the modifiers that can be applied to each class. Mills' table 6 lists a lot of H modifiers ("Adverse climate as a result of cold temperatures"), and changes those to M modifiers ("Deficient soil moisture")with lower class numbers. The CLI does allow multiple modifiers, but I can't tell from Mills paper if he's looked at that level of detail.
I still don't see enough explanation of how Mills decided to shift those classes, and I'm not convinced. It takes a lot more than just a temperature change to create the excellent soils available in the map you include in comment #41. The black soils (best) are the result of much greater moisture availability and much more productive grasslands over thousands of years (compared to the increasing moisture deficits in the dark brown and brown soils).
North of the black soil zone is an area of even greater moisture availability, but the terrain is unfriendly to grasses and the boreal forest dominates. The tongue of black soils to the NE of Saskatoon (on your map) follows the North Saskatchewan River valley - it is geological in origin, not climatic.
My main issue with MIlls (1994) is that he seems to have assumed (not demonstrated) that the limitations to agriculture are dominated by climate, not geology. This is exactly the error that Donny has made.
Well I am very surprised that someone thinks the slow pace of soil development is wild claim, when a google of "how long soil develop" would give you the textbook answers, but least I be accused of making unstantiated claims, then this well-cited study on post-glacial vegetation recovery is useful and there is this online University of Minnesota textbook
Donny,
In this exchange we see the difference between skeptical sites like WUWT and scientific sites like SkS. When you challenged Scaddenp on the age of soils he produced (very strong) evidence tht soils are indeed very old. You have provided no evidence to support your position that soils can change in a human lifetime, although you have been asked for such evidence. At WUWT they rarely provide evidence, they argue by assertion, as you have done. Scientists argue by producing evidence to support their claims. I am more likely to believe Scaddenp the next time he comments because he has provided data that supports his claims.
The ball is now in your court. You can do one of two things:
1) Conceed that Scaddenp was correct and that you have learned something.
2) Produce evidence that supports your claims.
I do not need to challenge Scaddenp since I also knew that soils take thousands of years to develop.
Ok.... so let's discuss what we have learned. We know from Scaddenps second reference @48 that soils take different amounts of time to develop. We also know that temperature and moisture also affect the rate. In Wisconsin the soil took 8000 years to develop. So since we know that the glaciers retreated from Southern Canada around 12000 years ago. ... we shouldn't have much of a problem.