


 Arguments


Part Three: Response to Goddard
Posted on 16 July 2010 by robert way
Guest post by Robert Way
Back to the past:
“Recently it became all too clear that Steven Goddard and his camp were going to be hauling out a new argument from their cupboard and that they had every intention of using it as much as possible. The argument which is shown here and has been used again here is that absolute air temperatures throughout most of Antarctica are below 0°C (and will likely remain that way) therefore significant ice losses on the Continent cannot occur. This sort of argument might work well with those already positioned to believe whatever the disinformation factory (WUWT) churns out but for fear of the unsuspecting public becoming tainted, it needs to be addressed.”
Although mainstream media outlets love the flash and flare of statements like “global glacier melt continues”, they contribute to the strawmen that people like Goddard work so diligently to construct. Recently, Goddard entered his two-cents on Antarctic ice losses by showing that ice cannot melt at subfreezing temperatures. Well, with regards to this point, he is telling the truth, ice will not generally melt at subfreezing temperatures. It really is too bad for him that melt has very little to do with ice losses in Antarctica. Essentially he is ignoring that 90% of ice losses from Antarctica occur not through melting but through calving.
That is an important determination but one that he would love for people to forget. The truth of the matter is that although most glaciers outside of the Polar Regions do lose significant amounts of ice from surface melting, the vast majority of global glacier ice losses come from calving glaciers. These glaciers exist in many locations across the Canadian High Arctic, Svalbard (Figure 1), Alaska and Patagonia (among other regions) but primarily their significance and prevalence relates to the Greenland Ice Sheet (GIS) and Antarctic Ice Sheets (EAIS/WAIS).
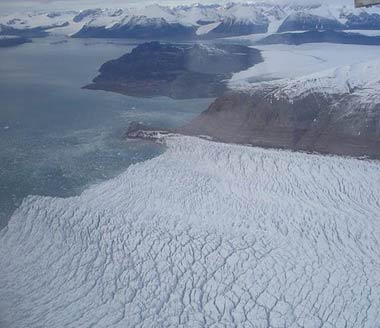
Figure 1: Calving glacier (Kronebreen) in Svalbard, Norway.
In Greenland, calving represents between 40 to 60% of total ablation (ice loss) whereas in Antarctica it represents a whopping 90% of total ablation. Goddard’s argument, unfortunately for him, is grounded in the notion that air temperatures (summer air temperatures if we’re being technical) and subsequent surface melt control ice losses in Antarctica. The truth of the matter is that because Antarctica is so frigid, surface melt induced ablation is rarely important as it only occurs in some coastal regions and across the Antarctic Peninsula. The most important mechanism in all this is calving, but let us remember that Goddard sometimes has a tendency of avoiding research that doesn’t agree with his pre-decided conclusions.
Now for some more criticisms of Goddard’s piece. He claims that ice losses from Chen et al’s 2009 study cannot possibly be true because they are occurring in Eastern Antarctica where temperatures are frigid. Let’s see what the research says.
Figure 2 shows a comparison between Chen et al’s (2009) Grace map, Allison et al’s (2009) glacier velocity map.
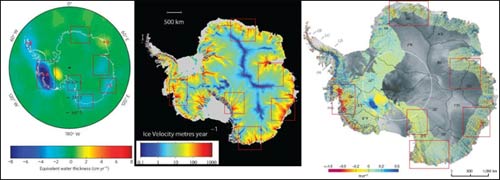
Figure 2: Comparison of Chen et al’s (2009) Grace measuremements (left), modelled Antarctic velocities from Allison et al (2009) (middle) and Icesat elevation change measurements from Pritchard et al (2009) (right).
If Goddard wonders where the mechanism for these ice losses could be hiding, perhaps he could check to see if he’s talking about dynamic regions with fast moving ice streams (See Figure 2 on right). Alas, all 5 regions are where fast moving ice streams occur. But according to Goddard’s comments below his article, ice cannot flow at high speeds when air temperatures are extremely low. Does this make the above map implausible?
The one thing about Glen’s Flow Law (temperature-ice flow relationship) is that although temperatures do partially dictate speed, there are many other factors which are important. Take for example that many of these locations are regions where ice is channelled from the interior of the ice sheet to outlet glaciers causing much higher velocities. Another thing to consider is that where the depth of ice is extremely thick, the ice can provide insulation and actually heat the bottom of the ice leading to basal lubrication and increased ice flow. Goddard can repeat Glen’s flow law all he likes but he is ignoring what really makes glaciers in these regions flow quickly. Back to the analysis, is anyone beginning to see a potential link between the images? Let’s look at Pritchard et al’s (2009) (Figure 3).
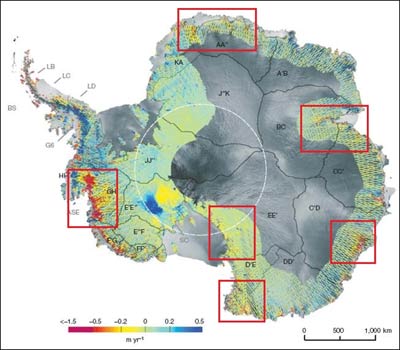
Figure 3: Elevation changes across Antarctica as measured by laser altimetry (Icesat) from Pritchard et al (2009).
Notice how EVERY location in which significant mass has been lost (based upon Chen et al’s map) that corresponding coastal glaciers are thinning (Pritchard et al. 2009). This is not hearsay but fact, direct comparison shows that coastal thinning is occurring in all the regions that Goddard later claimed in the comments were “on the deep interior of the EAIS…” and not capable of losing mass because of their extreme cold temperatures.
My analysis is further supported by Gunter et al’s (2009) (Figure 4) analysis spanning from 2003 to 2007 using Icesat (laser altimetry) elevation changes and compared with Grace data. This study finds that 5 of the 5 regions are losing mass according to Icesat and the 4 of 5 are according to Grace.
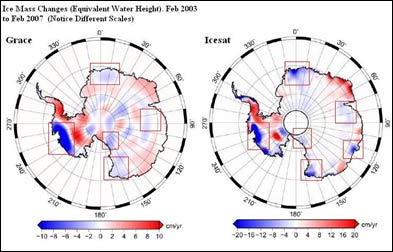
Figure 4: Comparison of Gunter et al’s (2009) Grace map (left) and Icesat map (right) over the period 2003-2007.
Need more evidence?
Rignot et al (2008) use the mass flux method (Part Two) to investigate every glacier basin in Antarctica and finds that the continent as a whole is losing 196 Gt year (1 GT almost equals 1 km3). The important determination in all this is that this study finds that the EAIS was losing around 1 Gt year in total for the year 2006. That may not sound like much but let’s consider that this study finds that the EAIS was losing ice (albeit it a small amount) for 2006 and the study Goddard was criticizing finds that the EAIS was losing 40 Gt year by 2009. Let’s go back to Rignot et al (2008) for a minute. The 5 basins pointed out by Goddard as being “implausible for ice loss” are actually investigated in this paper. All 5 basins in this investigation are shown to have negative mass balances with a total loss from these 5 basins being near 22 Gt year.
Shepherd and Wingham (2008) also show that two of the main glaciers in two of those basins (Totten and Cook glaciers) are losing mass and that these losses were accelerating by 2003.
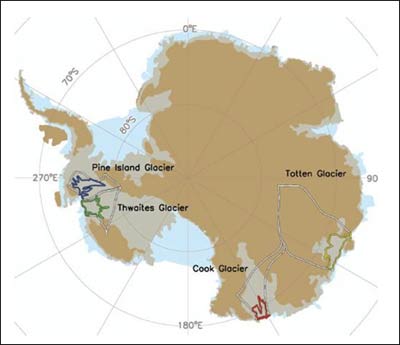
Figure 5: Map detailing location of glaciers studied in Shepherd and Wingham (2008).
So let’s round up the evidence. We have been shown that glacier losses in two of those basins were accelerating by 2003. We were then shown in 2006 that ice losses have continued to accelerate across the region and that the EAIS is losing ice specifically in the 5 basins that Goddard originally challenged. In 2009, Chen et al find that losses from EAIS have increased and that the same 5 basins pointed out by Rignot et al (2008) are even losing more ice.
When these facts were pointed to, Goddard responded by hauling out the Wingham et al (2006) (Figure 5) study using radar altimetry. There are two problems with that. First that study is old (study period ends in 2003) and secondly, it uses a low resolution radar altimeter which has a bias towards showing mass gains as discussed previously (Part Two). Some people may challenge this assertion but Thomas et al (2008) set out to find whether Radar Altimetry does create a bias towards more positive values. Their results? Radar Altimetry caused ice losses in Greenland to be less than measured by Icesat (extremely accurate) by 75 GTyear because of this bias. Cryosat-2 should alleviate these problems but it is annoying for individuals to keep hauling out a study that has effectively been countered by numerous more accurate measurement techniques (Allison et al. 2009 or Part Two).
Overall, I think it is important to conclude by showing the following figure (Figure 6) and to summarize by saying that ALL forms of measurement show that Ice losses from the Antarctic continent not only exist but are accelerating. Certain ones show more losses than others but the TRENDS ARE THE SAME. This can be Goddard’s “Inconvenient Truth”.
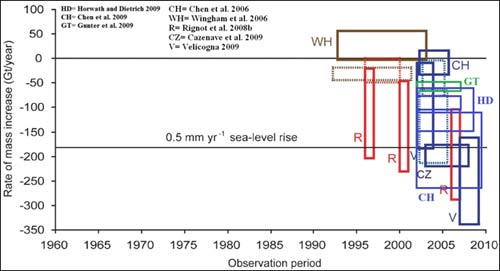
Figure 6: Mass balance estimates of Antarctica (Adapted from Copenhagen Diagnosis). Green represents estimates using Laser Altimetry, Brown represents estimates using Radar Altimetry, Red represents estimates using Radar Interferometry and Blue represents estimates using Gravimetry.
References
Allison,
Cazenave, A., Dominh, K., Guinehut, S., Berthier, E., Llovel, W., Ramillien, G., Ablain, M. & Larnicol, G. (2009). Sea level budget over 2003–2008: a reevaluation from GRACE space gravimetry, satellite altimetry and ARGO. Global and Planetary Change, 65, 83–88.
Chen, J.L.,
Chen, J.L.,
Chen, J.L.,
The
Gunter, B., Urban, T., Riva, R., Helsen, M., Harpold, R.,
Horwath, M., and Dietrich, R. 2009. Signal and error in mass change inferences from GRACE: the case of Antarctica. Geophysical Journal International. 177, 849-864.
Pritchard, H.D., Arthern, R., Vaughan, D., Edwards, L. 2009. Extensive dynamic thinning on the margins of the Greenland and Antarctic ice sheets. NATURE. 461, 971-975.
Rignot, Eric & Thomas, Robert. (2002). Mass Balance of Polar Ice Sheets. Science. 297 (5586), 1502-1506.
Rignot, E., Bamber, J., Van Den Broeke, M., Davis, C., Li, Y., Van De Berg, W. & Van Meijgaard, E. 2008a. Recent Antarctic ice mass loss from radar interferometry and regional climate modelling. Nature Geoscience, 1, 106–110.
Shepherd, A., Wingham, D. 2008. Antarctic glacier thinning, 1992-2003. Scottish Geographical Journal. 124, 154-164.
Velicogna, I. 2009. Increasing rates of ice mass loss from the Greenland and Antarctic ice sheets revealed by GRACE. Geophysical Research Letters. 36, L19503, doi:10.1029/2009GL040222.
Wingham, D., Shepherd, A., Muir, A. & Marshall, G. 2006b. Mass balance of the Antarctic ice sheet. Philosophical Transactions of the Royal Society, A364, 1627–1635.
References in Figure 3 (overall mass balance estimate)
Cazenave et al. 2009
Chen et al. 2006
Chen et al. 2008
Chen et al. 2009
The Copenhagen Diagnosis. 2009
Gunter et al. 2009
Horwath and Dietrich. 2009
Rignot and Thomas. 2002
Rignot et al. 2008
Velicogna, I. 2009
Wingham et al. 2006


 0
0  0
0 Greenland mass balance and its components Surface Mass Balance (SMB) and Discharge (D). Before 1996, D and hence SMB - D, are poorly constrained and therefore not shown.
and here's one that breaks down surface mass balance into its components:
Greenland mass balance and its components Surface Mass Balance (SMB) and Discharge (D). Before 1996, D and hence SMB - D, are poorly constrained and therefore not shown.
and here's one that breaks down surface mass balance into its components:
 Surface Mass Balance (blue) and its components precipitation (red), runoff (orange) and sublimation (green).

 Such as is the case with the Fleming Glacier below.


Comments