Climate Science Glossary

Term Lookup

Enter a term in the search box to find its definition.

Settings

Use the controls in the far right panel to increase or decrease the number of terms automatically displayed (or to completely turn that feature off).

Term Lookup

Settings


All IPCC definitions taken from Climate Change 2007: The Physical Science Basis. Working Group I Contribution to the Fourth Assessment Report of the Intergovernmental Panel on Climate Change, Annex I, Glossary, pp. 941-954. Cambridge University Press.

Home Arguments Software Resources Comments The Consensus Project Translations About Support

Twitter Facebook YouTube Mastodon MeWe

RSS Posts RSS Comments Email Subscribe


Climate's changed before
It's the sun
It's not bad
There is no consensus
It's cooling
Models are unreliable
Temp record is unreliable
Animals and plants can adapt
It hasn't warmed since 1998
Antarctica is gaining ice
View All Arguments...


Username
Password
New? Register here
Forgot your password?

Latest Posts

Archives

Global warming stopped in 1981... no, wait! 1991!

Posted on 31 March 2008 by John Cook

The modern global warming trend began around 1975 and has shown a long term warming trend of 0.18°C per decade since. That's not to say the warming trend has been monotonically constant with each year slightly warmer than the previous. Short term weather fluctuations cause a noisy signal. Large volcanic eruptions lead to dramatic cooling over several years. El Nino/La Nina has a cycle of warming and cooling lasting 4 to 5 years. To demonstrate climate's variability, let's examine a 6 year record early in the global warming period.
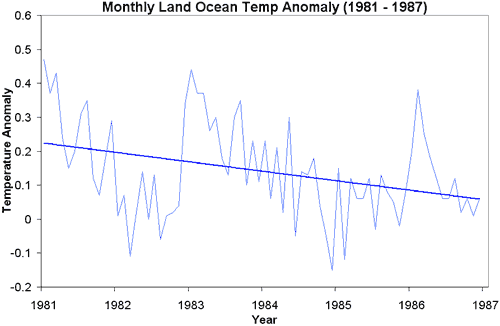

Figure 1: Land-ocean temperature anomaly (NASA GISS) 1981 to 1987.

You're on shaky statistical ground asserting a climate trend over short periods. Both Stoat and Atmoz demonstrate the insignificance of 5 year trends. Nevertheless, I'm going to risk a slap on the wrist from Tamino by adding an ordinary least squares fit. The trend line indicates a distinct cooling of 0.27°C cooling per decade! If the blogosphere has been as active in 1987 as it is now, "global warming stopped in 1981" would be a certain front runner on the skeptic leaderboard.

Let's jump ahead a few years. Here's another 6 year period starting in 1991. From 1991 to 1997, the long term warming trend of 0.18°C per decade slowed to 0.12°C per decade.
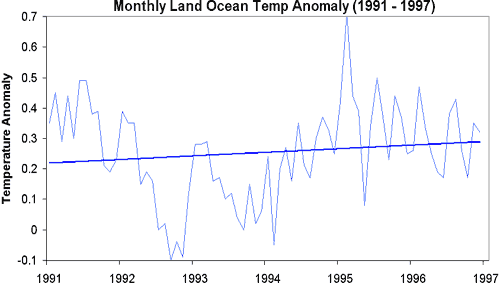

Figure 2: Land-ocean temperature anomaly 1991 to 1997.

However, it's worth noting Mount Pinatubo erupted in 1991, causing global temperatures to drop over 0.4°C. If you remove the volcano induced dip from 1992 to 1994, the overall trend from 1991 to 1997 is an actual cooling of 0.08°C per decade.

Now fast forward to the most recent decade. When someone argues global warming stopped in 1998, they lose credibility. 1998 was unusually warm due to a strong El Nino (one of those short term weather fluctuations mentioned above) so it's not surprising that the subsequent years were cooler. Climate change is about discerning trends, not comparing single anomalous years. But what if you plotted a linear trend since 2002?
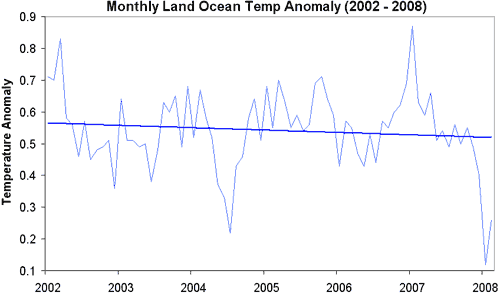

Figure 3: Land-ocean temperature anomaly 2002 to 2008.

From 2002 to 2008 (including the La Nina cooled early months of 2008), we observe a cooling trend of 0.08°C per decade. So we see it's not uncommon to observe brief periods where global warming slows or even temporarily reverses amidst long term warming. The trend over the last 6 years is not unprecedented. But could it be the beginning of the reversal of the long term trend?

To answer that, you need to go beyond statistical analysis and look at some of the physical processes involved. The three time periods discussed above all have something in common, highlighted below in light blue:
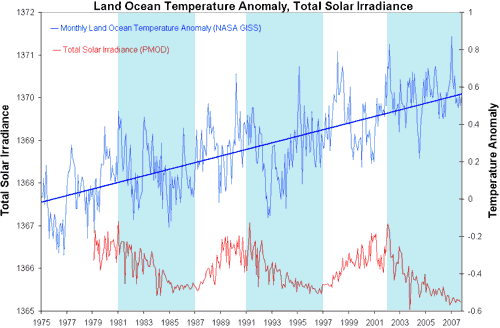

Figure 4: Land-ocean temperature anomaly 1975 to 2008 (blue with trend line), Total Solar Irradiance 1978 to 2008 (red). Light blue area indicate periods when solar irradiance is falling due to the 11 year solar cycle.

The sun displays an 11 year cycle of rising and falling solar activity (the red line in Figure 4). Figures 1 through 3 are all periods where solar activity is falling. Camp 2007 found a statistically significant signal of 0.18°C in global temperature attributable to the 11 year solar cycle. In other words, as the sun moved from solar maximum in 2002 to solar minimum in 2008, falling solar activity lowered global temperatures by around 0.18°C. This is a greater rate than the long term global warming trend!

What are the consequences? The current "plateau" of global temperature is not only not unusual but is expected. Global warming hasn't reversed. Rather, this is a brief respite before solar activity begins rising in Solar Cycle 24. When this happens, in the words of Tung and Camp 2007, solar forcing will double the amount of global warming expected from greenhouse warming alone.

UPDATE April 1 2008: Scratching around for other studies on the solar signal in global temperatures, I find Douglass 2004. He calculates that due to the 1W/m2 change in TSI, you would theoretically expect a change in global temperature of 0.05°C. Instead, he observes a change of 0.1°C (using data from 1978) - he attributes the difference to positive feedback. White 1997 finds sea surface temperatures change by 0.1°C due to the 11 year solar cycle, looking at data from 1955 to 1994. Scafetta 2005 finds the 11 year solar cycle causes a change of 0.11°C in global temperatures going back to 1860. So it may be Camp 2007 overestimates the solar signal in global temperatures and the drop in solar activity from 2002 to 2008 led to around 0.1°C cooling. This equates to a cooling trend of 0.167°C per decade - roughly equivalent to the long term warming trend.

0 0

Printable Version  |  Link to this page

Comments

Comments 1 to 18:

  1. John: I think this is a really interesting post. I will have to think about it over a while. But I think the key thing is that this is to be expected yet all we hear about is warming stopped in 98, no wait, 2001, no it's really 2002, etc. Thanks again for Skeptical Science. John Cross
    0 0
  2. John, Nice post. I have also looked at the influence of solar cycle on global temperature. However, although the correlation after 1960 looks quite impressive, it diminishes when going further back. You find also oscillations in the order of about 10 years, however, the correlation to the solar cycle is rather negative. This is hard to explain by data uncertainty (global temperature since 1870 is not too bad and the sunspot data is not either). And if you look a little bit closer to solar and temp cycle over the last decades there is a phase shift changing the sign over that period. So I am sceptical, if this quasi-10y-oscillation seen in global temperature really is a response to the solar cycle. It might also be an internal resonance frequency of the climate system and the correlation over some decades is accidental. Looking at longer time series, this seems more probable. In this case, the geographical patterns shown by Camp and Tung might just represent the difference between warm and cold years of this internal oscillation (like it exists e.g. for ENSO). However, be it a response to the solar cycle or an internal oscillation, we can expect that we are at the minimum now and there will be a rise over the next years; subject to the reservation that the oscillation has only been rather regular over a few decades, but not before...). Urs Neu
    0 0
    Response: Interesting analysis. Camp's study does only go as far back as 1960. There are other studies that find a similar solar signal (although not as much as Camp, they seem to find a 0.1C solar signal in global temperatures). Will track down some of these studies, see how far back they go.
  3. Hi John, What trend line do we get if we remove the "noise" that originates from varying solar irradiance? Can't the solar wattage differentials can be factored out to show the actual GHG forcings, both with and without feedbacks? I think that'd be far more informative than trying to glean out the solar noise from the general climate noise. Any difference would represent GHG forcings, not solar. Best regards, /lee
    0 0
    Response: You don't ask much, do you?! As the long term solar trend has been one of slight cooling over the last 30 years, if you took out solar influence, if anything the global warming trend would be slightly higher.
  4. Hello John! GO: http://www.John-Daly.com. scroll down, click on "Station Temperature Data" and find the charts for Death Valley and Alice Springs. These temperature-time plots show no evidence for any global warming at these sites as well as most of the rural (i.e., remote) sites. Note the Alice Springs plot which starts about 1880. Go read "What the Station Say..." to learn about the late John Daly's criteria for selecting these particular stations. He is not cherry picking these stations. Note the distibution of these remote stations. Most temperature data in the GISTEMP data base from or near urban areas has been adjusted for bias due to UHI effects. Rural station data is used to determine the adjustment algorithims. You can find a discussion about the slicing, dicing and homogenization (SDH)of these temperature data records over at Steve Mc's blog. GO: http://www.climateaudit.org. John Daly's solution to the SDH of data from urban areas or any comprised site is not use it. I used the GISTEMP data to extend the annual mean temperature-time plot for Death Valley to 2007. The extention continues the flat line trend of the plot. Here is a link to "Global Warming: A Closer Look at the Numbers. GO: www.clearlight.com/~mhieb/WVFossils/greenhouse_data.html Monte Hieb is a mine safety engineer and works for the WV Dept of Mines. There is no conclusive evidence that the current warm years (i.e., 1975-2005) are the result of any CO2-induced "global warming".
    0 0
  5. Harold Pierce Jr Interesting link but why do they think that water vapor is not to be included in man made gases? The INTENTIONAL output from cars and LDTs is Water Vapor and CO2 instead on HC, CO and NOx. We have been converting these gases since the early 1970's by installing emission controls that reduce fuel economy in favor of "cleaner air".
    0 0
  6. John Nice post but the title should be AGW versus the sun. Kidding aside I found it interesting. I started coming to this site from RealClimate because I wan't to learn more about the AGW hypothesis without getting into a shouting match. In the short time I have been reading your blogs I have picked up quite a few points. Thanks and keep it up. Open minds are somewhat refreshing.
    0 0
  7. The same could be said for the starting the graph right after the Little Ice Age which is generally when the trend is set. OMG!!!! warming after the LITTLE ICE AGE, so shocking and unprecedented!!!
    0 0
    Response: May I direct you to another popular skeptic argument, we're coming out of an ice age.
  8. And one more thing... According to the AGW theory temperatures should increase in direct proportion to C02 with positive feedbacks. This would suggest that the temperature should have increased in a steady logarithmic direction and not the ups and downs of the post Little Ice Age warming.
    0 0
    Response: Over the short term, we see weather fluctuations imposed over the long term trend - internal variability, if you will. Over the long term, we also observe secular  ups and downs as climate is influenced by more than one forcing. For example, the early 20th century experienced warming when CO2 forcing was much less than it is now. Similarly, it cooled mid-century due to increased forcing from cooling aerosols.
  9. Ummm, John.... In your article 'Did global warming stop in 1998?', with regard to global mean temperature anomaly data you say;- "They find the linear trend over 1998 to 2007 is a warming trend in all three data-sets." Yet above you say;-" You're on shaky statistical ground asserting a climate trend over short periods." You can't have it both ways...
    0 0
  10. I'm also interested to know what sort of timeframe of continued cooling or continued unchanging global temperatures would be required for the proponents of AGW to concede that global warming had indeed stopped... 20 years, 50 years, 100 years... what?
    0 0
  11. HealthySkeptic It depends on how old they are and how healthy. They will die claiming AGW even if they are crushed by glaciers.
    0 0
  12. Quietman, Yes, sadly, I fear you are correct.
    0 0
  13. Fear is the greatest behavioural driver in mankind. It is dominant in all our thinking patterns and activities and (sadly) is currently beginning to supplant rationality and reason ( Just look at PC and its effects) Because living in a perpetual state of fear is untenable, we seek ways to 'externalise' it into 'problems' we can solve. This reduces the internal tensions fear generates. Prove this particular problem does not exist or cannot be solved and the fear will be transferred into another problem....no it isn't CO2, instead it's all that water vapour we are putting into the air......
    0 0
  14. Re #13 That's nonsense of course. And what does schoolboy pseudo-psychoanalysis have to do with atmospheric, ocean and radiative physics? It seems a bit "conspiracy theorist" to me! Of course fear isn't "the greatest behavioural driver in mankind". I would suggest that sex, ambition, the imperative to care for our children, the drive for creativity, learning and understanding of our environment and world, and so on, are greater "behavioural drivers"; certainly nowadays... As for "supplant(ing of) rationality", I wonder whether you might have got things rather back to front! One of the reasons that "fear" has lost its impact on our lives is that rationality has increasingly dominated our social strutures during the last several hundred years and especially since the 19th century, when a modern scientific rationality has increasingy been the mainstay of social development. While this has been very beneficial to people living in these social strucutres overall, scientific rationality is rather dangerous for various vested interests, and so major institutional structures have developed, especially in the US, to pursue anti-rational campaigns against various aspects of science (e.g. misrepresenting the science on lead in paint and gas, misrepresenting the science on the dangers of asbestos, misrepresenting the science on the effects of ciggie smoking on morbidity and mortality, misrepresenting the science on the effects of aspirin-taking in children with respect to Reyes syndrome, misrepresenting the science on the effects of passive smoking, misrepresenting the science on the effects of chlorofluorocarbons on high altitude ozone.... ...and now misrepresenting the science on global warming. One of the extraordinary things that comes out of this is the extent to which a large proportion of US citizens have been "politicized" into going along with this rubbish even as it undermines their own better interests. They're willing to be treated as chumps, and to imbibe obvious nonsense fed to them on web sites from the likes of Fred Singer, Roy Spencer, some German schoolteacher (!) and so on (a surprisingly small motley crew of the highly misguided if not downright charlatan). Happily, it seems to me that outside of this "parallel universe" of nonsense, policymakers and individuals in general are behaving entirely rationally and without fear in addressing the rather clear scientific imperative to address the problems of massively enhanced greenhouse gas concentrations. It's sad to see the horrendous real/attempted duping of the US population by the anti-rational (of course they're highly rational in the context of pursuit of their vested interests!). This has had a dreary effect on US sociopolitic in the last few decades, with a remorseless driving up of income and wealth inequality...the associated downward drift in social mobility ....rather dismal population health indicators combined with massive health structure costs and so on... ..you might be interested in reading a new book by Professor Larry Bartles (political economist at Princeton) in which he explores the odd phenomenon of the last few decades in the US in which a large proportion of the US population has been "complicit in its own political fleecing" [***] ...the credulous willingness to be taken in by anti-science nonsense on global warming is just more of the same. [***]The Political Economy of the New Gilded Age by Larry M. Bartels Princeton University Press, Princeton, NJ, 2008 (quote from Robert Grafstein in his review of the book in Science magazine yesterday; 31st October p 681).
    0 0
  15. Re #14 That's rubbish of course. What has that load of "schoolboy pseudo-psychoanalysis" have to do with "atmospheric, ocean and radiative physics"? -)
    0 0
  16. Well yes HS. I'm sure we would all agree that: (i) fear isn't "the greatest behavioural driver of mankind" and: (2) that when it comes to understanding the greenhouse effect, the consequences of massive enhancement of greenhouse gas concentrations, and so on, we should consider the scientific evidence and not resort to conspiracy theorising, or pseudo-psychoanalysis. It's all about the evidence isn't it...? I hope we would all agree on that. We don't pretend that these aren't serious issues by raising ludicrous shcoolboy psychoanalytical notions about "externalising" our "untenable" "perpetual state of fear"! What's your opinion?
    0 0
  17. #16 I agree with your point (i), however I think unwarranted fear is what's being generated by some people's interpretation of the evidence... that and the media sensationalisation of the extreme, potential consequences of that evidence.
    0 0
  18. #14: "Of course fear isn't "the greatest behavioural driver in mankind". I would suggest that sex, ambition, the imperative to care for our children, the drive for creativity, learning and understanding of our environment and world, and so on, are greater "behavioural drivers"; certainly nowadays..." Wrong Chris, the primary driver is SURVIVE because all the things you quote cannot happen if you are dead. And more times than you think it is that old hindbrain that keeps you alive.
    0 0

You need to be logged in to post a comment. Login via the left margin or if you're new, register here.


The Consensus Project Website

THE ESCALATOR

(free to republish)


© Copyright 2024 John Cook
Home | Translations | About Us | Privacy | Contact Us