


 Arguments


Sea Level Rise is Spiking Sharply
Posted on 31 March 2015 by Rob Painting
Global sea level is rising because of warming from the industrial greenhouse gas emissions we humans keep pumping into the atmosphere. The expansion of seawater as it warms, and the addition of meltwater from disintegrating land-based ice, enforce a relentless rise in sea level. Despite this ongoing rise, there are significant year-to-year fluctuations due to variations in the volume of water equivalent stored (predominantly) in the tropical land basins, and as snowfall on the gigantic ice sheets of Antarctica and Greenland.
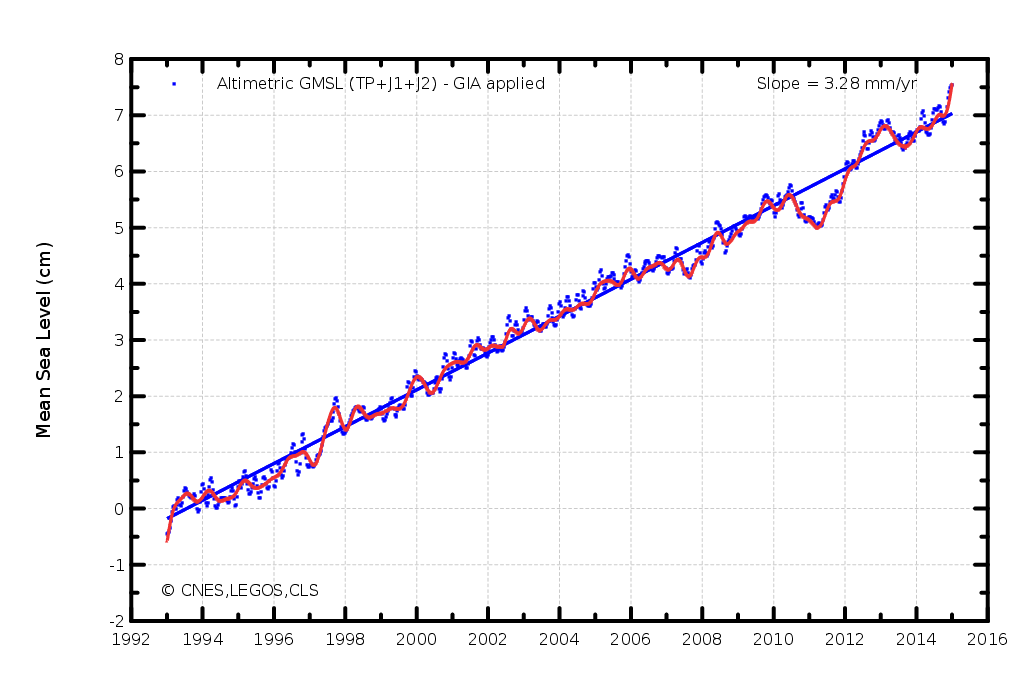
Figure 1 - Global sea level rise from 1993-2015 as measured by satellite altimetry. The surge in sea level rise at the end of 2014 is likely to be temporary, but may signal the drying out of the major continental basins in the tropics. Image from AVISO.
As explained in the SkS sea level in 2010 rebuttal, El Niño is a time when anomalous warming occurs on the surface of the eastern tropical Pacific Ocean. This happens in response to weaker-than-normal trade winds which blow westward near the equator. Because the Coriolis Force, which typically deflects objects in motion at an angle to their path of travel, is negligible near the equator, warm water is dragged along in the same direction as the wind and piles up in the tropical western Pacific Ocean.
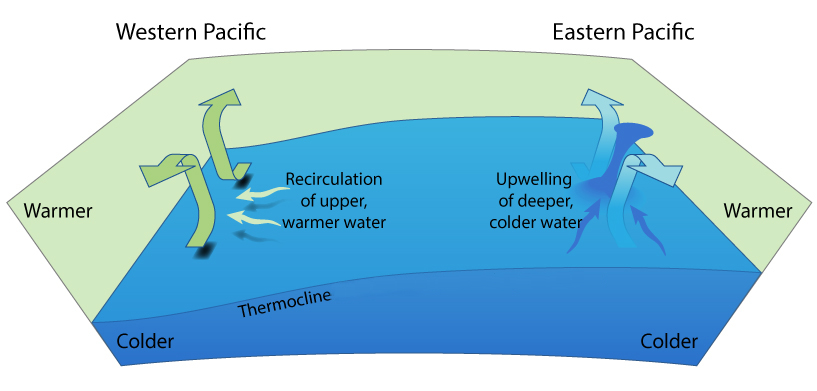
Figure 2 - Upwelling at the equator. The trade winds result in a net flow of water away from the equator due to the Coriolis Force. At the equator subsurface water is drawn up to the surface to replace it. The shallow thermocline (a result of water displacement to the west in the thin equatorial strip where the Coriolis Force drops to zero) in the east enables nutrient rich cold water from the deep to be drawn up to the surface, whereas in the west the deep thermocline results in recirculation within the layer above the thermocline. Image by jg.
Weakening of the normal trade wind strength allows the warm water in the western tropical Pacific to flow back toward the eastern Pacific in pulses known as Kelvin waves. The pattern of sea surface temperature which results, generally causes the tropical basins to dry out as rainfall is pulled away from the continents and concentrated over the oceans instead. There is a temporary spike in the rate of sea level rise as extra water is drained back into the ocean.
Figure 3 - Precipitation anomalies for typical El Niño (in mm). Numbers represent the 8 largest tropical river basins 1) Niger, 2) Congo, 3) Okavango, 4) Indus, 5) Ganges, 6) Mekong, 7) Orinoco, 8) Amazon. The drying of tropical continental basins temporarily raises the rate of sea level rise. Image adapted from Dai & Wigley (2000).
El Niño Reluctant No More?
Strong westerly wind bursts (i.e. weak or non-existent trade winds) in early 2014 raised the spectre of a major El Niño forming in the equatorial Pacific Ocean last year. Even though a huge Kelvin wave formed in April, which implied the possibility of a significant El Niño taking shape, only a very weak El Niño appeared in late 2014. Forward to the present and we now have another Kelvin wave making its way east across the Pacific.
Figure 4 - A Kelvin wave makes its way eastward across the equatorial Pacific Ocean (centre frame) in response to westerly winds bursts. Note that this animation shows an anomaly - a departure from the average water temperature. The warmest temperature in the water column is still at the surface - as buoyancy would dictate. Image from NOAA's Climate Prediction Center.
Unlike the first half of 2014, when there was a strong hemispheric asymmetry as westerly wind bursts tended to be largely confined to the northern hemisphere, late 2014-early 2015 has seen a weakening in the southern hemisphere wind-driven ocean circulation too. This will have weakened the poleward transport of warm water out of the tropics and therefore diminished the ocean's capacity to drain the warm water contained in the Kelvin wave before El Niño can take hold. So it may help nudge the climate system into an El Niño state.
Figure 5 - Sea surface temperature anomalies suggest the emergence of the El Niño spatial pattern in the eastern tropical Pacific (a 'warm tongue'). This may strengthen as the warm water anomaly (Kelvin wave) moves along the equator toward the South American continent. OISST image from NOAA's National Climatic Data Center (NCDC).
If El Niño does form later this year, we should expect the continental basins in the tropics to dry out and the recent surge in sea level rise to continue.


Technically speaking, we are in an El Nino now, albeit a very weak one. So it may not come down top whether an El Nino develops, but whether this one persists and intensifies.
Interestingly almost all of the statistical models reviewed by NOAA are predicting a shift to neutral conditions, whereas most of the more mechanistic models are predicting a strengthening of the El Nino.
From the description under the first figure: "...may signal the drying out of the major continental basins in the tropics."
Is this really the only likely explanation? Don't we expect an acceleration in slr at some point from increasing losses from GIS and WAIS among others? Haven't we been hearing more about further evidence of destabilization of both? How would we know if increase loss from these source are or are not part of the cause of the recent increase in the rate of slr?
Wili,
The GRACE satellite can measure where the water is coming from. We will undoubtedly hear in 6-18 months where that is. If more water moves around during this El Nino cycle (as is likely) it may get complicated. Until then we all get to cherish our pet theories. (I am interested in your idea also).
Stephen Baines @1
Based on the NOAA method of 5 consecutive 3 month averages of the Nino 3.4 region being 0.5 C or more above the baseline value the soom to b published JFM value is likely to establish that an El Nino event is occuring and it started in the SON 2014 set of months.
However, the latest Australian Meteorological ENSO wrap up (issued March 31), does not yet consider the conditions to have reached El Nino status.
So based on NOAA methods for indicating El Nino the warm event has been with us for a while, but the Australians do not think El Nino conditions have even started, it is only near to occuring.
Yes, Maybe I jumped the gun on NOAA's official call of a full fledged El Nino episode as it seems a fait accompli. The fact that different organizations differ indicates how weak the El Nino conditions are.
Directly related to the current mild temperature of the Western Pacific Ocean...
Category 5 Super Typhoon Maysak is packing sustained winds of at least 160 miles per hour as it takes aim at the tiny island of Yap in the Caroline Islands on Tuesday. The typhoon is the third of the year so far, which sets a record for the most typhoons so early in the Western Pacific typhoon season, according to meteorologist Jeff Masters of Weather Underground.
The storm is rarer still when looking only at the record of typhoons that reached an intensity of Category 3 or stronger before April 1. Such typhoons are known as major typhoons.
Super Typhoon Maysak marks the first time two major typhoons have occurred in the Western Pacific before April (the other was Typhoon Higos). The storm is even rivaling the strongest storms on record for so early in the year, which were Super Typhoon Ophelia in 1958 and Super Typhoon Mitag, which occurred in March 2002. The typical Western Pacific typhoon season runs from April through October.
Category 5 Super Typhoon Maysak sets record in Western Pacific by Andrew Freedman, Mashable, Mar 31, 2015
Sea level rise is interesting.
It looks like an almost linear rate of increase however the rate has accelerated since the 1990's.
Also not sure if accounted for or what influence this has, however seeing the sea as a wide flat rimmed basin, as the level goes up doesn't the surface area covered by the sea go up also, and therefore doesn't the volume expansion needed just to miantian the same rate of sea level rise have to be accelerating?
And when melting the underneath of an underwater grounded icesheet (e.g. Pine Island), presuming the above sea level proportion is still effectively supported, won't sea levels fall slightly as the ice in the melted hollow below sea level is replaced by water due to ice's larger volume? Sure this is a tiny effect, although large parts of Greenland and Antarctic do have below sea level and seabed grounded icesheets.
And considering those underwater ground icesheets further, if the above sea level icesheet that is supported below by a column of ice that reaches to the seabed (i.e. the icesheet above sea level is not floating and therefore not displacing sea water at the moment), suddenly became unstable due the melting by the warm bottom water undermining the below sea water level ice's supporting structure to the point of failure, such that the now unsupported part of the ice sheet would effectively suddenly falling into the sea, could relatively rapid jumps in sea level occur? Presuming the above sea level ice sheet would falls slowly and gracefully into the sea.
Sort of like undermining castles walls, do the above sea level parts of the below sea level icesheets have the potential to basically fall into the sea as there bases become more and more undermined??
Could that be a sudden event?
Suppose depnends on how fast and extensive the undermining is?
Regarding paragraph three: I'd be assuming this factor is close to negligible! (Never thought about it but so nice point.)
If we are looking at a linear increase since the 1990s that means the economic rise of China hasn't been reflected in the graph and presumably we all still have this to look forward to.
Education please: How do you measure sea level to the accuracy needed to determine a rise?
You are measuring something that:
As a younger pup I used to do canoe expeditions that would finish on Lake Winnipeg. That lake, much smaller than an ocean was subject to 'wind tides'. Water level in the south basin could rise 2-3 feet with a strong northwesterly, common after a major storm passed.
The short term effects I can see being smoothed out by locating your guage in a tube of porous material such as gravel or sand. This has enough drag to smooth out the waves. But how do you deal with the long term cycles?
Assuming that you get one instrument readings ironed out, how do you merge the readings for a world, given that the guages are not well distributed over the world's coast lines, and there is a lot of ocean that isn't handy to a coast line?
This would be a good education piece.
sgbotsford, the answer to all your questions is found in the caption for the first image in the article above, "...as measured by satellite altimetry".
ranyl @7:
1) It is estimated that a 0.66 meter sea level will cover 26 thousand square kilometers of land. In contrast, the oceans have an area of 361 million square kilometers. Ergo, a 0.66 meter rise in sea level would require an expansion in volume of 238.3 x 10^12 cubic meters if the shore line was vertical such that no extra land was covered, and an additional 8.6 x 10^9 cubic meters to cover the land. That is, it would require an additional 0.004% volume to allow for the sloping shore line. So, while the effect you describe is real, it is also negligible.
2) The melting of floating ice actually raises sea level slightly due to the different densities of saline water (as found in the sea) and fresh water (as found in ice). Grounded ice, which by definition is not floating, and hence has more volume than an equivalent area of barely floating ice must raise sea level rise even more. Ergo when grounded ice is undercut be melting, that melting provides sufficient water to fill the cavity, and then some.
3) When ice shelves break up, the ice does not melt instantaneously. Rather, it hangs around as ice bergs, some of which can survive several years. Further, the volume of ice in any given ice shelf is not larger relative to the total mass loss from Antarctica or Greenland. So, while the break up of a large ice shelf may slightly accelerate sea level rise, it is unlikely to do so appreciably.
sgbotsford @10, taking your lake analogy, a high wind tide on one side of the lake would result in a low wind tide (reduced apparent level) on the other side of the lake as volume overall would be unchanged. If you had three or four water level gauges spaced around the lake, you would be able to detect this effect and remove it from any measure of total lake level.
By analogy, you can do the same with the world's oceans. Admitedly the oceans are large enough that such effects might result in a temporary rise in sea level at the center of the ocean, but tide gauges are found on islands as well as on continental shores. Therefore such an effect is unlikely to not be detected. Of course, such measurements will not be perfect, and there will be a small amount of noise resulting. The noise, however, is likely to be unbiased (ie, to not create spurious long term trends) and short term so that it will not effect overall measurements.
Further, with regard regular tides, tidal measurements are made for high and low tide so that the effect is easilly removed. Tide gauges can also easilly remove the effect of waves by a variety of means, ie, by buffering the water so as to reduce wave motion where measured, or by continuous measurement with the effect of the waves being removed as with tides.
However, as CBDunkerson points out above, the measurements above are satellite measurements so that they have near universal coverage of the oceans. Therefore they do not miss the total effects of "wind tides" with rises from one being compensated by falls in the other. They can eliminate the effect of tides by calculation (as the effect causing the tides is well known, and easilly calculated for the ocean surface, if not for all shorelines) and waves will be averaged out at the resolution of the radar used for altimetry.
Interesting article thanks. I had noticed the increase on the AVISIO site but hadn't realised that reduced rainfall in the tropical basins was a significant cause. I had assumed it was warmer surface water expansion and/or more ice melting.
The sea level graphs are so smooth compared to the global temperature - there's no hiatus with slr. It's been relatively smooth but gradually curving further upwards since 1880 as shown on the CSIRO site below (go to the bottom of the page)
www.cmar.csiro.au/sealevel/sl_hist_few_hundred.html
The question is .. "..do we observe a regular doubling period?"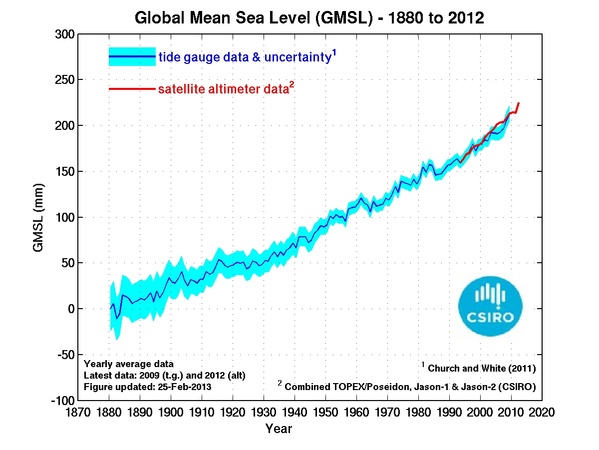
Ranyl
Possibly the greater effect as the Antarctic ice sheet melts will be the decrease in the sidways force of gravity, pulling the water toward Antarctic and causing sea level to rise around the world
Sgbostsford. A way of measuring the average height of a fluxuating sea is to use a stilling well. It is essentially a bunch of culverts with its joints sealed up and with a cement bottom which is sunk vertically near the sea. It is connected to the sea by a thin pipe and a depth measuring device is set on the platform on the top. For averaging the average of the first well, you can have a second stilling well off the first.
@15, this question begs an equally pointed one : "How long actually is the delay between carbon emission and sea level rise?"
"2) The melting of floating ice actually raises sea level slightly due to the different densities of saline water (as found in the sea) and fresh water (as found in ice). Grounded ice, which by definition is not floating, and hence has more volume than an equivalent area of barely floating ice must raise sea level rise even more. Ergo when grounded ice is undercut be melting, that melting provides sufficient water to fill the cavity, and then some."
Thanks Tom for the area expansion calculations, a small effect the sea is huge.
On the above I'm not sure that the melting of below sea level seabed grounded ice will raise sea levels.
1029 kg/m3 Sea Water
999 Kg/m3 Density of fresh water
916 Kg/m3 Density of Ice
For from these figures if you melt a 1m3 of ice you produce 916kg of freshwater, which occupies a volume of 0.917m3, leaving a volume of 0.083m3, or ~8% of the original volume of the seabed grounded ice has to be replaced with sea water. Therefore 8% of whatever volume that is being melted at the bottom of the seabed grounded ice sheet needs to be replaced by incoming sea water? ...?
Lastly if this 8% replacement is the case, I wonder if this dynamic volume deficit may also draw the sea water in, and as the low density fresh water also needs to be replaced as it floats away it alsodraws in bottom waters, and I wonder if this drawing in affect may accelerate the bottom melting to a degree, as the drawn in bottom waters are also warmer than the fresh water being replaced?
For the query on the possibility of more sudden jumps in sea levels and the undermining melting of seabed based icesheets, I wasn’t meaning the floating ice shelves; I was talking of icesheets themselves that are seabed grounded. I am asking basically, can undermining the supporting below sea level part of the seabed grounded icesheet possibly result in large side collapses of the above sea level part of the icesheet as its underlying support structure is melted away, raising sea levels more abruptly?
Yes William I agree the additional sea level to coast lines away from the Antarctica and Greenland icesheets melt and stop pulling water towards themselves is a worry. 1m of additional seawater volume melted from the icesheets doesn’t mean a local sea level rise will be anything like 1m and there will even be falls in sea level in areas around Greenland and Antarctica as a result.
Also over the longer term the depressions the icesheets are sitting in, are going to flatten out again as the immense weight of the icesheet are removed. This now sunken ground wasn’t below sea level when the ice started accumulating, it was that the weight of the icesheet as the ice accumulated that sank the ground it sat on and thus formed the below sea level hollow the seabed grounded icesheets currently sit in. I do wonder what the seismic consequences of a rapid melt will be; what does the rate of removal of the weight of an ice sheet have an effect on the seismic response? Quick removal sudden larger seismic events slow removal slow adjustments?
ranyl #20
If you're interested in the effects of sea ice melt, there was some discussion on John Hartz's Weekly Roundup 11a. The relevant portion starts at about Comment # 11.
cheers bill f
sgbotsford #10
"Education please:"
I'm afraid that I honestly don't know how to take your comment, as there are at least two diametrically opposed interpretations.
Interpretation 1) It could be taken as someone simply saying ... "I don't believe it's possible to make such measurements, and here's some throwaway remarks as a form of justification", or, in its more basic form "I don't understand that, therefore nobody can understand that, therefore it ain't true".
If that's the case, there's no point trying to respond beyond what Tom C and CBD have already said.
Interpretation 2) On the other hand, your question could be entirely genuine, and I could be utterly misreading the tone of your remarks. In which case, please ignore Interpretation (1), and read on ...
If you want to see some introductory stuff about the measurement of sea level, a very simple starter would be this article in National Geographic. In addition, there is a reasonable Wikipedia article on Sea Level which discusses some of the points you make. Both articles make reference to the 19-year Metonic cycle, by which you can easily grasp that sea level measurement takes time - lots of it!
At a somewhat more advanced level, you could try ploughing through the voluminous material produced by the Permanent Service for Mean Sea Level. The PSMSL is part of the UK's National Oceanograhy Centre in Liverpool.
The link provided takes you to their sea level training page. From there, you can access some very detailed material. For example, Vol 1 of the training manual goes to about 60 pages - before the Appendicies.
cheers bill f
It seems that the comments and the original article are missing the most striking aspect of the graph. The graph looks like a heavily damped system with a relatively weak forcing acting on it. However in the last few years the impact of the forcing has had a much bigger effect causing bigger fluctuations in the SLR. Classically this could be because of two things: the damping has decreased or the forcing has increased. Since I assume the damping comes mainly from the sheer size of the oceans which hasn't changed the change in behaviour must be caused by an increase in the forcing. The article implies that El Nino/La Nina has a large role to play but the current fluctuation is much bigger than that of the 'super' El Nino of 1998. So is what is currently going on bigger than 1998 or is another factor adding to the forcing? e.g. El Nino conditions cause more ice melt?
ranyl @19, sorry for the delayed response.
I now get were you are coming from, and yes, the undercutting of grounded ice shelves by warm water at the base of the ice shelf will initially reduce the volume of water and hence promote a fall in sea level. That is due not only to the relative densities, but because the excess water above the undercut remains supported structurally by the grounding of the ice. When the undercut is sufficient, however, that structuraly integrity will be lost, with the result of an overall increase in sea level.
Having accepted that, however, I will point out that most ice shelves are actually floating (as with the Ross Ice Shelf as illustrated below), so that this mechanism does not apply. melt of the underside of a floating ice shelf will result in the ice riding lower on the water, with an overall slight rise in sea level. Because of that, and because the collapse of the ice shelf will progress more or less continuously with melt back even of grounded ice sheets, I do not think the mechanism you indicate will be important, and will always be outweighed by other effects.
You are correct that the reduced volume of the water once melted at the grounding line will draw in more warm water. Further, the newly melted water will be bouyant because less dense then the salt water. Consequently it will rise away from the melt point, thus drawing in more warm water. I suspect that this, by volume, is the larger effect, and is certainly the mechanism discussed in popular explanations by the experts, however, the mechanism you describe will also operate.
Finally, I do not think this will result in sudden jumps in sea level rise, primarilly because the total effect is so small.
anthropocene @22, the impression of increased amplitude of fluctuation arises almost entirely from the reduction in sea level associated with the 2011/12 La Nina. By one measure, that is the strongest La Nina event in on record (for a record going back 130 years). It is also a single event. I would wait a few years to see whether or not it is an aberration or signals the start of greater osscillations before drawing any conclusions about the damping.
Sorry if the image is too big,
http://cdn.antarcticglaciers.org/wp-content/uploads/2013/07/PIG.ai_.jpg
Thanks Tom,
I agree the ice shelf is definately floating and supporting the icesheet edges.
Looking at the line 3 on this graphic, (present day), it seems that the domed bit above the water line is not floating and is still suported by the ice pillar below, which is looking more and more eaten into.
If the weight of that domed above sea level supported part of the icesheet became such that the water in the cavern and the ice column couldn't support it anymore (the pillar is shrinking and I think the icesheet is gaining weight due to regional warming induced more snow). I know it is only a graphic but on this one more but on yours as well I can imagine a reasonable sized section of above sea level icesheet sort breaking off, and I think those icesheets hold quite alot of ice, up to a 1m Pine Island I think, so I do wonder if a couple of cm's of sealevel rise worth could snap fall off from time to time as the below sealevel WAIS icesheet melts away?
Not sure about the whole topography however thankfully looking at your graphic (23), the undermining may only come from one side, unless that is just a matter of section?
Not sure about the topography of the EAIS marine based glaceirs that are melting and the icesheets there, but they are being under eroded below the sea as well. And I think these basins and similair basins in Greenland are quite big, and are several kilometers deep, so the Ice replacement effect might be putting a very small brake on apparent sea level rise, but might be masking some melt.
I've not read an estimation of the amount or volume of underwater ice being melted on the marine based icesheets and glaciers, just overall icesheet and glacial loses and therefore I don't have any feel for the sieze of the effect, but it will increase as the melting accelerates?
ranyl @25, that image is very schematic. A more detailed image is avialable from Nature:
As you can see from the third panel, by "thinning" they mean the reduction of the domed section. That is a direct consequence of the faster flow, which in turn is a consequence of the reduction in the extent of the floating ice shelf along with the retreating grounding line. Because the Pine Island Glacier is in fact a glacier, it will be transversed by a large number of crevases meaning structural support of the ice beyond the grounding line will be virtually non existent, ie, virtually all ice beyond the grounding line will be floating ice.
As to sudden increases, it was calculated by Noerdlinger and Brower that "If all the extant sea ice and floating shelf ice melted, the global sea level would rise about 4 cm." Clearly not all of the floating ice will melt in a year, or even 50 years. Ergo "sudden increases" from the collapse of ice shelves are unlikely to contribute more than a millimetre or two to sea level rise in any given year, and probably not even that. For comparison, Shepherd et al calculate a 0.49 mm contribution to sea level rise from the melting of floating ice from 1994-2004. That comes from a reduction "...that exceeds considerably the reduction in grounded ice over the same period", something we would expect to continue.
Underground water is roughly equal to the water content in the cryosphere. If we have drawn 65 km3 from 2004 to 2013, then India, China, Arabia, Brazil, Argentina, Australia, and central Asia, probably have overdrawn a ground water by similar figures. At 65 km3 by each area, that only accounts for 1 mm of SLR.
Somehow it seems that this figure is under-considered, and thus under-estimated. If the potential contribution from ground water is equal to the cryosphere, and we have been sucking on that tit as hard as on the fossil fuels, then it might be that there is a lot more SLR that has to be accounted for. Thus, this “spike” might not be an anomaly, but what it looks like; a real rise in sea level.
Pluvial.
There is another aspect to consider. We have also increased our above ground water storage, our empoundment. I don't have the figures to hand (maybe someone else can find them) but I seem to recall that a study found that the depletion of groundwater is , seredipitously, roughly balanced by the increase in above ground water storage in dams etc.
Another factor to consider. Although we aren't in much of an El Nino at present we have had 'the El Nino you are having when you aren't having an El Nino' for some time now. This might be a factor.
Look at Figure 1 in the post, around 1997/98 when the big El Nino happened. Sea level spiked up for the opposite reason to the drop in 2011. Maybe an El Nino-lite is contributing to current SLR.
Also, we have had high sea surface temperatures in the north Pacific recently. If this reflects recent heating of the upper levels of the ocean there this might be a factor. The Coefficient of Thermal Expansion for water varies significantly with temperature. Warming already warm water produces greater expansion (which we would see as SLR) than warming cold water by the same amount.
Thanks Tom,
I never thought iceshelf per se collapse would cause a sea level rise for sure, th ebreak up of the above sea level icesheet itself.
The natrue image is quite schematic also mind :), and the line number 3 in the Antartica Glaciers image does seem to show quite a hollow developing, as for Icesheet section break up due to undermining, it is all going to depend on the rate of underwater melt, the slope of dropoff and the rate thinning on top.
Overall however do still the potential for sudden icesheet edge instability due to undermining. Looking at the topography here past the GL point is melting at bottom, still do wonder about an undermined column scenario?
And looking at Thwaites, past that 150km ridge and it looks like a steep column again, with a very thick above sea level icesheet.
Anyway can't help suspecting that the melting of these seabed grounded icesheets is going to be interesting to watch, full of little surprises and is an accelerating situation as things aren't going to cool down anytime soon.
OK...now NOAA is officially categorizing this as an El Nino period...by the skin of it's equatorial teeth.
What is more interesting is that the Equatorial heat content has risen now to a level similar to that seen last year. NOAAs says there is a greater than even chance the El Nino holds through the summer. In fact, this uncertainty reflects a strong split between statistical models, which suggest a return to neutral conditions, and dynamic models, which generally predict emergence of strong El Nino conditions late spring to early summer.