


 Arguments


A Buoy-Only Sea Surface Temperature Record Supports NOAA’s Adjustments
Posted on 27 November 2015 by Kevin C
This is an update of an update of an article which originally appeared at Climate Etc. The authors are grateful for the helpful comments which have informed the updates.
By Zeke Hausfather and Kevin Cowtan
Significant recent media and political attention has been focused on the new NOAA temperature record, which shows considerably more warming than their prior record during the period from 1998 to present. The main factor behind these changes is the correction in ocean temperatures to account for the transition from ship engine room intake measurement to buoy-based measurements and a calibration of differences across ships using nighttime marine air temperatures (NMAT). Here we seek to evaluate the changes to the NOAA ocean temperature record by constructing a new buoy-only sea surface temperature record. We find that a record using only buoys (and requiring no adjustments) is effectively identical in trend to the new NOAA record and significantly higher than the old one.
The changes to the prior NOAA global land/ocean temperature series are shown in Figure 1. There are some large changes in the 1930s that are interesting but have little impact on century-scale trends. The new NOAA record also increases temperatures in recent years, resulting a in a record where the period subsequent to 1998 has a trend identical to the period from 1950-1997 (and giving rise to the common claim that the paper was “busting” the recent slowdown in warming).
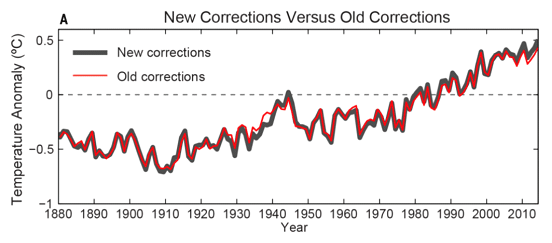
Figure 1: New and old homogenized global land/ocean records from Karl et al, 2015.
The paper that presented the revised record, Karl et al, didn’t actually do much that was new. Rather, they put together two previously published records: an update to the NOAA sea surface temperature record (called ERSST) from version 3 to version 4, and the incorporation of a new land record from the International Surface Temperature Initiative (ISTI) that makes use of around 32,000 land stations rather than the 7,000 or so GHCN-Monthly stations previously utilized. The new land record is quite similar to that produced by Berkeley Earth, though it has relatively little impact on the temperature trend vis-à-vis the old land record, particularly during the recent 1998-present period.
The slowdown-busting nature of the Karl et al paper relies almost entirely on the update from ERSST v3b to v4. During the post 1998 period, this is primarily due to a revised treatment of buoys and ship engine room intake (ERI) measurements and an improved calibration of differences across ships. During the past few decades the number of automated SST measurement buoys has expanded rapidly from effectively zero before 1980 to over 70 percent of all SST measurements today as shown in the figure below. Buoys are appealing measurement platforms, as they are not restricted to shipping routes and often have fully automated reporting via satellite uplink.
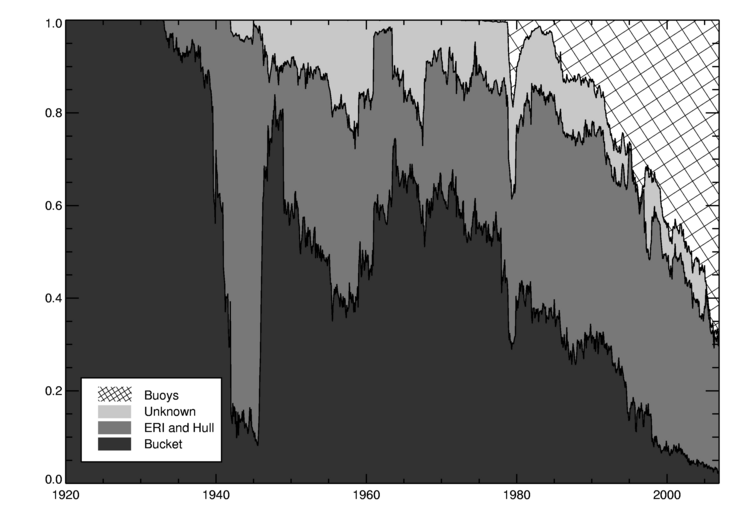 Figure 2: Share of SST observations by instrument type from Kennedy et al 2011. Note that this figure ends in 2006; since then buoys have continued to grow in observation share.
NOAA argues that the transition to buoys introduced a spurious cooling bias into the record. ERIs tend to warm the water a bit before measuring it (ship engine rooms being rather hot), whereas buoys do not. They identify a bias of around 0.1 C between buoys and ERIs and remove it by adjusting buoy records up to match ERI records in ERSST v4, as well as use NMAT readings to calibrate the differences across ships. These adjustments had not been done in the prior ERSST v3b. As an aside, the decision to adjust buoys up to ERIs or ERIs down to buoys should nominally be trend neutral. Indeed, in their work on HadSST3 Kennedy and colleagues explicitly tested this, and found “no appreciable difference” on trends.
However, there is a rather straightforward way for us to test if the adjustments done in ERSST v4 are proper or not: compare their adjusted record to a record made only from buoys. The buoy records are from purpose built instruments which are largely standardized, resulting in much more homogeneous record [details]. On the other hand, the buoy record is short, and has limited coverage in the early 90's.
The buoy-only record is prepared by calculating daily averages for each buoy. Buoys which show a large daily temperature variation are rejected: in deep water the daily temperature range is only a few tenths of a degree, but in very shallow water it can be substantial which presents problems when some data are missing. Next, the daily data are placed into 550 x550km equal area grid cells based on the location of the buoy for that day, and monthly averages are determined for each cell.
The resulting coverage is still limited and so produces a biased estimate of global sea surface temperature. To produce a useful comparison to ERSST, we therefore reduce the coverage of the ERSST datasets to match the buoy dataset (now using a fine 1 degree grid for all the data) and then calculate anomalies for all the datasets using a 2001-2010 baseline. The area weighted mean temperature is then calculated for each record. While this doesn't provide a very good estimate of global SST, it does allow a strict like-with-like comparison against ERSST over the regions where the buoys have coverage. The percent of global ocean covered by buoy measurements varies from around 40% in the mid 1990s to around 70% in recent years.
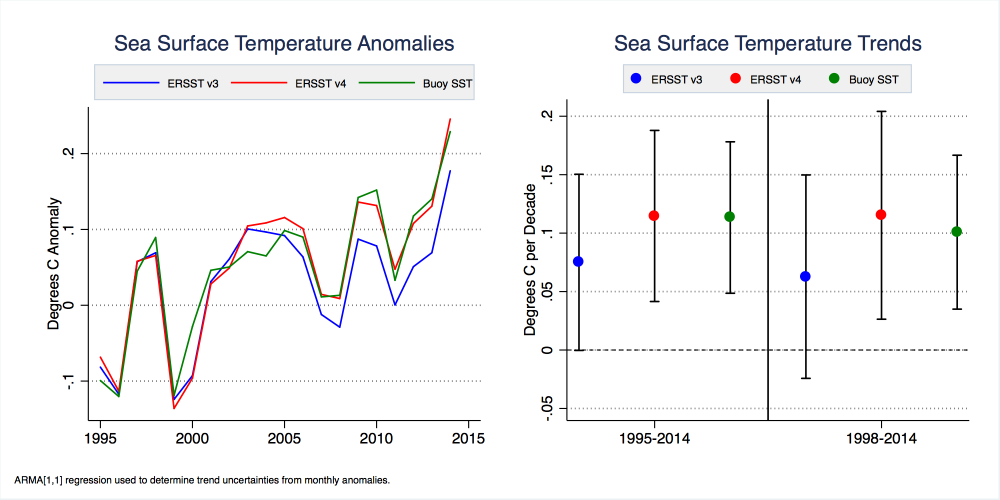
Figure 3: ERSST v3b, v4, and Buoy-Only SST anomalies and trends from 1995 through the end of 2014. The trend periods shown are the full record (1995-2014) and the “hiatus” period (1998-2014). 2015 is excluded as the year is incomplete, and the period prior to 1995 is excluded due to limited buoy coverage. The anomaly graph is baselined to 1995-2005 to show the time-evolution of differences.
As shown in Figure 3, a buoy-only record is quite similar to the ERSST v4 but shows statistically significantly more warming than ERSST v3b during the period from 1995 through the end of 2014 (p < 0.05 trend in the differences). This suggests that ERSST v3b suffered a cooling bias when blending buoy and ship records that is properly corrected in ERSST v4, at least for the areas where both ship and buoy records are available. Because the buoy record is relatively homogenous and requires no adjustments, it provides a good check in the validity of the combined ship-buoy series when normalized for spatial coverage.
In addition to the buoy-only dataset, we can also examine data from ARGO floats (which are not included in our buoy dataset). The ARGO floats have fairly good spatial coverage over the period since 2005. They are primarily intended to measure deep ocean temperatures, but also measure sea surface temperatures during their ascent from the depths to the surface. NOAA provides another sea surface dataset called OISST, which includes data from ships, buoys, and satellites. There are two versions of OISST: a daily version which is newer and includes adjustments to account for the transition from ships to buoys, and a weekly version which does not include this correction. Figure 4 shows how both the ARGO record and daily OISST record compare to ERSST v3b, v4, and our new buoy-only record when spatial coverage is normalized across all records.
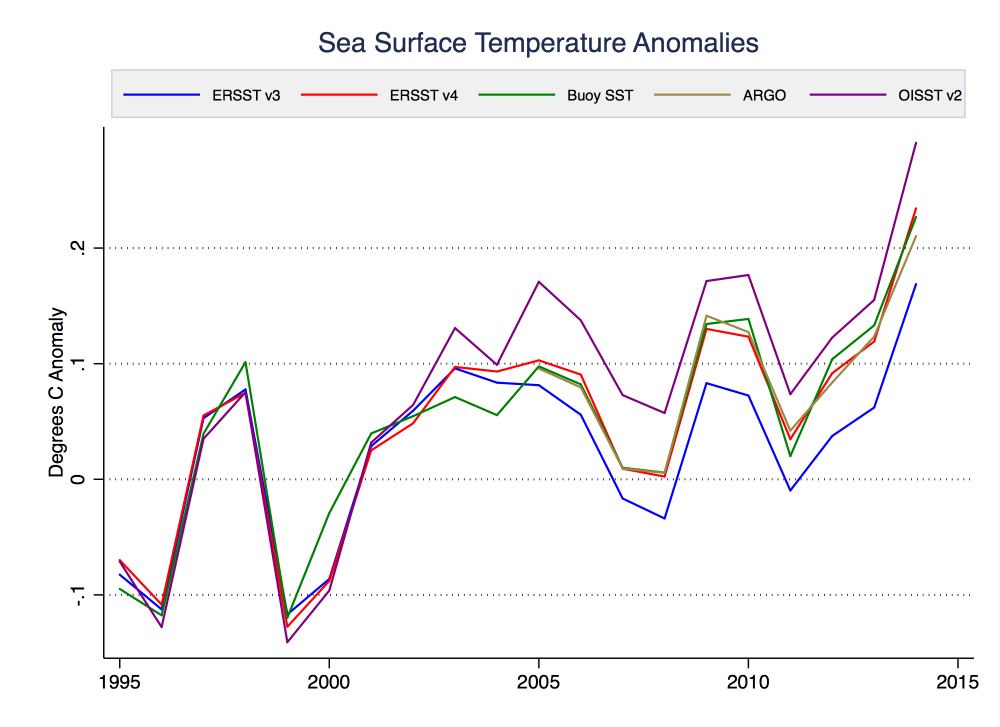
Figure 4: ERSST v3b, v4, and buoy-only, ARGO, and OISST SST anomalies from 1995 through the end of 2014. The anomalies shown are relative to a 1995-2005 period; the ARGO record is too short for this baseline and instead is matched to the buoy-only record during the period of overlap.
Over the period from 2005 to 2014, ARGO buoys show statistically significantly more warming than ERSST v3b (p < 0.05 using an ARMA[1,1] model), but indistinguishable from ERSST v4 or the buoy-only record. Similarly, OISST has the highest trend of all series over the 1995-2014 period. The trends of all series over these two periods are shown in Figure 5.
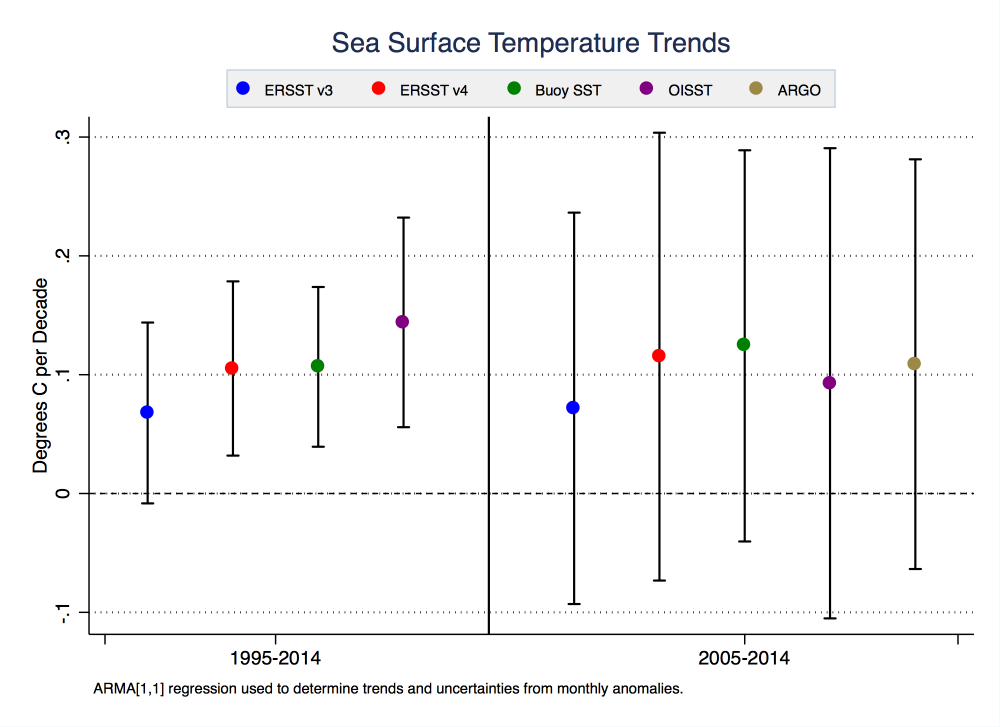
Figure 5: ERSST v3b, v4, and buoy-only, ARGO, and OISST SST trends from 1995-2014 and 2005-2014. The latter period is chosen to compare ARGO to other records, as the ARGO record does not have sufficient coverage prior to 2005. Confidence intervals are calculated using an ARMA[1,1] model to account for autocorrelation. Note: the confidence intervals indicate the uncertainty in the trends, which is dominated by interannual variability. The uncertainty in the trend in the differences is much lower, leading to a statistically significant difference between the buoys and ERSSTv3b.
The ship records are important because they form the foundation for a long sea surface temperature record, but they require careful calibration. The differences between HadSST3 and ERSSTv4 suggest that the finer details of the ship record are not yet settled, and as a result care is required especially when considering short term trends. However the buoy data, ARGO floats, and daily OISST record all support the NOAA claim that ERSSTv3b suffered a significant cool bias over recent years arising from inhomogeneities in the ship record and the increasing use of buoys.
Code for downloading and processing the data for this analysis is available here: http://www.ysbl.york.ac.uk/~cowtan/data/buoy.zip. While the code and data are only 18 MB, the (optional) raw buoy data are approximately 44 GB. Gridded 1x1 files are also provided for buoy, ERSSTv3b, and ERSSTv4 data.


A big thank you to you both, Zeke and Kevin. This is really useful and not a surprise, given the work I know went into preparing ERSSTv4. I like it that you've now included a comparison with Argo data, which contradicts what some people have been claiming. I'll be referencing this article from time to time.
I am not an expert at any of this by any means, but I do have a few questions, and I don't know where to turn to get answers. If there is a place they are already addressed, either on this site or another, I'd be appreciative of a link. Otherwise, perhaps someone here can help me.
1) Let's leave asside the issue of global warming and the hiatus for a moment. Recent SST data is dominated by buoys during the period in question, from maybe 50% (estimate from graph in article above) to 90% by 2014, see Huang). Moreover the buoys have received higher weighting in ERSST4 (see Karl), making buoy data even more dominant. So is it any surprise that ERSST4 would correlate fairly well with buoy only data, since that's mostly what it's comprised of?
If we are interested in verifying Huang's adjustments (used by Karl), and since these adjustments are to ship temperatures (yes, I know about the buoys being adjusted, but it amounts to the same thing), wouldn't it be more illuminating to compare the buoy record to ERSST4's ship only adjusted record for the time period in question? It seems that would be a better indication of whether the adjustments did their job.
I understand the emphasis on the trend slope, given the hiatus thing. But if the concern is with the veracity of the adjustments, then simply showing that the slope of the trends is similar doesn't really say anything about the correlation over time. After all, two completely unrelated time series can still have the same trend. I haven't seen a graph of ERSST4 vs. the buoy only trend, or any correlation analysis. Has this been done?
2) Why weren't the buoy adjustments taken into consideration from the beginning, rather than waiting until ERSST4? It seems to me that any time you have 2 streams of data from different sources, you must compensate for any systematic bias by normalizing the data. In this case, as soon as buoy data was introduced, shouldn't this have been done?
It might be argued that originally there wasn't enough data to make this adjustment. Wouldn't that impy that the buoy data should have been excluded until enough data was gathered to make that adjustment, rather than introducing "artifacts of data" (Karl's words)? Look at the obvious negative consequence brought about by not being prudent in this matter.
Here's the point: If I'm to be convinced about global warming, I will have to trust and rely on NOAA and the rest of the scientific community, since I can't possibly investigate everything myself. When I see what appears to be a grave lapse of judgement (methodology?), doubt creeps into my mind.
Am I being overly critical of NOAA on this? I'm not a scientist, so I realize that I'm not really in a position to judge this objectively, which is why I pose the question. This is a genuine concern for me.
3) According to Karl, about 1/4 of the change in "hiatus" trend resulted from additional weighting given to buoys. I have looked through Huang and I don't see much explanation. Is there an explanation in Karl's supplemental materials, maybe? I'd like to get a better understanding of what was done and how it was justified.
--------------------
I also have questions about the ship bucket adjustment. I think I'll save those for another post.
P.S. This is my first post. I have read the comments policy, and I think I have followed it, but since I am a novice at this site, if I have done something wrong, please be gentle with me.
Fortunately, AGW doesn't rely solely on buoy data. Multiple lines of converging, consilient empirical data exist confirming AGW.
Greetings Daniel B
I'm trying to understand the science and methodologies behind AGW science, so I can make my own informed decision, to the extent possible. I'm happy for you that you've already made that journey.
I don't think I made any claim about AGW one way or the other. You may be right about the converging consilient empirical data confirming AGW, but I have to start somewhere. So I want to understand the NOAA data, especially given all the fuss over the hiatus.
Since the NOAA data will undoubtedly be used as the basis for countless papers, it seems to me worth looking into whether the latest adjustments are valid or not, and whether NOAA has done a good job in general in this area. I think that was the point of the article, and that was what I was hoping to address with my questions.
My mistake: On 05:51 AM on 29 December, 2015 I said "I haven't seen a graph of ERSST4 vs. the buoy only trend". Now that I reread the article, this is no longer true, since the article clearly contains such graphs.
@ Dazed And Confused ( #2, #4 ),
Good to skeptical about the methodology of buoy data.
Less good, to be tempted to focus only on the buoy data. As Daniel Bailey says, there is a huge amount of evidence confirming AGW. ( And almost nothing "unconfirming". )
Stand back and look at the bigger picture. Owing to the (GHG-caused) continuous nett inflow of heat energy into the planet, there is no reason to expect any real "hiatus" whatsoever. [ hiatus used in the proper sense : of slow-down or reversal of warming ]
The ocean is vastly important, as the major heat sink of the global warming process . . . and we have no reason (and no hypotheses) that would lead us to believe that it is not warming. If buoy data should fail to confirm "the expected", then we should be very much skeptical about the buoys and their associated methodology of data collection.
@Eclectic - Greetings
I understand there is a great deal of evidence involved. Just this past week I had the pleasure of meeting a climatologist who has published several papers regarding the warming of fresh water lakes. She was even gracious enough to give me a quick tutorial on the subject.
I agree with you that one set of data isn't the deciding factor. If it turned out that the ERSST4 data was completely bogus, for example, it wouldn't mean that AGW wasn't true, for bad data has no bearing on the truth.
For someone like me, who is new to the game, there is so much hype that it's hard to know who to trust. Therefore, I decided to have a look at the science and methodology involved to the extent I can understand it.
Hopefully, someone more knowledgable than me can address my questions. It seems to me there are some questionable aspects to Karl's adjustments, but I'm perfectly willing to chalk it up to my own ignorance. I'm hoping someone on this site can set me straight.
dazed and confused - IMO the post by Zeke and Kevin does a great job of explaining the issues here. Engine room intakes (ERI) warm the water slightly before it is measured thus, as ERI sampling has changed from a major to minor source of SST data (figure 2), they were likely to introduce a spurious cooling bias. The buoy only reconstruction supports the new version 4 of NOAA's ERSST (figures 3 & 4).
What legitimate basis is there for suspecting that the thermometers aboard the buoys are introducing a spurious trend?
As for the so-called pause, that's dead and buried. The continued warming of sea surface temperatures is consistent with the ongoing build-up of heat in the ocean (some 93% of global warming). That's why, as others have pointed out, it's useful to look at the 'bigger picture'. The scientific evidence is consilient. The warming sea surface temperatures are consistent with the recorded warming of the land surface and warming of the atmosphere. For the subsurface ocean to continue warming as it has, in the background context of a cooling sun over the last four decades, the atmosphere has to warm and direct more downwelling longwave radiation back toward the sea surface. Doing so lowers the thermal gradient through the cool-skin layer and traps more heat in the ocean.
How can there be a pause in warming when the oceans continue to rise as fast as they have? With thermal expansion of seawater and the addition of meltwater showing no signs of slowing down, atmospheric water vapour continuing to increase, heatwaves becoming more frequent and severe, how can anybody take claims of a pause seriously?
Allow me to try again. The title of this article is "A Buoy-Only Sea Surface Temperature Record Supports NOAA’s Adjustments". The title doesn't mention the hiatus, and it doesn't mention AGW, although certainly it will have a bearing on those issues. While I appreciate the responses, it seems that they are off topic, since the hiatus and the data supporting AGW are already discussed in the main arguments of this site, and are not the main topic of this article.
I believe that my point is on topic. I am claiming that this study does not do what the title states.
I'll try again to make my case:
The adjustments that were made to the NOAA data of interest were to the ERSST. Two of the three were essentially adjustments to ship data. (The other was an extra weighting given to buoy data that affected the trend much less than the other two). In order to determine if these adjustments are valid, it would be desirable to check the adjusted ship values against some other data. The best "other" data available, I would concede, is the buoy data.
Unfortunately, this study doesn't make that comparison. Intsead, it compares ERSST4 : buoy data. Essentially, this is comparing (buoy data + ship data) : buoy data. The buoy data composes 50% (beginning) - 90% (ending) of the ERSST4 data during the period in question, and is given some additional weight that I have been unable to determine from the literature (probably I haven't looked hard enough). The fact that the slope of the trends is similar isn't suprising. The buoy data contained in ERSST4 will obviously correspond very nicely with the buoy data, and will tend to mitigate any affect the adjustments to ship data cause.
In fact, what I'd expect is that in the near present, the ERSST4 data would coincide almost completely with the buoy data, since ERSST4 is made up of 90% + weight of the buoy data. There would be less convergence in the past, since the earlier data is more dependant on ship data. Looking at figure 4 from the article, this seems like that might be the case.
Of course, eyeballing a graph is not determinitive. If Hausfather and Cowtan are interested in whether the ship adjustments (the only ones of significance going form ERSST3b to ERSST4) were valid, why not run buoy vs. ship data? Doing some correlation analysis would seem to also be appropriate, since the trend itself isn't the whole story. Perhaps that analysis will support the ship adjustments, but it would be nice to know.
In fact, this analysis has been done on buoy data vs. unadjusted ship data, and is the input to the famous buoy adjustment. In a paper referenced by the ERSST4 paper in the Journal of Climate (do I need to site this?), Reynolds et al* looked at this. They produced a table indicating that the adjustment for 1989-97 is -.14C, while 1998-2006 is -.12C. (I would reproduce the small table here, but for the life of me I can't get the insert table thing to work, it always puts the table at the top of the comment, but I have given the data it contains).
In our context, it is noteworthy what Reynolds et al say after they produce this table: "These results strongly suggest that a spatial and temporal constant bias correction is needed for ship SSTs. Furthermore, finer space and time corrections do not seem to be possible with the limited in situ data available.[my emphasis]"
For the period 1998-2006, at least, according to Reynolds, producing more than a single number indicating correlation between ship data and buoy data, while desirable, isn't possible. Obviously from the above graph and article, Hausfather and Cowtan claim to have coaxed out a much finer comparison. Given Reynolds credentials, is there some reason to believe Hausfather and Cowtan instead?
* R.W. Reynolds, C. L. Gentemann, and G. K. Corlett, 2010: Evaluation of
AATSR and TMI satellite SST data. J. Climate, 23, 152–165,
doi:10.1175/2009JCLI3252.1.
[RH] Resized image that was breaking page formatting. Please keep images down to 500px.
If you consider the 'pause' to be off-topic, why did you bring it up? When we examine other data sets, especially ocean heat content and corresponding sea level rise (see below), we see that the 'pause' is simply wishful thinking by those that cannot accept the observations.
In trying to answer my own question regarding Reynolds vs. Hausfather and Cowtan above, I went to try to find the peer reviewed paper in question.
Imagine my surprise when I find that the initial article was published on a blog!
If I go too far, then forgive me. Hopefully you can show me the error in my thinking, rather than kicking me.
In the Updated comments policy, it states (correctly, IMHO), "...we believe the only genuine debate on the science of global warming is that which occurs in the scientific literature,...".
This article is clearly describing new science and making claims based on that science. What's it doing on this site?
I have seen mod warnings given to commentors who cite their own blog. I don't see how this is any different.
I understand that this isn't my site, and that the operators can post whatever they please without having to justify their decisions, either to me or anyone else.
However, if you want to claim impartiallity, and a dedication to the science, IMHO it seems hypocritical to put up an article that makes scientific claims without peer review. Apparently, the article has been updated based on comments on the site. Is this an attempt to do peer-review apart from the scientific literature?
Do you have any non-peer reviewed contrarion articles on this site? If I write one (I'm not a contrarion, so this is hypothetical), would you post it, if I had some graphs and links to programs I wrote?
I understand that you are trying to help Hausfather and Cowtan make their article better, and that isn't my gripe. However, from your link, and the title, it seems as though this is established fact, when nothing could be further from the truth.
At least, put a big warning across the top that says something like "CAUTION: Unconfirmed, non-peer reviewed material presented for your consideration". I wasted a lot of time trying to show the problems with this article, only to find the article is irrelevant.
[PS] If there were genuine doubts/debate about Karl et l published in the peer-reviewed literature, then this work would definitely be sent to a journal. However, the real scientists have little time for suggestions that they are involved in a global conspiracy to create fake warming by invalid adjustments. Skeptical science has published and reprinted many articles/analyses to expose the falseness of pseudo-skeptic positions and will continue to do so. This in no way contradicts our position on where genuine debate occurs. If the contrarians have a real argument, then they should publish but mostly they are only interested in fooling the unskeptical or themselves.
Recent warnings about links to blogs, were for repeat offender, using comments to advertise their own blog rather than genuine engagement with conversation.
@Rob Painting
I don't think I brought up the pause. In fact, I said, "Let's leave asside the issue of global warming and the hiatus for a moment." (See 2).
Again, this article is about whether NOAA's adjustments are supported by the buoy data. So far, no one has answered my questions regarding that. Telling me that there wasn't a pause or that AGW is a known fact doesn't address the topic.
dazed and confused @ 2
To answer your question "Why weren't the buoy adjustments taken into consideration from the beginning, rather than waiting until ERSST4?" The documentation for ERSST3 (referenced here)states:
"Since the 1980s the SST in most areas has been warming. The increasing negative bias due to the increase in buoys tends to reduce this recent warming. This change in observations makes the in situ temperatures up to about 0.1°C cooler than they would be without bias. At present, methods for removing the ship–buoy bias are being developed and tested."
dazed and confused @ 2
To answer your question "Why weren't the buoy adjustments taken into consideration from the beginning, rather than waiting until ERSST4?"
The documentation for ERSST3 (referenced here) states:
"Since the 1980s the SST in most areas has been warming. The increasing negative bias due to the increase in buoys tends to reduce this recent warming. This change in observations makes the in situ temperatures up to about 0.1°C cooler than they would be without bias. At present, methods for removing the ship–buoy bias are being developed and tested." (emphasis added)
@Moderator
Thank you for taking the time to respond.
I hope that nothing I said implied that I'm suggesting anything about a global conspiracy or the like. I also have made no claims about AGW or the "pause". I was interested in the science behind this article and the NOAA adjustments.
I assume you're busy, and you can run your site how you like, so you don't need to read this or respond, but I hope you will.
If there are no doubts about Karl et al, then what is the point of this article? Even given that Karl et al are spot on, this says nothing about the validity of the methodology or claims of this article.
I can go on contrarion sites and find non-peer reviewed articles stating all kinds of things. I am trying to find the truth. Should I be convinced based on non-peer reviewed articles and analysis, whether they are yours or theirs? If your articles aren't aimed at a guy like me, who are they for?
May I ask how you decide which articles/analyses you publish on your site? Do you ever publish opposing points of view?
A well-known skeptic, Judith Curry, published this very article on her site (If you want a link, I can give it, but I don't want to appear to be advertising). Given who likely reads her site, she even says, "Since this is a guest post, please keep your comments relevant and civil." I'm sure this wasn't her favorite article, but to her credit she posted it anyway.
I don't mean to be wasting your time. I am looking for a site that doesn't have an agenda, where questions about science can be raised, and hopefully answered. I am hoping that this is such a site.
[PS] I am but one of many moderators and a junior one at that, but it would appear most are away. Sadly too Zeke and Kevin who would be the ones to respond to points.
So far there have been no doubts expressed about Karl in the science literature, and hence no need to publish the article there. Pseudo-skeptics scream about any adjustment unless it lowers temperature (hence the term pseudo-skeptic) so I believe the article was targeted at them, and deliberately published on contrarian site which to her credit she published. We are actually fine with links to source of information or misinformation but, yes, if it isnt published in peer review, then take with grain of salt, including this. Our normal response to pseudo-skeptics is to point to the peer-reviewed literature, but in this case, that would Karl et al anyway.
The particular objection to linking, to the commentators own blog, you refer to, was considered moderation based on a long term pattern of posting behaviour, and on previous warnings and not a knee-jerk reaction. It was not so much a breach of comments policy but a sustained breach of good manners.
This site does have an agenda - to debunk myths put up by pseudo-skeptics by pointing to actual science. We arent so much pro-AGW as pro-science. If there was actual science supporting contrarian views, then your point would be more valid.
I hope Zeke and Kevin will respond to your questions, but please note that discussion of moderation is always offtopic.
@davidsanger
Thanks for the info. I appreciate the link to ERSST3, as I haven't looked into that yet. I will be especially interested to see how they attempted to handle satellite data, which I understand was removed from 3b.
Given that there were known issues with the ship-buoy bias, does it make sense that they included the buoy data anyway in ERSST3 and 3b? Why not wait until they have developed the methodology to remove the bias? Isn't that just going to cause "data artifacts" that will become unnecessary points of contention? Also, why did it take until ERSST3 to notice this?
Does anyone else have a problem with this, or am I just way off base?
[PS} perhaps because in real world, you have to make the best of what data and methods you have at the time because the products have other uses besides examination of temperature trends. Meeting the impossible standards of pseudo-skeptics who have nothing better offer is not a realistic science goal.
dazed & confused "I don't think I brought up the pause."
And yet, as you pointed out subsequently, you did. It was likely an attempt to introduce a contrarian talking point into the conversation, but has back-fired spectacularly. It's not you again is it James?
@Rob Painting
I only mention the hiatus to say I didn't want to consider it. If I have somehow sinned in this, then mia culpa.
I was not trying to bring the pause, or AGW, or anything else, into the discussion. If I inadvertantly did, then I apologize. Please believe that this wasn't my intent.
Rather, I was hoping to illicit responses like the ones from davidsanger and the mod in 16 that addressed my specific questions.
@moderator
First, I appreciate your patience with me.
I would also like to make it clear that I have no issue with the ship-buoy adjustment itself, it seems perfectly reasonable to me. My concern is that data without this adjustment should not have been published, especially considering that there were alternatives.
You said, "perhaps because in real world, you have to make the best of what data and methods you have at the time because the products have other uses besides examination of temperature trends"
What other use does ERSST have than to examine temperature trends? I'm sorry to profess ignorance in this.
What was the rush to publish this data? Wasn't there already ERSST2? I don't know the history of that version; were there major flaws in it that needed to be corrected?
I maintain that publishing data with known major flaws is worse than publishing nothing. This is a major data source for other research, and should be as accurate as possible. If they weren't ready to handle the bias, wouldn't it have been better to omitt the buoy data until they were?
You also said, "Meeting the impossible standards of pseudo-skeptics who have nothing better offer is not a realistic science goal."
Normalizing two time series data streams does not seem to me like an "impossible standard", but best pratice. The final adjustment done by Huang et al was to simply add .12C to the buoy readings. How hard was that?
The .12C adjustment was already known in 2009. See Reynolds* (referenced by Huang in the ERSST4 paper). This would have been in plenty of time for ERSST3b, at least. Why did they wait until 2015 to make this adjustment, when it could have been included in ERSST3b?
* R.W. Reynolds, C. L. Gentemann, and G. K. Corlett, 2010: Evaluation of
AATSR and TMI satellite SST data. J. Climate, 23, 152–165,
doi:10.1175/2009JCLI3252.1.
dazed - "I maintain that publishing data with known major flaws is worse than publishing nothing."
I would have to disagree, if the data with known flaws is published with appropriate caveats. And as David Sanger noted above, it was. Publishing the best data to date, even those with known (and stated) issues that will have to be accounted for, is not only appropriate but in fact the best practice in science - noting known issues leads other researchers to the very topics requiring more work, meanwhile giving everyone the best data currently available.
"Am I being overly critical of NOAA on this?"
IMO - yes. Your concerns appear (in my view) to be quibbling and dismissal, not substantive complaints. There is absolutely no reason not to publish the best data available, nor to publish the best corrections for known issues when they are developed and incorporated.
Dazed & con. ( @19, and earlier ) ,
Perhaps you could be kind enough to expand (and expound) on your concerns about the buoy data issue.
In general, data is what it is [ "are what they are"?! ] , and, as is often the case . . . can benefit from refinement, and from reinterpretation with the added advantage of hindsight. But what is somewhat unclear from your own posts, is your reason for being highly concerned about this particular buoy data issue. Not being privy to your special reason (if you have any special reason, I mean) for intense interest in the case : it seems to me, prima facie that you are addressing a rather small tree in a very large forest of "consilient evidence".
Forgive me if I am mis-interpreting the thrust of your posts : yet you appear to be giving the impression that you are wishing to be oblivious to the overall context of the buoy data.
Rightly of course, the SkS website policy "guides" posters to post exactly on the topic of the particular thread . . . but it would be impossible to have an intelligent discussion of a particular topic, without allowing some latitude in comments. That's not a failing of the website, nor of its "policy". Common sense must guide us in these matters. The website exists [ as I see it ] as a sort of interface between the science and the discussion of science-related issues (with primary emphasis on AGW and the debunking of illogical dogma/myths). Clearly it would be impractical for every sentence or paragraph to be linked to peer-reviewed literature, since such linkage would largely just be re-stating the already-known state of the science. However, it is reasonable to expect that anyone's suggestions (or assertions) contradicting mainstream science, should contain a higher level of "citation". Nothing untoward or unfair about that ~ and it is certainly not an unwarranted "double standard".
Here's an image from the Kennedy et al (2011) paper cited in the original post which compares, in the top panel, ERI (orange line), bucket measurements (blue), buoys (red) and all (blackline) from 1945-2006.
@KR
I appreciate your feedback. You make good points, and you certainly have the right to your opinion. Please allow me the opportunity to persuade you otherwise:
I completely agree when you say, "There is absolutely no reason not to publish the best data available..."
Did ERSST3 and 3b represent the best data available? I argue that they do not. It would have been better to use ship only data.
For the period before buoys became a significant part of the data, it would have made no difference.
For the period afterwards, using buoy data will introduce a known, but unaccounted for, bias. If the difference was negligible, then I'd agree that it didn't matter. But that obviously isn't the case. I base this on 2 observations: first, it was important enough to account for in ERSST4; second, based on Karl's paper, using buoy data without accounting for this bias resulted in an error of 0.014°C / decade in the warming trend from 1998 (his year, not mine). How can that be helpful to anyone?
If you can explain how including the buoy data without accounting for bias is somehow better than using the ship data only, I'll concede this point.
"There is absolutely no reason not to ... publish the best corrections for known issues when they are developed and incorporated."
Also agree. My issue is that this should have been done right away. There was no new theory that needed to be developed. As noted above, within a year after ERSST3 was published, a ship-buoy bias was calculated and published. Incorporating this adjustment involves adding a constant to a set of numbers. Couldn't ERSST3 have waited? At the very least, shouldn't this have been included in ERSST3b? What scientific reason was there for NOAA to wait another five years to make this simple correction?
Even worse, why wasn't this done from the beginning of ERSST? Certainly it doesn't take much to realize that ship and buoy data might be biased with respect to each other. Shouldn't this have been investigated from the start?
I would have to disagree, if the data with known flaws is published with appropriate caveats.
This is a good point.
However, what purpose did it serve to publish this data with "appropriate caveats"? How could anyone justify the use of the data in research, especially if the research involved recent years where the bias resulted in a predictable significant error?
It seems to me that this caveat was ignored by both the scientific community and others on both sides, with bad consequences. Contrarions used it to support there "pause" idea. How much time was wasted on the other side trying to deny or explain it? How many papers were written to explain the pause (apologies to Rob Painting, but I only mention it to show the harm caused by publishing data with known bias errors), and how many said, "this is a preliminary analysis based on data with known bias errors?" I haven't read a great deal of the literature, so I could be wrong.
How many other papers included ERSST3/b or its derivites in other research, and how many mentioned this caveat? Although Karl says that these papers are still valid, I don't see how this would be possible, since presumably they depend on the data in question. This means more wasted time. And as the mod pointed out, scientists don't have time to waste on foolishness.
How many graphs of ERSST3/b data have you seen, and how many have this caveat listed? To the uninformed (anyone who hasn't read ERSST3), it would be easy to overestimate the validity of the data. It seems that would be misleading.
"noting known issues leads other researchers to the very topics requiring more work"
I am familiar with this idea. For example, if you had a model that worked in some cases, but had deficiencies in others, you might publish this in the hopes that either someone might be able to take advantage of some part of the work you did, or that someone might figure out the part you were stuck on. I get it.
However, when you see NOAA in the byline, and you are dealing with one of, if not the, premier historic ocean temperature data sets, in most (all?) cases you are going to use the data without question (see above).
Incidentally, the calcuations for the buoy-ship adjustment were done by NOAA employees closely associated with ERSST. Presumably, they would have done the same work whether ERSST3 was published or not.
@Rob Painting
That's an interesting graph. I'll have to take a look at the context.
I assume that this a rebuttal to my argument based on the quote "These results strongly suggest that a spatial and temporal constant bias correction is needed for ship SSTs. Furthermore, finer space and time corrections do not seem to be possible with the limited in situ data available."
I am arguing that a comparison of ship to buoy data (or more correctly (ship + buoy to buoy) of the detail in the article is not reliable. In their analysis of this question, Kennedy did not use the graph you show. I could speculate as to why, but I see no point.
For some reason, he believed that a different set of calculations was in order. You can see these in the appendix.
I will concede that my argument is not strong. For one, I'm relying on the authority of one paper, albeit from a highly regarded source. Secondly, it could be that there is some reason that Kennedy's reasoning doesn't apply to the article's analysis.
D&C:
The reason for not comparing to the ship-only record is that the ERSST ship only record is not distributed as gridded data, which would be required. You can't draw conclusions from time series graphs alone due to the coverage issue - you need the gridded data. Further a ship only record does not include the ship-buoy transition bias, and so only contains some of the bias.
The work has not been peer-reviewed at this point. However, neither have any of the critiques of ERSSTv4. If you are suggesting that climate science can be critiqued in political events and the media, but that scientists may only respond in the peer-reviewed literature, then the public will be systematically exposed to non-evidence based positions. This is exacerbated by the fact that the media favour political material over scientific material, and tend not to be interested in later followups.
On the other hand, the Argo data are independent of our buoy-only record and are from peer-reviewed work. We also have published all of our code and data for you to review. Finally, Tom Karl of NOAA, who has appropriate expertise in the area, had sufficient confidence in our analysis to show it at AGU:
The differences between ERSSTv4 and HadSST3 are an open question. Before Zeke added the Argo analysis I had no view on which was more realistic for the post-1995 period. With the Argo analysis, I'm leaning towards ERSSTv4 being the better record for this period.
There is one part of your argument which is confusing to me: I think that you are arguing that because the buoys are upweighted in ERSSTv4, it is unsurprising that it shows good agreement to the buoy only record?
In which case you are arguing that ERSSTv4 is already, to a close approximation, a buoy only record for the recent period. I'm fine with that. In which case the NOAA adjustments to the SST record play no significant role in the post-1995 trend, because the buoy records are unadjusted. So there can be no objection to the ERSSTv4 trends being a result of NOAA adjustments.
That's a valid position. Our work is mearly an independent reproduction of the recent record using a rather different methodology which explicitly rather than implicitly excludes any adjustments, and using a minimial implementation (100 lines of code) to allow easier review.
@Eclectic
You ask some good questions. My wife tells me I'm longwinded, so I'm afraid if I answered you in full, I'd fill up this blog. I'll try to be brief. If I don't answer your questions to your satisfaction, let me know, and I'll be happy to go into more detail.
You make two general points. The first has to do with why I am so concerned about a seemingly trivial subject. The second is more or less a rebuttal of my use of the comments policy. I will address each in a different comment.
Comments policy stuff
Going in, I understood that many (all?) on this site will not agree with many of the things I post. To make things worse, I can imagine that many on this site are frustrated from having to dismiss the same old tired arguments from people who don't have the decency to look throught the items in the thermometer before posting.
When I began posting, I got a lot of replies that seemed like knee-jerk responses, which is very understandable: here comes yet another hiatus bozo to deal with. Unfortunately, this didn't help me to address what I believe to be scientific issues. I used the "stay on topic" policy to try to put a stop to those. In hindsight, perhaps I could have thought of a better way to accomplish that. Happily, recent comments have been addressing issues I've raised.
Perhaps I went to far in my criticism of this article being on this site. I was frustrated to find that I had spent a lot of time on what is essentially a blog post.
First, I certainly would expect articles on a site like this that haven't been peer reviewed. Summaries, explaining things in laymens terms, suggesting new ideas, discussing old ones. Sure.
But this article doesn't fall into that category. It is an attempt to prove a point scientifically. That's another matter.
A question for you: What is the purpose of this article? If this website is about preaching to the choir, then post whatever you like. However, I don't think that's the case, or I wouldn't be here. You said, "with primary emphasis on AGW and the debunking of illogical dogma/myths." Good. It seems like this article is an attempt at debunking the hiatus by supporting NOAA's adjustments.
If you want your debunking to convince skeptics like me, or even worse, contrarions, it seems like you'd need more than a blog article, no matter how good the science appears to be. Would you be convinced by a well crafted blog post on a contrarion's site? Perhaps that's unfair, I don't know, but if you care about persuasion, I think you might want to consider what I'm saying.
A claim that runs contrary to the mainstream requires a higher level of proof than otherwise (extra-ordinary claims require extra-ordinary evidence). I don't see why the same should be true of citations. Shouldn't the science be just as rigourous either way?
@ Kevin C
I suppose this may seem odd considering some of my posts, but I feel honored that you responded to my questions.
I came to this site hoping to discuss issues with people who would be able to refute or confirm my ideas based on reason and argument. I could not have hoped for better.
OK, that said, I'd like to respond:
The reason for not comparing to the ship-only record is that the ERSST ship only record is not distributed as gridded data
A justifiable reason for not doing the best science possible is not because it is hard. How did Reynolds do his ship-buoy analysis? Surely there must exist some way to extract/recreate/etc this data.
Further a ship only record does not include the ship-buoy transition bias
What's the issue, you can't add in .13C? Or subtract, which ever way you do it.
I'm not really qualified to give much of an opinion about science-media issues, but that hasn't stopped me before. A couple of problems I see with your approach:
If any self claimed scientist can respond in the media, won't that just produce noise? Wouldn't you have to filter? How would you do that?
Shouldn't more weight be given to a peer reviewed paper than one that was not, even from a prominent scientist? How would you communicate that subtlety via the media?
Incidentally, my problem is not with you writing this paper, but more with this website essentially claiming it is fact. And less of that, if someone like you is willing to explain/defend it.
Good that data and code are available. It might be illuminating for me to take a look.
I'm glad for you that Karl showed your work at AGU. Congratulations, I'm sure that's quite an achievement (I'm not trying to be sarcastic, I mean what I said). Please don't be dissapointed that I'm not impressed from a credentials point of view that Karl decided to show something that verified his work. A hypothetical: if your work did not support NOAA's adjustments, would Karl still have shown it? (Don't feel obliged to speculate).
It is interesting that you mention HadSST3. I have some further problems with the NOAA adjustments concerning the "bucket" bias. It had the biggest impact on the recent data of any of the ERRST4 adjustments. As you probably are aware, the big difference between HadSST3 and ERSST4 is that very adjustment. I'd like to discuss these issues, but I'm not sure this is the corret place on the site for that.
In which case you are arguing that ERSSTv4 is already, to a close approximation, a buoy only record for the recent period.
Somewhat. What I am saying is that to the extent that ERSST4 does approximate the buoy only record, it will tend to correlate well with that record, regardless of what adjustments were made to the ship data. So the fact that you show correlation is not much of a confirmation of the adjustments, which was only done to a small portion of the data.
In which case the NOAA adjustments to the SST record play no significant role in the post-1995 trend, because the buoy records are unadjusted.
This is as wrong as it can be. If it were true, then your work would have nothing to say about confirming NOAA's adjustments. You would simply be comparing buoy data to buoy data, which would tell us nothing about ship adjustments. There have to be some affects of NOAA adjustments in the period of your study for your study to have anything to say about them.
It would be true if the ratio of ship to buoy data points stayed the same for the entire period. However, since this ratio changes significantly from 1995 to the present (~50% to ~90%), the NOAA adjustments will have almost no affect in the present, but a larger affect back in 1995. This is the reason that the buoy adjustment changes the trend during this period. I think I've seen pages on this site that explain it better, but that's the gist. Also explained as far back as ERSST3, as someone on this page has already pointed out.
In fact, according to Karl, the change in trend due to the NOAA adjustement from 1998 is .056 C/decade.
You would simply be comparing buoy data to buoy data, which would tell us nothing about ship adjustments. There have to be some affects of NOAA adjustments in the period of your study for your study to have anything to say about them.
What we've done is shown that the ERSSTv3b data are inconsistent with the most reliable subset of the ERSSTv3b data, where 'most reliable' is in turn verified by intercomparison of proximate observations
By contrast, ERSSTv4 is not inconsistent with the most reliable subset. The changes, including the changes to the weights and the adjusments, have prevented the combination of the ship and buoy data from corrupting the recent record. We don't in this work distinguish whether the improvement is due to the weights or the ship adjustments.
Oh, I see, you're concerned about the word 'adjustments' in the title. If you prefer we could substitute 'new record'?
Kevin C @ #25, Thank you for a fine reply.
Dazed & con. @ #26, Please be as long-winded or brief, as you wish. Please though, be careful not to succumb to the Moncktonian Malady of endless buzzing around points of trivial importance ( combined with his usual Gish Gallop that approaches "word salad" status ). Indeed, if I may provide a friendly caution ~ your reply #27 shows a leaning towards the Moncktonian methodology. I would like to think that, having noted the danger, you will be able to pull back from the brink!
On your final point [of #26] : of science being "just as [rigorous] either way" . . . you have used a rather ambiguous or confused phrase. Thus triggering my question: "As either way as what?"
To explain more clearly where I am coming from about that ~ please let me propose the far-from-novel point that the mainstream climate science is a sort of large pyramid composed of a "consilient myriad" of blocks. Blocks of somewhat varied rigour [ but not, I hope, including rigor mortis ;-) ] which are mostly gradually improving in rigour individually . . . and which altogether have formed a large and unmistakable pyramid.
Is the pyramid now (in your words) decently "rigorous"? Yes, it is. The whole is greater than the sum of its parts. In other words, the consilience is very great. Furthermore, there are no other pyramids in sight. Not even micro-pyramids. Nor dream'd of. (Please excuse the non-rigorous Shakespearean quote! )
But to return to your point ~ the mainstream-science pyramid is a proven pyramid . . . and it is up to the claimants (for any new pyramids) to demonstrate their pyramidal existence, moderately rigorously. Demonstrating by any reasonable means, with or without citations. It is the context, the bigger picture, which is important. ( Hence my interest in why you yourself would wish to focus on a single block of stone. )
(b) Does this SkS website exist to convince "contrarions" or even contrarians? No, I don't think it does have that purpose. It exists to convince skeptics i.e. those open to reasonable evidence and reasoned argument.
The pyramid is nowadays so huge . . . that a true skeptic cannot be a contrarian. Nowadays, to be a contrarian is to be a denier of evidence ~ and so, impervious to science-based persuasion. Rather like with the Flat-Earther situation.
Hi dazed and confused,
Thanks for the good questions; science should always be skeptical (hence the name of this site!), so there is no harm in pushing for clarification.
I agree that in a perfect world we would have created a separate ship-only record to compare to our buoy-only record to better assess the magnitude of buoy bias. However, thats not really what we were focusing on for this project.
We wanted to look at whether or not ERSST v3 or v4 was more accurate in recent decades. The main differences between the two are the buoy adjustments and the NMAT-based ship corrections. Both of these issues arise from the fact that the network is composed of inhomogenous sensors; ships themselves are not easily intercomparable as they don't all have the same instrument and engine room configurations, and buoys and ship engine intake valves are clearly different instruments.
However, there are relatively homogenous instruments available: buoys themselves. They have nearly identical sensor setups across all the buoys, and should provide a relatively unbiased estimate of SSTs in areas where buoys are present. Thus buoys provide a good test for ERSST v3 vs. v4: whichever one is more similar in trend to the unbiased buoy-only record should be the more accurate one, at least for the period of overlap with buoys.
As you can see in our results, ERSST v4 is effectively identical to the buoy-only record, telling us both that the buoy corrections employed in v4 are accurate (and remove the ship-buoy transition bias present in v3), and that the NMAT-based ship corrections don't introduce any detectable trend bias relative to the buoy-only record, at least in grid cells containing both ships and buoys.
Our intent wasn't to evaluate Kennedy's work on buoy-ship differences; rather, it was to evaluate the effectiveness of the corrections in the new version of ERSST. For that the buoy-only record provides a useful test, even if its not independent of the ERSST records.
There is interesting future work to use this and other datasets to compare ERSST and HadSST in more detail, but that will likely take the form of an academic paper rather than a blog post. This initial blog post was more of a rapid response to the politically-inspired criticism of NOAA, essentially pointing out that their results in recent years (and the resulting increase in trend) tend to make ERSST as a whole more similar to relatively homogenous series like buoys or ARGO floats.
dazed & confused - "@Rob Painting. That's an interesting graph. I'll have to take a look at the context. I assume that this a rebuttal to my argument based on the quote...."
No, the image and link to the Kennedy paper is primarily for other readers. Kennedy et al (2011) goes into excrutiating detail of the many issues in constructing a sea surface temperature record. The image demonstrates that the engine room intakes (ERI) run warmer than other measurement methods - which was mentioned in the original post.
As it stands we have the scientific literature versus an anonymous person on the internet. No data set is perfect, nor any time series reconstruction but until such time as you provide some analysis to support your claims the credibility of your arguments won't carry any weight.
@Rob Painting
Thanks for clarifying about the graph.
an anonymous person on the internet
If I provide my name and address will you be more convinced?
By my count, I've made 2 claims about science.
1) This article does not do a good job of doing what the title says. Two ways I would improve it would be to compare ship to buoy directly, and to do a correlation analysis rather than simply looking at the trend. I would be very interersted in the results of that analysis. I don't think either has been disputed. The first has been apologized for (too hard, in a perfect world, see H&C's comments above regarding this), and the second hasn't been addressed, I don't think.
2) NOAA did not follow best practices by releasing data with known, unaccounted for bias, and by not releasing the correction as soon as possible. I don't think this point has been refuted, although it has been addressed. I even offered a reasonable way to show that I was wrong.
Could you give me some idea of what kind of analysis you have in mind?
dazed - Regarding your (most recent) questions:
1) The post title is "A Buoy-Only Sea Surface Temperature Record Supports NOAA’s Adjustments", and it does just that - demonstrating that ERSSTv4 is a better match to the buoy data than ERSSTv3b, that the corrections in ERSSTv4 are indeed supported by that buoy data. I really don't see what you're complaining about there. See Zeke's post here.
2) Best practices were followed by releasing the best data available with caveats (ERSSTv3b), and by releasing an updated version of ERSST (again, with appropriate caveats) when the updated version became available. Those updates required considerable work and validation of technique, as per Karl et al. You seem to feel that the proper corrections were somehow instantly obvious and should have been published long ago, which I consider an unrealistic if not impossible standard.
Going back to your earlier posts, if you have actual issues with adjustments and corrections made to the SST records, it would be helpful if you actually stated what those objections were, rather than repeating these impossible demands for instant perfection in the published records.
@Zeke Hausfather
Let me repeat what I said to Kevin C. It's a honor to have you reply to my comments.
Thanks for the good questions; science should always be skeptical
Very good.
the NMAT-based ship corrections don't introduce any detectable trend bias relative to the buoy-only record
Excellent goal, and what I am especially interested in. Maybe I can use this as an example:
Consider 2015. Your calculated value for ERSST4 will be very close to the buoy data, since 90%+weight of ERSST4 is composed of buoy data for that year. If the NMAT-based ship corrections introduced any change at all, it would be very hard to detect above the noise.
Go back a year, and you'll find almost the same thing. If you go back far enough (~2000) the ship data will start to become a significant factor, and hence the NMAT corrections will become more of a factor, and somewhat easier to identify over the noise.
Perhaps you can see some of this from your time series graph. The correlation is excellent for ERSST4 and buoy in recent years, but not as good in prior years. This is what I would expect if the NMAT and other adjustments didn't correlate so well with buoy data, but it's only a graph.
So, for the purposes of this goal, wouldn't it be better to use ship vs. buoy? Then, even in 2015, 100% of the difference would come from NMAT and other adjustments, making their affect much more pronounced.
I agree that in a perfect world we would have created a separate ship-only record to compare to our buoy-only record to better assess the magnitude of buoy bias. However, thats not really what we were focusing on for this project.
What I'm arguing above is that it would also be better for illuminating the NMAT corrections, which apparently is of interest for you (and certainly for me).
In fact, as soon as I had read the NMAT adjustment stuff in Huang, I thought "that should be easy to check". Why not compare recent ship data with the buoy data. If the bias was the same year to year, this would imply that NMAT adjustments shouldn't be made for that period since the ship-buoy bias would suffice.
Then I remembered that I had just read about that in the buoy bias adjustment in Kennedy. I turned to the appendix, and was dissapointed to find that there was only a single number covering the period in question. I then thought, maybe others have done something similar year by year. Then I read: "finer space and time corrections do not seem to be possible with the limited in situ data available", so I didn't look for anything else. (Is there such a thing?)
That was what attracted me to this article.
This brings up a question, again, that I have already asked, but hopefully you can address: How is it that you are able to make a time series comparison of buoy to ERSST4, when Kennedy can't do the same for buoy to ship?
This initial blog post was more of a rapid response to the politically-inspired criticism of NOAA
Then why show it at AGU? Were there a lot of contrarians there?
This site, rightfully, does not allow commenting on other's motives, so I have been careful to stay away from that. You stated what I guessed, and it explains a lot.
You may be familiar with Harvard science historian Naomi Oreskes assessment regarding the “seepage” of climate skeptic argumentation to affect the formal scientific literature. It seems that you are letting the contrarian argument affect your science.
The focus of your article is on the trends. I am not a statistician, but in analysing time series data, I haven't usually seen such a focus on the slope as much as on the correlation (and error thereof) of the two series. Your time series graph shows this, I guess, but I can't form any statistically significant conclusions from eyeballing this graph.
If you are interested in arguing against the contrarians, your focus makes sense: validate that the trend of ERSST4 shows no hiatus (aka matches the buoy data). No wonder you didn't use ship vs. buoy, or any other type of analysis comparing the two time series rather than just the trend.
IMHO, that's too bad. What I would hope for is an article that isn't so much concerned about the trend, and more concerned with making sure the NOAA adjustments were the best damn adjustments possible. I would have found that much more helpful. Isn't the ultimate goal to coax out the best data possible?
@KR
1) "A Buoy-Only Sea Surface Temperature Record Supports NOAA’s Adjustments". Simply showing that it's better than ERSST3B is not a sufficient condition for demonstrating this, unless by "supports" you mean something weak like "might show". If I make small random adjustments to ERSST3B, I'd have something like a fifty-fifty chance of improving it, if the measure of success is whether the trend got closer to the buoy trend.
Showing that two time series trends more or less correlate is not the same as showing that the two time series correlate. I can draw an infinite number of point sets that all have the same trend as the buoy data. I think you'd agree that some of these would be better fits to the buoy data than others. The way to find the best fit is looking at correlation of the series, not correlation of the trends. Perhaps a statistician would care to comment on this?
I have explained what I think would be necessary to improve this paper.
2) Impossible standard. From the time the buoy adjustment was known (Reynolds, 2010) to the time of it's incorporation, it took 5 years, and that is considering that it was a known issue in ERSST3 (2007), which said, "At present, methods for removing the ship–buoy bias are being developed and tested."
So handling this adjustment was already underway to the point of testing in 2007.
I can understand the adjustment taking a while to calculate, as it involves somewhat complicated programming to extract and analyse the data. Doesn't 3 more years seem like a long time? Maybe the testing went badly. Note that the result of .12C wasn't far from what was initially projected in 2007 (.12C vs .1C). Even using .1C would have made the data better.
Once the adjustment was known, it was a simple matter of adding a constant to a subset of temperature readings. If it took a month, I might be persuaded. A year for this? OK. Why didn't it make it into ERSST3b? Five years? I don't think I'm asking for an impossible standard. Can you explain why it took 8+ years overall? If so, I will reconsider.
Note that from 2005 (ERSST2) to ERSST3 (2007) the entire satellite bias adjustment was added, which is considerably more complicated than the ship-buoy bias.
Best possible data: I have argued that ERSST3 did not contain the best possible data. I haven't seen a counter argument. Go look. Until you can show this, I don't think your claim is justified.
The caveat. Have you actually read any of ERSST3 (Smith et al)? From the abstract, p. 2283 : "These improvements allow better analysis of temperatures throughout the record, with the greatest improvements in the late nineteenth century and since 1985[emphasis added - the time of the ship-buoy bias adjustment]."
There is no mention at all of the ship-buoy bias issue until page 2289, where it is given two paragraphs starting on the bottom of the second page of a section titled "d. Bias-adjusted satellite SSTs", sandwiched between a discussion of remote and locally based satellite bias adjustments and biases in the XBT.
If I were a researcher interested in SSTs at the time, why wouldn't I use NOAA data (unless maybe I was from England)? My peers use it. Based on the abstract, I would feel pretty confident that I was using good data. Since my research would be on the changes of migration patterns of sperm whales due to ocean warming, I probably wouldn't read through the paper looking for possible caveats; I would trust the NOAA data implicitly. Even if I did somehow make it to this paragraph 7 pages in, there's a good chance I wouldn't understand it, since my area of expertise was marine biology.
@KR
I forgot to address your issue about what are my concerns with the NOAA adjustments.
I haven't gone into them for a few reasons:
1) My concerns center primarily around the NMAT ship bias adjustments. This is a considerably more involved topic than the things I've already brought up. I haven't been on this board before, so I wanted to test the waters. If I was only going to get propaganda, I wouldn't want to waste your time or mine.
2) Since they are more complex issues, I wanted to wait until I gained a little experience in arguing my points. The feedback and counter arguments here have helped a lot.
3) I was worried about being on topic. My criticism of this article is clearly on topic. My criticism of NOAA's delay to incorporate ship-buoy bias probably isn't, but maybe close, and isn't too involved. My criticism of the NMAT ship bias adjustments almost certainly is off topic. Unfortunately, I don't know anywhere else on this site to discuss it, so I'm kind of at a loss.
It will take me a bit of time to write up those concerns. If you want to prepare (ha! :) ), you could read Karl concerning the effect these adjustments have made, and the ERSST4 paper, and especially take a look at figures 5 and 6 and the accompanying text. Perhaps you'll be able to anticipate my concerns.
@Eclectic
You have asked some profound questions that touch on the philosophy of science that has spurred a lot of thinking on my part on how best to answer you. I owe you an answer on this, but I don't have time right now.
Let me address a couple of other minor points meanwhile:
The pyramid is nowadays so huge . . . that a true skeptic cannot be a contrarian. Nowadays, to be a contrarian is to be a denier of evidence ~ and so, impervious to science-based persuasion.
Isn't that what they told Einstein? Or was it Schrodinger, I can't remember. Oh, wait, maybe it was Hubble. If you conclude that you (or what you believe in) are so right that anyone who opposes you can't be, aren't you guilty of exactly what you are accusing contrarians of?
Practically speaking, I know a contrarian that I am pretty sure is open to persuasion. He's as far off the edge as it gets; he emails me articles that take things out of context and claim things like "Kerry admits that any US efforts to reduce carbon are futile." Recently, I discussed with him what I've read so far. He hasn't renounced yet, but he didn't reject the case for AGW out of hand either. He certainly was willing to listen to reason. I believe if confronted with enough evidence (which I don't yet have a handle on), he could be persuaded. I don't think it's a good idea to paint contrarians (or anyone else, for that matter) with too broad a brush.
Moncktonian methodology
Believe it or not, I had to look that up. I guess Monckton is some arch enemy of global warming, so I suppose it wouldn't be good to Gish Gallop too much.
Seriously, I appreciate you friendly criticism. I aim to stay relevant. #27 was a response to Kevin C, and I pretty much responded paragraph by paragraph. Maybe I should have quoted him more to make that obvious?
I would actually appreciate more specific criticism on this point, but I'm not sure this comment section is the best place, as it would be way off topic, and probably boring for most besides. Perhaps as a compromise, if you find me erring too far in this direction in the future, let me know.
Thus triggering my question: "As either way as what?"
What I was trying to say was that I agreed that a contrarian argument would require more proof, but that whether contrarian or not (either way), the requirements for presenting the case should be the same, including citations.
Dazed & con. @ #37 ,
My apologies for not explaining myself to you in a way that is more "water-tight". I was (and still am) rather reluctant to undertake the very lengthy amplification that would be necessary to eliminate all possible misunderstandings / misinterpretations of my comments. A lengthy discourse would derail the thread from its proper topic . . . and yet, I will post a few comments now, because they may indirectly assist the thread to proceed more efficiently. (And I hope they will be of general interest, anyway.)
Because of my (intended!) brevity, I must ask you yourself to meet me halfway ~ and not look for minute exceptions and "legal loopholes" ( where we could spend endless time wrangling about over-fine points . . . wrangling in a manner dear to the heart of Lord Monckton! ) .
~ First: your quote, "What I was trying to say was that I agreed that a contrarian argument would require more proof, but that whether or not (either way), the requirements for presenting the case should be the same, including citations." [unquote]. My reply ~ fair enough, where the opposing cases are roughly equal ( or at least, within a few miles of equality! ). But in the present case, of climate science versus contrarian ideas, the comparison is very much more like Round Earth Hypothesis versus Flat Earth Hypothesis. Here, it is very reasonable for the established/proven science to pass over the requirement for continually repeated citations (etc) . . . while holding the "challengers" to an asymmetrically higher standard. Unequal, but fair. The very-thoroughly-established science should not be expected "to drop a cannon ball off the Tower of Pisa" day after day and every day!
~ On Lord Monckton, and his "intellectual" activity : If you were previously unaware of that gentleman, then my kindly-meant advice is that you avoid the time-waste of reading his expositions (unless you find some entertainment value in observing some of the follies mankind is capable of). I am sure that no lawyer would assess Monckton as failing to meet the legal standard of sanity . . . yet I am less sure that psychologists would be unanimous on whether he meets the intellectual standard of it.
~ (lastly) : re my quote, ". . . a true skeptic cannot be a contrarian. Nowadays, to be a contrarian is to be a denier of evidence . . . "
(and your own quote), "Isn't that what they told Einstein? Or was it Schrodinger, I can't remember. Oh, wait, maybe it was Hubble. If you conclude that you (or what you believe in) are so right that anyone who opposes you can't be . . . [etc] ".
Hmm, Mr Dazed, you were being a bit naughty there (though I appreciate your restraint in not throwing Galileo into the pot, as well! )
No, the cases you mention, from the early or adolescent days of fundamental physics/astronomy . . . are not at all a reasonable comparison to the huge "pyramid" of modern climate science. The appropriate comparison is something like the Round Earth Hypothesis ~ where the overall picture is something proven beyond reasonable doubt : and where the "contrarian" must be a denier of evidence.
Yes, I paint with a broad brush : but the exceptions (if any) are terribly few . . . and probably also afflicted with a form of the Monckton mindset.
(Again: my apologies for my insufficiency of brevity.)
What Karl says
I'm an idiot, and feel free to call me that, at least for a couple of posts.
While I read Karl's paper, I failed to look at the supplemental materials. I was looking for some justification of the buoy weighting, and I couldn't find much in either Karl or Huang. So I looked in the supplemental materials. While looking for that, I found this:
To evaluate the robustness of this correction, trends of the corrected and uncorrected ship data were compared to co-located buoy data [my emph] without the offset added. As the buoy data did not include the offset the buoy data are independent of the ship data[even if it did, it wouldn't matter, since it's simply a constant]. The trend of uncorrected ship minus buoy data was -0.066°C dec-1 over the period 2000-2014, while the trend in corrected ship minus buoy data was -0.002°C dec-1. This close agreement in the trend of the corrected ship data indicates that these time dependent ship adjustments did indeed correct an artifact in ship data impacting the trend over this hiatus period.
www.sciencemag.org/content/suppl/2015/06/03/science.aaa5632.DC1/Karl-SM.pdf
This is the analysis I was looking for. If you want to validate the correction, you should compare ship to buoy data. This is exactly what I wanted to do with Reynolds' buoy correction (I mentioned this before), but there was only a single number for a decade. What's more, the approach uses the co-location approach (which I believe, but can't prove, is better) rather than the grid system of this article. Good for Karl.
Unfortunately, there are still problems with Karl's work:
1) No confidence intervals.
2) Not easily reproducable. Where is the data and code that calced this? If a stat package was used, at least step by step instructions to reproduce the results would be nice.
3) As discussed before, comparing the trends is a weak test of fitness.
Karl's paper is specifically aimed at dispelling the hiatus. So perhaps he is justified in only being concerned with trends. That's too bad. A golden opportunity was missed. Here's what I mean:
Filtering and adjusting time series data is tricky. Fortunately, in an area like communications, you can put a test signal through, tune your circuit, and look at the signal coming out. You tweak the circuit until you get the best signal possible.
When dealing with historic data, there is no test signal. Usually there is no good way to know if you've "tweaked the circuit" correctly (Ok, there are certainly some statistical tests, but that's not the same). Fact of life. To deal with this effectively, you must be especially rigorous and check everything you can, but there's always doubt. It makes NOAA's job hard. You can see NOAA "tweaking the circuits" from version to version when they use different (more advanced) filters.
In the past, NMAT adjustments only went up to WWII. Now, with ERSST4, the tail end coincides with the buoy era. Validating the NMAT adjustments as Karl did above not only helps confirm the trend during the "hiatus" period, it also helps validate the NMAT adjustments made in the past. In the analogy above, consider the buoy data to be something akin to a test signal.
If NMAT adjustments proved to be valid, that would be fantastic! The adjustments are much bigger before WWII, and having greater confidence in NMAT adjustments would mean greater confidence in the data of that era.
But even more. There is major descrepancy in the ship adjustment between ERSST4 and HADSST3. Showing the NMAT adjustment to be valid would also indicate that it would be the preferred method, compared to the laborious calculations and poor quality data used by HADSST3 for this.
If, on the other hand, the adjustments aren't so good, that means there's a potential for more science to do.
So, why wouldn't you put these adjustments through the most rigorous test possible? If they really work well, you should be able to get a great correlation between buoy and ship data (same comparison as Karl did, but with the additional test). I don't know what software he used, but mathematical packages have correlation calculations built in. Why not run that and see what happens? I'll do it if someone sends me the data.
I have some additional confusion about this topic, but I'll save it for another post.
dazed & confused "If I provide my name and address will you be more convinced?"
No, but if you could provide some statistical analysis to support your claims that would be a nice start. As it stands we have the published scientific literature versus some bloke on the internet unwilling to provide any sort of statistical analysis to support his bold claims. You can appreciate how underwhelming that might look to readers.
Sure you can continue to cast aspersions, until a moderator intervenes at least, but you're really going to have to back up your claims with some number-crunching if you're going to convince anyone that you have a better handle on this than the experts in the peer-reviewed scientific literature.
@ Rob Painting
Really?
Look at the claims I made:
1) It took 8 years from the time NOAA was developing and testing the buoy bias until they implemented it. I cited the stuff. What statistics do I need to back up this claim?
2) I claimed that it would be better to compare buoy vs. ship data if you're trying to validate the NOAA adjustments, since this would remove the autocorrelation bias inherent in the method used by Hausfather and Cowtan. It seems to me that anyone familiar with statistics would understand that. Apparently Karl understands; it turns out that's what he did (see my post above). Ask Karl for statistics on this one.
3) I claimed that a better test of fit between 2 time series is a test of correlation, not comparing the trends. Again, I think this is pretty standard stuff. I'm not sure what statistical analysis I would do to convince you. If you're in doubt, I suppose I could hunt down a source.
The only thing I can think of where your point could be valid is the thing about "finer space and time corrections do not seem to be possible with the limited in situ data available." I pointed out what appears to be attempts to do what is claimed to be impossible. Do you expect me to run some analysis to decide this issue? I even mentioned that I could be wrong for several reasons, and I asked for help from the board in understanding this apparent contradiction. Haven't seen anything. Not that anyone owes me anything, but I was hoping.
I have even tried to help by suggesting ways to could defeat my arguments where possible. I don't know what more I can do.
If there is something I've claimed that needs statistical analysis, could you point it out?
Something to consider:
I started looking at this issue because a denier friend (I can call him a denier, he's ok with that) brought it up. I love science, and have since before I could read. When I started digging, I couldn't believe what I saw. I mean, this is NOAA. Surely I must be wrong. What am I missing? I've been on this site before, and thought it would be a great place to challenge my conclusions. It was not an easy decision, since I knew I'd get plenty of blow back (not complaining, it's your site, I'm the "uninvited" guest).
I wish eclectic would take one of the stones out of his pyramid and put me out of my misery. Surely there must be something in that pyramid that can easily refute what I've been saying. Restore my confidence in the pyramid! Please, show me that I'm wrong. I'll congratulate you. Honest.
Telling me I'm one nobody against the "experts in the peer-reviewed scientific literature", or about the power of the pyramid doesn't help me. Threatening me with a mod intervening seems like a strong-arm tactic. Are these the tactics you use to smash anyone who doesn't agree with your point of view?
I don't even think I've ever claimed anything about the hiatus or AGW, so I'm not even sure that I've said anything that disagrees with your point of view (I am not pretending that I know your mind, of course). My concerns are simply with methodology.
Suggestion to improve the buoy-ship bias number.
I'm beginning to suspect that you (plural) aren't understanding my arguments, and that's why I'm getting kind of general criticisms rather than specific refutations. Perhaps I'm wrong, perhaps I'm not explaining myself very well, or perhaps it's because it's New Years.
Indulge me, let's try this:
I have a suggestion how to improve the buoy-ship bias. I think we'd agree that would be a good goal if possible. This is in no way a condemnation of what was done with the buoy-ship bias in ERSST4 (I think this was the best thing about the new version, by the way). It's very possible that my suggestion sucks. Could someone on this board explain back to me what I'm getting at, and then comment whether they think this is a good suggestion or not?
In the supplemental materials, Karl explains how he checked the ship adjustments (discussed above). He compared the trends of the buoy only data with the adjusted ship only data. The difference in trends was .002C. This means that the trends were essentially parallel. Of course, this is before the ship-buoy bias is added.
What occurs to me is that the vertical difference between these two trends is probably the best possible calculation of the ship-buoy bias ever done (I'm calling this the Karl ship-buoy bias). To the extent that the trends are parallel, the use of a constant for the ship-buoy bias is justified.
What would be the result of using the Karl ship-buoy bias? It would ensure that the resulting ship and buoy trends would be colinear! When marrying two different time series, it doesn't get sweeter than that.
What would be even better is if the Karl ship-buoy bias = .12C. That would be unlikely for several reasons, the least of which is not that the standard error on the bias is something like .03C (I think, it's not critical to this discussion).
What would be the result of not using the Karl ship-buoy bias, but using the .12C bias? The two trend lines would be separated by a small distance (Karl -.12C, obviously). The old familiar affect from the change of the mix of data would still occur (obviously much smaller than with no ship-buoy adjustment at all). Using the Karl ship-buoy bias would remove this affect entirely.
This explains a phenomenon that puzzled me up until this point, which is how I hit upon this idea. Karl states that when he gives the buoys more weight, this changes the overall trend by ~.01C. Imagine that the ship and buoy data trend lines were colinear. Changing the weight back and forth from ship to buoy should have no effect on the final trend, since both trends are the same.
However, if the trends are offset slightly, then changing the weight would make a small difference.
Up until now, I never understood the rationale behind the weight adjustment. Now I'm thinking that it's possible that it was done to counteract the effect of the slightly offset trend lines. If this is the case, using the Karl ship-buoy adjustment would remove the need for the weight adjustment altogether.
dazed & confused - " 3) I claimed that a better test of fit between 2 time series is a test of correlation, not comparing the trends. Again, I think this is pretty standard stuff. I'm not sure what statistical analysis I would do to convince you."
This is a key issue, you've made this claim repeatedly, but provided no statistical analysis that this approach would be a better estimate of the true temperature anomalies. All these measurement methods have spatial and time-varying biases. The buoy data, for instance, have been demonstrated to have greater precision than the ship data. The buoys have become the dominant source of data in recent times and the ship data have dwindled, so wouldn't we logically expect to see the correlation between these two measurement methods grow worse in time? The trends will diverge. You seem to be claiming they'll remain the same. Hence I'd like to see some analysis that supports your assertions. If all I get is another wordy reply then I can only surmise that you cannot back up your claims with actual number-crunching.
"Threatening me with a mod intervening seems like a strong-arm tactic. Are these the tactics you use to smash anyone who doesn't agree with your point of view?"
See the comments policy - specifically sloganeering. Needless repetition of a meme constitutes sloganeering. Whether a moderator chooses to intervene is another matter, but I suspect your continual failure to back up repetitious claims with actual analysis may draw a moderator's attention.
"I don't even think I've ever claimed anything about the hiatus"
No, but I suspect it was mentioned purely for troll value because the 'pause' is a common myth amongst AGW deniers. Continued sea level rise amply demonstrates how absurd that whole myth is.
dazed - As per the Karl et al article and supplemental materials, the buoys were given a higher weighting when computing the SST due to their lower noise level, as in the referenced Smith et al 2008 paper (which you state you have read?). Not to counteract differing trend lines, as you posit, but explicitly to emphasize the best data in the merge. The supplemental data is quite clear on that.
Note that removing a constant bias due to sampling method doesn't in any way force the various trends to be colinear; that would require an offset and (unjustified) scalar changing over time.
Regarding correlations, note that ERSSTv4 correlates much better with the buoys than ERSSTv3b, both in trend and in details of the anomalies, as shown in the OP:
So that work has already been done. If you want to run your own stats on the correlations, go ahead - but ERSSTv4 is clearly an improvement.
"I claimed that it would be better to compare buoy vs. ship data if you're trying to validate the NOAA adjustments" - That is, in fact, the basis of Karl et al, comparing those data sets to see how to merge them properly.
---
Again, I'm not seeing any meat in your issues with Karl et al, or for that matter the Hausfather and Cowtans article regarding it. Rather, I'm seeing what I think are several misconceptions best addressed by carefully reading Karl and the earlier Smith papers and supplementals.
Dazed & con. @ #42 and earlier,
You seem to be very exercised by the notion that ship/buoy data trend lines are not "collinear" (rather than being parallel with a small offset).
Please pause [or hiatus! ] for a moment, and consider why you are perturbed by that discrepancy. And what consequences of importance (if any) derive from such non-collinearity.
In the stone block & pyramid analogy :- you seem to be arguing that one stone block (somewhere high on the western face of the pyramid) has one edge which is not perfectly rectangular. Should the architect send some workmen to chip a few inches off that particular block ?
. . . I can well imagine that Einstein, Schrodinger & Hubble would all say that the pyramid is already "within specification". ;-)
@KR
Thank you for addressing the science. Hopefully you can give me some feedback on this and other items.
This comment pertains to my so called "Karl buoy adjustment"
As per the Karl et al article and supplemental materials, the buoys were given a higher weighting when computing the SST due to their lower noise level, as in the referenced Smith et al 2008 paper (which you state you have read?).
Yes, buoys have a lower noise level. This has been stated many times, and I will definitely concede that point. Is the weighting factor justified? If the purpose of the weighting was to reduce noise (implied, but I'm not sure this was ever stated), I guess it would be justified, and I'm willing to concede that point (but it is an interesting question). However, noise reduction should not affect the trend, since you would expect a normal distribution of noise around the mean (the trend line, in this case), so that more or less noise (a smaller or larger bell curve) should have no large affect on the trend, yet Karl states that it did (it was the third leading cause of trend change in ERSST4). I don't think reducing noise is enough justification to skew the data. While it seems wrong to me, I am not sure how to go about evaluating such a question, which is why I haven't brought it up before. Perhaps you can clarify this for me.
I wasn't so much arguing about the purpose of the buoy adjustement as the mathematical affects of the proposed adjustment on them. But you make a good point. Let me retract anything I said implying motivation and purpose for the adjustement. Let me say it this way: with my proposed adjustment, it would vastly improve any weighting that might be justified, since adjusting the weighting would then have no affect on the trend, only the noise.
What was the weight Huang used (either constant or formula), and how was that weight determined? I could find nothing about that; do you have any idea, or can you point me to somewhere? I'm not saying it's not there, just that I haven't found it yet.
Note that removing a constant bias due to sampling method doesn't in any way force the various trends to be colinear; that would require an offset and (unjustified) scalar changing over time.
In general, you are absolutely correct. Do we agree that getting the trends to be as colinear as possible is the goal of the exercise?
The situation is even more complicated than you desribe. Applying an (unjustified) scalar change over time only works if the two trends are both linear.
In the event actual trends are non-linear, you would need a non-linear function to do it. This, in fact, is true of the case in question, at least because the mix of bucket to ERI measurements is non-linear with respect to time.
But here's what I see as the beauty of what I suggested: the required non-linear function we need is the NMAT ship adjustments calculated by Karl. How do we know? Because, according to Karl, when applied to the raw ship data, it produces a trend that is parallel to the buoy data. It creates 2 parallel lines.
The diff between the 2 parallel lines is obviously a constant (your offset). What does that constant represent? Since one line represents adjusted ship measurments, and the other buoy measumrents, the difference bewteen these two lines must be ship minus buoy, aka the ship-buoy adjustment. So why not use that instead of the .12C?
If, in fact, this wasn't the case, so that the two trend lines weren't parallel, it would mean that even after the NMAT adjustment, the ship and buoy readings were drifting closer or farther apart over time. The use of a contant ship-buoy bias (NOAA used the constant of .12C) would not be justified. However, the lines are parallel, according to Karl.
Let me know what you think.
@KR - again thanks.
Regarding correlations, note that ERSSTv4 correlates much better with the buoys than ERSSTv3b, both in trend and in details of the anomalies, as shown in the OP:
The trends correlate better, I'll give you that, and there is obvious stats to back up that claim.
I'm glad we agree that correlation of the "details of the anomalies" (I'd call that the data) is important. Perhaps they do correlate, I never claimed otherwise.
Are you expecting me to rely on eyeballing a graph to determine this? Is that science?
If you want to run your own stats on the correlations, go ahead
I'm so used to scientific papers including stats as a matter of course that I just expect it. When I mentioned the lack of such stats (yes, there's one for the trend, but none for correlation), I was amazed that I got any pushback at all on this.
I shouldn't have to do any work to help the author prove their point. Should I write the program and gather the data also?
------------------
This is only one issue I have. The other is the autocorrelation thing. You didn't mention that.
@KR
"I claimed that it would be better to compare buoy vs. ship data if you're trying to validate the NOAA adjustments" - That is, in fact, the basis of Karl et al, comparing those data sets to see how to merge them properly.
Yes, and a good goal.
If this refers to the autocorrelation thing, then I was wrong in the last post when I said you didn't mention it.
When I said that the OP should have compared buoy to ship data instead of buoy to ship+buoy data if the goal was to confirm the NOAA adjustements, no one agreed.
When I discovered that Karl himself did just what I had been asking for, even then no one agreed with me, or at least conceded I had a good point.
From the quote above, it seems you are agreeing with me, that this is the way to confirm adjustements.
Since you don't seem to think any of my arguments have merit, I must be misunderstanding. Could you ellaborate?
as in the referenced Smith et al 2008 paper (which you state you have read?). [my emph]
- KR
I confess, I haven't read it all. Since a good section of the paper is devoted to satellite biasing, which was subsequently removed in a major product recall (ERSST3B), I decided to skip that for the time being, although it might be interesting to see what NOAA did wrong. I may look into that later.
The ship-buoy adjustment is mentioned in the section on satellite bias for some reason, so I missed it on my initial read. Thanks to davidsanger for pointing this out. It's made my case for the eight year procrastination clearer.
I also have to admit I only skimmed over the low and high frequency tuning, since that should be a matter of statictics and signal processing, both well established fields. Since the filtering has been replaced in ERSST4, I'm not as sure about that as I was. Is that worth looking into? I did notice this that gave me pause:
Anomalies were damped toward a zero anomaly when sampling was insufficient to analyze the climate-scale signal. Here the 1971–2000 climate base period is used to form anomalies, and thus both the LF and HF analyses are damped toward this base when sampling is not adequate.
p 2284. of above mention doc.
I don't know, does this imply that the signal after 2000 (and before 1971) was filled in based on analysis of data before 2000 (and after 1971)? In the context of climate change investigation, it seems to me that wouldn't be a very good idea. I haven't looked how this is handled in ERSST4. Before I do a lot of investigation, can someone fill me in on this? Am I misreading it? Is there some good reason it was done this way? Has ERSST4 made this question irrelevant? I'm sure this issue must have come up before.
dazed - "I'm so used to scientific papers including stats as a matter of course that I just expect it. When I mentioned the lack of such stats (yes, there's one for the trend, but none for correlation), I was amazed that I got any pushback at all on this."
You expect continued correlation when the circumstances dictate correlation between the ship and buoy data will grow worse in time. Not sure what you're amazed about.
"I shouldn't have to do any work to help the author prove their point. Should I write the program and gather the data also?"
You haven't done any work. Where are your calculations? The peer-reviewed literature you criticize has done the work, done the calculations, tested various approaches, but you haven't. Readers may legitimately wonder why that is.