Climate Science Glossary

Term Lookup

Enter a term in the search box to find its definition.

Settings

Use the controls in the far right panel to increase or decrease the number of terms automatically displayed (or to completely turn that feature off).

Term Lookup

Settings


All IPCC definitions taken from Climate Change 2007: The Physical Science Basis. Working Group I Contribution to the Fourth Assessment Report of the Intergovernmental Panel on Climate Change, Annex I, Glossary, pp. 941-954. Cambridge University Press.

Home Arguments Software Resources Comments The Consensus Project Translations About Support

Bluesky Facebook LinkedIn Mastodon MeWe

Twitter YouTube RSS Posts RSS Comments Email Subscribe


Climate's changed before
It's the sun
It's not bad
There is no consensus
It's cooling
Models are unreliable
Temp record is unreliable
Animals and plants can adapt
It hasn't warmed since 1998
Antarctica is gaining ice
View All Arguments...


Username
Password
New? Register here
Forgot your password?

Latest Posts

Archives

Why we can trust the surface temperature record

Posted on 28 August 2010 by John Russell

Surveys of weather stations in the USA have indicated that some of them are not sited as well as they could be. This calls into question the quality of their readings.

However, when processing their data, the organisations which collect the readings take into account any local heating or cooling effects, such as might be caused by a weather station being located near buildings or large areas of tarmac. This is done, for instance, by weighting (adjusting) readings after comparing them against those from more rural weather stations nearby.

More importantly, for the purpose of establishing a temperature trend, the relative level of single readings is less important than whether the pattern of all readings from all stations taken together is increasing, decreasing or staying the same from year to year. Furthermore, since this question was first raised, research has established that any error that can be attributed to poor siting of weather stations is not enough to produce a significant variation in the overall warming trend being observed.

It's also vital to realise that warnings of a warming trend -- and hence Climate Change -- are not based simply on ground level temperature records. Other completely independent temperature data compiled from weather balloons, satellite measurements, and from sea and ocean temperature records, also tell a remarkably similar warming story.

Confidence in climate science depends on the correlation of many sets of these data from many different sources in order to produce conclusive evidence of a global trend.

This post is the Basic version (written by John Russell) of the skeptic argument "Surface temperature record is unreliable". We're currently writing plain English versions of all the skeptic rebuttals. If you're interested in helping with this effort, please contact me

0 0

Printable Version  |  Link to this page

Comments

Comments 1 to 30:

  1. Global Warming is taking place. In Northern Hemisphere Heat Waves started in Russia and moved South with firestorms. It is the SUN.
    0 0
    Response: The question of whether the sun could be causing global warming is examined in detail, including many peer-reviewed papers on the subject, at "It's the sun" (long story short, the sun has been cooling over the last few decades while our planet has been warming).

     
  2. "the organisations which collect the readings take into account any local heating or cooling effects" Virtually every 'adjustment' is made upwards. This is impossible unless sytematic bias is occurring. 'Remarkably similar' is also incorrect. Eg Unadjusted satellite data doesn't fit/isnt similar with other data. The only consistency is the 'remarkable' number of times adjustments are made upwards, to make them 'remarkably' consistent with each other.
    0 0
  3. thingadonta, I think you're mistaken there. Re: upwards vs downwards adjustments --- there are many cases where the processing of surface data results in a downward adjustment; you just never see them highlighted at WUWT for some reason. When "skeptic" bloggers Jeff Id and RomanM created their own global temperature reconstruction using surface station data, they found a warmer trend than that from Phil Jones's HADCRUT record. See this post for a more detailed discussion that illustrates how robust the surface temperature trend is. You get very, very similar results to the NASA/CRU temperature records even if you use completely different methods with completely different input data (e.g., daily GSOD data instead of monthly GHCN). Re: satellites --- The RSS satellite record shows a trend of +0.16C/decade. Over the same time period, GISS, HADCRUT, and NCDC also show trends of +0.16C/decade. The four trends are identical to within 0.01C/decade ... and RSS data are not adjusted in any way to match the surface data. Conspiracy theories and speculation about fraud or tampering with the data may be popular in certain other quarters of the blogosphere, but let's avoid them here, please.
    0 0
  4. When I say "see this post" I of course mean "see this post" ... :-)
    0 0
  5. Why not check out the trends by yourself? I maintain a csv file of monthly temperature anomalies for the 5 major global temperature series that you can download and analyze in Excel, R or other software. The 3 surface station data (GISS, Hadley, NOAA) run from 1880, the satellite data series (RSS, UAH) run from 1979. Here's the link to my do-it-yourself post.
    0 0
  6. Presumably thingadonta will acknowledge Ned's correction? It's been quite a while since volunteers did these "outsider" reanalysis efforts, I'm surprised thingadonta is not aware of 'em.
    0 0
  7. #6, Presumably thingadonta will acknowledge Ned's correction? Or better yet, the fact that his basic claim about the "systematic bias" of the temperature record has been debunked here more times than anyone can count?
    0 0
  8. Kelly O'Day writes: I maintain a csv file of monthly temperature anomalies for the 5 major global temperature series that you can download and analyze in Excel, R or other software. For those who haven't visited Kelly's website, there are all kinds of useful and informative tools and graphics there.
    0 0
  9. I just finished reading an interesting book on the history of weather and climate data gathering, analysis and modeling; Paul Edwards - A Vast Machine. It's worth a read. He goes through a lot of the caveats and the intricacies of this type of historical trend analysis rife in complex systems science, where you have to go back and forth between historical data sets, adjust for calibration errors and biases in either direction, come up with ever more realistic ways to reconstruct a global dataset from local measurements, in a never ending process to continually improve your reconstruction of the climate record. He focuses a great deal on the interplay between models of various sorts and what we refer to as "the data", and notes that in this type of science there is no such thing as data without models. You constantly have to model things like the changes in measurement devices, adjustments for the UHI effect, interpolate between stations, and so on. There's simply no such thing as meaningful raw data. He points out that the UAH controversy was framed in this mistaken notion that satellites provide "measurements" of global temperatures whereas the surface record is based on such model adjustments, when in reality the satellite data contains some of the most complex modeling work of all. Anyway, bookplug!
    0 0
  10. Acushla at 20:06 PM, to dismiss the sun, one also has to dismiss variations in cloud cover. So did the long story short response include clouds as a factor and if so what changes in cloud cover was factored in to the nett result.
    0 0
  11. Also, if one wants to dispute the temperature record for whatever reason, then they also have to explain away: - changing timing of seasons - receding glaciers - rising sea levels - migration patterns of all sorts of creatures - declining sea ice - upward migration of mountain flora and fauna - increased range of tropical diseases - increased range of certain insects - timing of the icing over and thawing of rivers and lakes - blossoming of plants - and many, many more indicators, of which there are literally thousands of studies One does not need thermometers to ascertain increasing temperatures.
    0 0
  12. Steve O at 08:45 AM, there are at least a couple of points that can probably be removed from your list, the most obvious being the changing times of the seasons, and the related blossoming of plants. The reasons for these can be found in the earth's axis precession of one cycle in 25800 years which equates to one complete day every 70 years. During the complete cycle the seasons will move completely through the calender in that time.
    0 0
  13. johnd at 03:25 AM on 29 August, 2010 I suppose it depends which cloud cover dataset you use. The longer term surface observation dataset (SOBS) also shows a gradual increase in global mean cloud cover over a longer period than shown below. From the 2009 NOAA State of the Climate BAMS supplement.
    0 0
  14. Johnd, your speculation, or can you provide cites of sufficient quantity and quality as to suggest the many researchers practicing in several domains you contradict are so incorrect as to warrant dismissing their collective evidence? I hear "I doubt it." Is that all?
    0 0
  15. Johnd, Have you ever heard of leap years? Provide evidence of your extraordinary claim that the seasons are precessing as you claim. I note that summer solstice has not shifted, as it would with your claim. Please explain how the seasons could change but the solstice would not. Remember that these types of claim affect your reputation for reliability.
    0 0
  16. johnd at 09:15 AM on 29 August, 2010 Flowers blooming earlier now than any time in the last 250 years The paper Climate Change and Cherry Tree Blossom Festivals in Japan shows how the date of flowering for some is now two or three weeks earlier than it was in their youth. From checking records going back to the 11th Century it states that "while temperatures have varied over this period, recent decades have been warmer on average than any time during the past 1000 years"
    0 0
  17. doug_bostrom at 09:56 AM, which point are you referring to, clouds or the Milankovich axis wobble cycle?
    0 0
  18. michael sweet at 10:17 AM, if the solstices and equinoxes are not moving then that calls into question the existence of the related Milankovitch cycle. You appear to be claiming that it doesn't exist as I believe is commonly accepted, or else has stalled. What research is there to support such a claim?
    0 0
  19. You tell me, johnd. You're the person saying "I doubt it." Look up the publications of the researchers you're contradicting, find the errors and oversights you imply invalidate their conclusions, show by persuasion how your speculations about confounding factors are relevant.
    0 0
  20. You don't need thermometers to notice the temperature change was highlighted by a recent column I read by a vigneron in Victoria, Australia, who has records of when grapes were picked at his vineyard. These records went back many decades (being a family business) and he remarked that it was quite clear that over the past numerous decades the picking time has been advancing by a week each decade. The article was aptly titled "The proof is in the picking".
    0 0
  21. As per Steve O's list #11: You might add snow line elevation in mountains, ski resort seasonal duration, or even locations chosen for mounting on ski lifts.
    0 0
  22. Johnd, Your argument is false on its face. Why should I look up more data when you have not cited a single source for your extraordinary claim? You claim that spring is coming ealier AND fall is coming later due to seasons shifting. This is obviously impossible. It must be one or the other. Is spring coming earlier due to the supposed season shifting or fall later? What accounts for the shift in the other season, since both have been observed to change? In addition, the shift of spring and fall is 7-21 days in the last 30 years. You claim one day shift in 70 years. I suggest the scientists are right in saying there is not a shift in the seasons. Think about what you claim before you write it. The Milankovich cycles change where energy strikes Earth, not the season when it arrives. This is a completely unrelated topic from seasons shifting, you need to learn about the significance of the Milankovich cycles if you want to discuss them. Try Wikipedia for a start.
    0 0
  23. #2 thingadonta I guess that's why anomalies are used instead of actual temperatures.
    0 0
  24. The description of precession causing a complete annular rotation of the seasons is false; it's science-fiction. There are two underlying fallacies - one degree of shift every 72 years (known) is the same as one day of season shift (a magic trick at best). The second is the circular season: if there's any effect, it will be advance and retreat. Even that interpretation doesn't match the older ice age cycles of 41,000 years. The easiest exposure of the nonsense is solstice and equinox celebrations - they'd be shifted by over a month from ancient times. They haven't done that. In fact, the northern hemisphere planting season moved later by over a week between 1940 and 1975, and has retreated by over two weeks since then. Like the skit said - "The Milankovich cycle don't enter into it. That theory is dead."
    0 0
  25. michael sweet at 23:10 PM, of course you are right, I was looking at it from the perspective of the precession rather than that of the calender. I had overlooked the leap years, and mans ability to change the calender and thus the climate, in a manner of speaking. However the precession continues it's cycle irrespective of mans adjusting the calender, but adjusting the calender so that defined seasons don't shift on the calender disguises the fact that oils ain't oils, in this case, the orientation of the planet is not the same each repeating solstice or equinox as perhaps more easily shown on this chart. Effects of axial precession on the seasons 
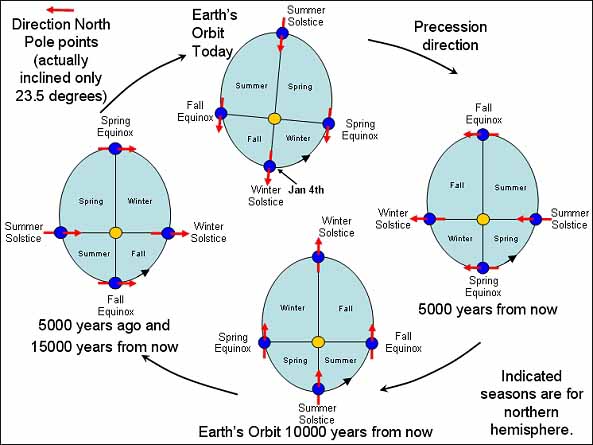
This figure illustrates the effects of axial precession on the seasons, relative to perihelion and aphelion. The precession of the equinoxes can cause periodic climate change because the hemisphere that experiences summer at perihelion and winter at aphelion (as the southern hemisphere does presently) is in principle prone to more severe seasons than the opposite hemisphere.
    0 0
  26. Peter Hogarth at 09:46 AM, whilst different cloud cover data sets may be differing in what they are measuring, as the graph shows there is quite a degree of variation, and depending on the type of clouds, any variation will either vary the incoming solar radiation, or the outgoing thermal radiation, or both. Given that clouds cover about 2/3 of the earths surface, a small change in coverage makes a significant difference, a change of about 5 percent roughly corresponds to a significant radiative net change of about 0.9 W/m2.
    0 0
  27. Johnd, The Milankovich cycles affect very long term climate, beyond one human life. It is known that these currently are a net cooling forcing, not a warming forcing. AGW has overwhelmed this effect and converted the trend into warming. This does not affect the timing of seasons and the response of animals and plants to those changes referred to by Steve in post 11. The timing of the seasons is a clear mark of AGW in the empirical evidence.
    0 0
  28. michael sweet at 00:55 AM, whilst I'll concede that the timing of the seasons is constantly adjusted to accommodate slippage bought about by orbital cycles, as the chart above indicates the two seasons that are most subject to change due to changing orientation are spring and autumn, granted over a long period of time, but an ongoing process none the less. As we have discussed before, there are more factors that determine the timing of the seasons than just temperature or the calender. Seasons can begin and end early or close late for a variety of reasons. This year for instance in south eastern Australia people could be forgiven for think that spring came 6 months early and we went from spring to summer and then straight back to spring again such was the response of the plants and the animals that depend on them, all due to the amount of water vapour that cycled through the hydrological cycle.
    0 0
  29. Johnd, If people noticed that you had no winter that is a predicted sign of global warming. You claimed that the seasons were not shifting in post 12. Now we agree that the seasons have shifted so much that people are noticing it. Thats what scientists call "Climate Change". There is more water in the hydrological cycle because of increased temperature of the atmosphere and ocean. Increased temperature is caused by increased CO2. This was forcast decades ago. Water responds to temperature change. Water does not force temperature to change. Yes, it is complicated, but the base of the pyramid of climate change is CO2 forcing in the atmosphere.
    0 0
  30. Vis-à-vis fretslider's inquiry on the article discussing the PBS show featuring Anthony Watts: (1) fretslider alleges NOAA "ain't so sure" with reference to a project undertaken to "better understand the thermal impacts of buildings with parking lots on air temperature measurements". [first quoted phrase from freslider's comment, second from NOAA report.] To which it must be said fretslider has failed to demonstrate that there is any reason to doubt that the US temperature record is, for the purposes of global climate science, satisfactorily accurate on the basis of an experiment designed to better understand a phenomenon. In addition, I find fretslider's insinuation of dishonesty on the part of NOAA, given the lack (as far as I can see) of any evidence to support such insinuation, concerning. Finally, I question whether NOAA's project viz. its thermal impacts experiment has anything to do with the "questions" raised (or more accurately, allegations made) by Watts.
    0 0

You need to be logged in to post a comment. Login via the left margin or if you're new, register here.


The Consensus Project Website

THE ESCALATOR

(free to republish)


© Copyright 2024 John Cook
Home | Translations | About Us | Privacy | Contact Us