Climate Science Glossary

Term Lookup

Enter a term in the search box to find its definition.

Settings

Use the controls in the far right panel to increase or decrease the number of terms automatically displayed (or to completely turn that feature off).

Term Lookup

Settings


All IPCC definitions taken from Climate Change 2007: The Physical Science Basis. Working Group I Contribution to the Fourth Assessment Report of the Intergovernmental Panel on Climate Change, Annex I, Glossary, pp. 941-954. Cambridge University Press.

Home Arguments Software Resources Comments The Consensus Project Translations About Support

Twitter Facebook YouTube Mastodon MeWe

RSS Posts RSS Comments Email Subscribe


Climate's changed before
It's the sun
It's not bad
There is no consensus
It's cooling
Models are unreliable
Temp record is unreliable
Animals and plants can adapt
It hasn't warmed since 1998
Antarctica is gaining ice
View All Arguments...


Username
Password
New? Register here
Forgot your password?

Latest Posts

Archives

Ocean cooling: skeptic arguments drowned by data

Posted on 6 September 2010 by gpwayne

In 2008, climate change sceptic Roger Pielke Sr said this: “Global warming, as diagnosed by upper ocean heat content has not been occurring since 2004”. It is a fine example of denialist spin, making several extraordinary leaps:

  • that one symptom is indicative of the state of an entire malaise (e.g. not being short of breath one day means your lung cancer is cured).
  • that one can claim significance about a four year period when it’s too short to draw any kind of conclusion
  • that global warming has not been occurring on the basis of ocean temperatures alone

So much for the hype. What does the science say about the temperature of the oceans – which, after all, constitute about 70% of the Earth’s surface? The oceans store approximately 80% of all the energy in the Earth’s climate, so ocean temperatures are a key indicator for global warming.

No straight lines

Claims that the ocean has been cooling are correct. Claims that global warming has stopped are not. It is an illogical position: the climate is subject to a lot of natural variability, so the premise that changes should be ‘monotonic’ – temperatures rising in straight lines – ignores the fact that nature doesn’t work like that. This is why scientists normally discuss trends – 30 years or more – so that short term fluctuations can be seen as part of a greater pattern. (Other well-known cyclic phenomena like El Nino and La Nina play a part in these complex interactions).

Looking at the trend in ocean heat, this is what we find:

Source: Levitus 2009

There are, however, disputes about the accuracy of Argo buoys and expendable measuring devices dropped into the sea, and the reporting of temperatures down to only 700 metres. How do scientists resolve these kind of disputes – bearing in mind that such disputes are the very stuff of science, the essence of true scepticism? One way is to find more data sources – different ways of measuring the phenomenon in dispute. By using results from seven different teams of scientists, all using different tools and methods, we are able to see a clear trend. And while there is variation between team results due to the differences in technique and measurement methods, one thing they all agree on: long term, temperatures are going up.
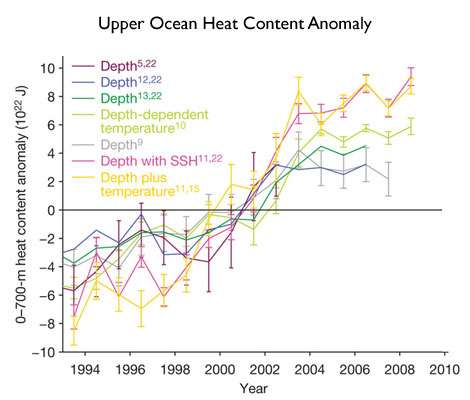
Source: Lyman 2010

The reaction of the oceans to climate change are some of the most profound across the entire environment, including disruption of the ocean food chain through chemical changes caused by CO2, the ability of the sea to absorb CO2 being limited by temperature increases, (and the potential to expel sequestered CO2 back into the atmosphere as the water gets hotter), sea-level rise due to thermal expansion, and the amount of water vapour in the atmosphere.

While there is a great deal we don’t know about how the oceans behave, we do however know that it’s safer to discuss all aspects of climate change using multiple sets of data, rather than just one, as Pielke Sr did. If ocean heat is a guide, then global warming is still on track to cause great disruption if we don’t modify our actions to reduce the release of anthropogenic CO2.

Claims that global warming is not happening on the basis of short-term ocean temperatures are not supported by the evidence.

This post is the Basic version (written by Graham Wayne) of the skeptic argument "Does ocean cooling prove global warming has ended?".

0 0

Printable Version  |  Link to this page

Comments

Comments 1 to 39:

  1. •that one symptom is indicative of the state of an entire malaise You don't really state the importance of OHC. From memory 80-90% of the energy in the system is entering the oceans. You really need to quantify the importance of that symptom. This isn't shortness of breath, this is a shadow on an x-ray. •that one can claim significance about a four year period when it’s too short to draw any kind of conclusion On this website I see no such reluctance to call accelerating Greenland ice loss on the basis of a 7-8 year GRACE record. Consistency across all metrics would be a good start. •that global warming has not been occurring on the basis of ocean temperatures alone I'd go back to my first answer. If we could get this right it would probably be the best measure of heat build up in the system. It seems well worth making this an important metric.
    0 0
    Moderator Response: I think the acceleration is rather different. In the first place, I've been following the GPS studies (embedded in bedrock), physical studies, satellite data and other sources for a while now, so it is not just the Grace record we're looking at. And an 8 year acceleration is a very clear signal. What it means overall needs more time to get a better and more appropriate trend line, but it is pretty indicative of one thing - that negative mass balance has been consistent and growing over most of a decade - and longer when you look at other records. But mainly, my point would be that I'm not attaching claims to the mass balance record, merely reporting the data. Pielke takes a single short period and pronounces AGW not happening. He does it again in a little defence he's written (link is below). You say "global warming has not been occurring on the basis of ocean temperatures alone" and I agree. Evidently, Pielke thinks differently. And one other thing - if the oceans have not been warming, what is causing all the Arctic ice to melt?
  2. The acceleration of Greenland ice loss is NOT based purely on the records from GRACE. There are records going back to the 1950s. http://www.skepticalscience.com/Greenland-rising-faster-as-ice-loss-accelerates.html
    0 0
  3. Looking at the trend in ocean heat, this is what we find (Source: Levitus 2009) No, we do not. There is a revised and updated version at the NOAA Global Ocean Heat Content page by the same authors. The main difference is that the updated version in 2006 starts to diverge from the published OHC reconstruction. Now it is decreasing slightly instead of the former increasing trend. The difference is about -1022 J in less than 2 years.
    0 0
  4. Well, whatever the direction of the last couple years, it is very clear to me why Pielke did not use 2001 as the starting point for his claim.
    0 0
  5. Levitus 2009 is bogus anyway. They suppose a large jump in OHC at the turn of 2002/2003. It is about 7.3×10²²J during the forth quarter of 2002 and the first two quarters of 2003. If it were true, this energy had to come from somewhere. As the oceans have by far the largest heat storage capacity in the climate system, no internal heat reservoir can supply this heat, it can only come from outside. To support this sudden OHC increase, there should have been a transient drop of 6 W/m2 in OLR (Outgoing Longwave Radiation) at TOA (Top of Atmosphere), but nothing like that was seen by satellites. 6 W/m2 is huge and there is no way to miss it. It is equivalent to a 1.6°C drop in the effective temperature of Earth as seen from space.
    0 0
  6. Berenyi Peter, If you look at the graph, it's impossible to miss the noise; ascribing the accuracy you do to a single quarter's information is laughable. gpwayne I think the explanation is good, but I'd suggest not quoting Pielke in the opening paragraph; it sets up the piece as ad-hom rather than pro-science (I know that's not the intent). HumanityRules I guess whether or not 7-8 years is a trend depends on the signal to noise ratio of the data as well as the time period. I've no idea what the GRACE data looks like personally.
    0 0
    Moderator Response: [graham] Hey VTG - nice to see you! I know what you mean about the quote - see below for link to Pielke's response, characterising it as an ad-hom - but in truth all these 'basic' rebuttals are being written to be consistent with the intermediate versions. John Cook chose to use the quote as a fair representation of the overall skeptical argument, and I don't believe it is inappropriate. In fact, reading Pielke's defence rather confirms my point - but see what you think for yourself.
  7. Not so fast. Waar blijft de energie van het versterkte broeikaseffect?. "The analysis of Levitus et al (2009) also shows, however, that the energy uptake of the oceans between 2004 and 2008 is stalled, at least in the upper 700 m (red dotted line in Figure 2). There is no reason to believe that the radiation budget at the top of the atmosphere during this period was in balance. Trenberth and Fasullo did not know where the anthropogenic greenhouse energy, which since 2004 has accumulated in the climate system has gone. They consider it very unlikely that this energy as a whole accounted for melting of sea ice and ice of glaciers, ice caps and permafrost." Roughly Translated
    0 0
  8. BP:If it were true, this energy had to come from somewhere. As the oceans have by far the largest heat storage capacity in the climate system, no internal heat reservoir can supply this heat, it can only come from outside. The upper ocean is directly attached to the lower ocean. Too little is known about the vertical component of ocean currents. But your (BP) next statement: To support this sudden OHC increase, [assuming no connection between upper and lower ocean] there should have been a transient drop of 6 W/m2 in OLR (Outgoing Longwave Radiation) at TOA (Top of Atmosphere), but nothing like that was seen by satellites. leads to the conclusion that ....
    0 0
  9. I love the comparison with lung cancer and shortness of breath! That choice of an example is hard hitting, succinct, and persuasive.
    0 0
  10. Answering 3^ Very Tall Guy: yes, it does, but in a basic version, we really do want to avoid terms like SNR. The target audience just blanks out and stops reading it. This is unfortunate, since it is not THAT hard a concept, but that is the reality we have to deal with.
    0 0
  11. BTW: a word like 'monotonic' really doesn't belong in a basic version either. I first saw the word in a High School Calculus class. Those who didn't get that far have never seen it.
    0 0
  12. It might be worth stressing that the Levitus study relates to the upper ocean, top 700m, that the Argo floats sample down to 2000m, the average depth of the oceans is 3800m and the maximum over 10,000m. There is a lot of uncertainty about what is happening down deep and the change of heat content of the top 700m is the difference between the heat flux in from above and the heat flux out to deeper levels
    0 0
  13. Perhaps also as a general point wrt the basic versions. Should they link to the scientific papers directly, or should they link to the corresponding sections on the intermediate level. I also think the second graph is confusing for a basic level description. You need to go to the paper to understand the significance of the different lines and the whole point of basic posts is to avoid that level of complexity.
    0 0
  14. 4.Gordon "it is very clear to me why Pielke did not use 2001 as the starting point for his claim." The ARGO system that measures OHC saw a huge expansion in instruments around 2003. This gave something closer to global coverage. It makes sense to highlight a 'complete' data set and avoid comparing this to a spatially and temporally weak data set. As BP has pointed out energy in the ocean should be a relatively stable beast, it's difficult to generate real world mechanisms that allow large, fast shifts in the amount of measured energy once you have a reliable, global measuring system. 8.Pete Dunkelberg and 12.Glenn Tamblyn Classical theory of the oceans is that energy is only slowly transferred to greater depths. I'm not against overturning concensus ideas but ........
    0 0
  15. I think Trenbeth is right that this is a very sad state of affairs (not being able to show where the heat is). If you think of the ocean as a water heater (cylinder for some readers) - you can maintain incredible stratification. I have seen 40F at the bottom of a 4 foot tank and 140F on the top (ie 55C across 1.3 meters). But this requires NO mixing! So if the oceans are mixing, that kind of stratification is not going to happen. It is relatively hard to get warmer water to go DOWN a column of water. I will be very surprised if we find oodles of heat at lower depths. Which, to my mind, makes it a mystery. It is one the VERY few chinks in climate theory. As you blast away at my comment - no need to tell me I have oversimplified - I promise that I know that!
    0 0
  16. Glenn Actually there have been studies of Ocean Basins. Interestingly the Basin that is warming the most is the South Ocean and there have been basins in the North that have cooled. The Dutch paper touches on some of that. Waar blijft de energie van het versterkte broeikaseffect? I find it rather interesting that we don't see weather in the oceans like we do on the surface. Maybe it is there but at a much slower time scale.
    0 0
  17. BP #5 I fear that you are creating false expectations that the measurement model for ocean heat can be more precise than is currently possible. I'd expect to see detailed statistical work demonstrating the validity of the problem you allege that you have observed, not just a mere assertion, which is the current status of what you have written. On a related note, I see that you are allowing an accusation that you may be engaging in scientific fraud to go unchallenged.
    0 0
  18. Conservation of energy is fairly classical, and much better known than ocean currents.
    0 0
  19. You seem to have riled the beast. :) Skeptic and denier do seem to be inappropriate with regard to Pielke snr. 18.Pete Dunkelberg Agreed but there is absolutely no reason to believe that energy is transferred to the deep at rates that would clear up the missing heat problem, as things stand we almost certainly have to look somewhere else.
    0 0
  20. Re: HR (19) Thanks for the Pielke link. Perhaps it's just me, but does anyone else see the irony in this quote from the link:
    "What would be useful is for the weblog Skeptical Science authors to discuss the value of using (and issues with using) the accumulation of Joules in the climate system as the primary metric to monitor global warming."
    and that Pielke allows no comments on his post urging more discussions at Skeptical Science? The Yooper
    0 0
  21. OK girls and boys - I see the link to Pielke's item is already up here. As Daniel points out (beating me to it) we have a blog here on which he could have debated the issue. Instead, we get a defence on his site without the option to discuss it. Personally, I think he's making some rather odd assertions, including playing the rather sad 'victim' card. Still, if your argument don't quite add up, I guess a bit of emotionalism will cover the cracks, right Roger?
    0 0
  22. Dumb question: I would expect "nondenialists" and/or real field experts claim that the methodology for gathering data has improved immensely since the 1950's, and that since there is now more data, the "real" ocean temperature over time is being acquired. Meanwhile, however, it has supposedly been increasing. How does one differentiate these two effects?
    0 0
  23. AT @15 - "It is relatively hard to get warmer water to go DOWN a column of water" More pieces of the puzzle seem to be emerging all the time Observational evidence for an ocean heat pump induced by tropical cyclones (Sriver 2007) & Climate change: Tropical cyclones in the mix
    0 0
  24. 20.Daniel Bailey From reading his posts I get the feeling Pielke is happy to engage with climate scientists of all shades. I can understand why he wants to avoid moderating comments while at the same time being frustrated by it. 21.gpwayne Erm are we reading the same thing? It's all about science. Can you quote the emotionalism? The only time he gets personnal is to refute your name calling and even then he uses his peer-reviewed work to show your error rather than claims of victimhood. 23.Dappledwater These seem still only to describe mixing in the upper ocean (above 1km). This is not a mechanism to get the energy to depths were it can't be measured by ARGO.
    0 0
  25. HR @24 - "This is not a mechanism to get the energy to depths were it can't be measured by ARGO." I didn't suggest it was, I would have said so otherwise. Regardless, interesting that such a short lived event "may" be a significant player in ocean heat transport.
    0 0
  26. The '2004-2009 anomaly' on which Pielke Sr. clings is probably from the huge latent heat from the arctic ice loss - which also happened to be at a very high level in the 2004-2009 interval - combined with the constant decrease in solar output consistent with the downward trend of the solar cycle!
    0 0
  27. gpwayne@6 Pielke says "with respect to the diagnosis of global warming using Joules of heat accumulation in the oceans, snapshots of heat content at different times are all that is needed. There is no time lag in heating or cooling. The Joules are either there or they are not. The assessment of a long-term linear trend is not needed." Now it strikes me that fundamental here is the variability in the data. Be it via measurement error, bias caused by changing currents, changes in the balance of latent (ice melt) vs sensible heat etc etc, there is inherent variability. Personally, I'd look for changes beyond 2 sigma as a basic test as to whether a claim was significant or not. I'd guess that Pielke's assertion that snapshots are meaningful fails this test, in the same way that BP's use of quarterly data isn't meaningful. I had a quick look for the raw data, but it's in too complex and fragmented a form on the NOAA site for me to run a regression quickly. I'd guess that the natural variability precludes any quantitative use of the data without at least looking at a 5 and maybe 10 -20 year period. Anyone more competent than me able to give us the trend since (say) 1970 and the standard deviation of residuals of the 12 month and three month averages ? Does anyone other than Pielke and BP seriously think individual datapoints can be used as a snapshot to calibrate the overall global heat balance ?
    0 0
  28. HR #14 Good points HR. BP #5 has of course thrown a very big spanner in the OHC works. Moderator John has produced a rerun of the chart of OHC for the top 700m from a prior thread: "Robust warming of the upper oceans" here: http://www.skepticalscience.com/news.php?p=2&t=78&&n=202 Please re-read BP#6,#16,#30,#45,#72, and my own humble contributions #24, #43, #60. I think that we showed that the jump in the OHC chart in the 2002-03 period was impossible; and most probably an artifact of the XBT to Argo transition - ie; an offset. Yet 'scientists' simply did a linear curve fit through this composite chart and called it 0.64W/sq.m rise in OHC equivalent for 16 years. Yet if you average Lyman's 7 curves on the 2010 chart from 2003-2010 - it is pretty flat - strangely coinciding with the full deployment of Argo. Could it be that better Argo measurement has shown little if any OHC increase for the last 7 years? Could that possibly mean that far less extensive and inaccurate XBT measurements prior to 2002 were not very reliable, and that the whole OHC story prior to 2002 is likely to be as useful as a third armpit? Which punches a hole right through the theory of an increasing warming imbalance of the order of 0.9W/sq.m. And you all wonder why there are sceptics? Hello?
    0 0
  29. macwithoutfries and others: I don't think the latent heat associated with melting ice is large enough to play much role in this question. Unless I'm getting my orders of magnitudes scrambled, melting one gigaton of ice requires 333.55 x 10^17 J. Let's consider both sea ice and land ice. Over the past decade, according to PIOMAS, the Arctic Ocean has lost around 500-1000 km3 of sea ice volume per year, depending on what you pick as starting and ending dates. This works out to around 1.5 to 3 x 10^20 J/year. Sea ice in the southern hemisphere mostly disappears every year, so it's not really relevant. For land ice, NSIDC says that in recent years melting land ice has contributed 1.19 mm/year to global sea level rise (1993-2003 ... presumably more since 2003, but this is good enough for now). This corresponds to 433 gigatons/year, or 1.4 x 10^20 J/year. So ... the latent heat taken up by melting sea and land ice has been on the approximate order of 4 X 10^20 J/year. This is a couple of orders of magnitude smaller than the values being quoted in this thread for upper ocean heat content anomaly.
    0 0
  30. Ken #28 Please explain why in a large complex, difficult to measure system like the ocean, that you never discuss issues relating to measurement uncertainty? This glaring omission really detracts from your argument, and if you want to be taken seriously you need to address it.
    0 0
  31. Question: can someone explain how the Argo float data is used to infer a global average temperature. This sounds like a naive question I know but it crosses my mind that samples made by buoys carried by ocean currents and subject to periodic submersions may not produce an unbiassed sample and some adjustments would be needed.
    0 0
  32. Good question, LazyTeenager. Go to the Argo home page and look on the left side for the links about Argo Data. A key is "gridding," which is construction of a single temperature per geographic grid cell, which provides equal weighting per geographic area.
    0 0
  33. MattJ @9: Shadow on lungs does not automatically equate with lung cancer. It could be TB, a viral infection, and a host of other illnesses. I'd choose another metaphor :-) Or maybe stick with the metaphor - if BP & HR are right then the metaphor may well be apt - the shadow mightn't be quite what we think it is.
    0 0
  34. Ned #29 Could it be that (at least since around 2005) the model behind PIOMAS might be way too conservative ? - see ICESat and the end on this graph If the actual volume lost from 2005 to 2010 would be in the range of 10000 km3 things already start looking a little different ...
    0 0
  35. macwithoutfries, the difference between the PIOMAS and ICESat results on the graph you show is actually fairly small... and if 10,000 km^3 of Arctic sea ice had been lost since 2005 the total would now be negative. :] We should see how well PIOMAS has done when Cryosat II data starts getting released in the next couple of months. BTW, PIOMAS just updated earlier today with results through 8/31. Looks like the anomaly is at about -9,500 km^3. Given that's against a baseline of ~14,000 km^3 that puts the total volume around 4,500 km^3. The previous record minimum (last September) was 5,800 km^3... and we haven't hit the minimum for this year yet.
    0 0
  36. Obviously, there is a lot less ice than there used to be (on both land & sea) and the energy used to melt that ice had to come from somewhere. So yes, that would tend to reduce the apparent warming of the ocean and atmosphere. But the magnitude of that latent heat is pretty small, even if PIOMAS were severely underestimating ice melt. Melting all the normal Sept. sea ice in the Arctic (~13400 km3) would take around 6.7 * 10^20 J. For comparison, the units in the graph of "Upper Ocean Heat Content Anomaly" are 10^22 J, two orders of magnitude larger. I made a typing error (though not a calculation error) in my previous comment up-thread. Melting one gigaton of ice is 3.3355 * 10^17 J, not 333.55. The calculations in that comment were done using the correct number; I just wrote the wrong one when transcribing it here. Sorry!
    0 0
  37. Note to Pielke Snr. Please read Lyman et al. (2010) and Trenberth's article in the same issue. Also, like temperature, surely you must know that in climate science one is interested in long-term trends, and not cherry-picked short-term trends. Global temperatures have not increased much since 2004, so what? The long term (and statistically) significant trend in global SATs and OHC are both up. So you referring to changes over short windows as with OHC (and global sea levels) IS misleading and misinformation, so please do not throw stones in glass houses. Also, why are no comments allowed on your blog? This does not facilitate constructive dialogue. Note to John Cook and GPWayne: He won't admit it, but Pielek Snr's language and commentary on AGW routinely come across as being those of someone who is a "skeptic". That said, I do not think it accurate to conflate/associate Pielke Snr's comments with misinformation tactics used by those in denial of AGW. Perhaps some rewording is required to reflect his actual position. We want to get the facts correct, right? Anyhow, hopefully this can be solved amicably.
    0 0
  38. All I know is the comparative heat map of the oceans displayed on www.globalboiling.com at Seatemps clearly show much hotter sea surface temperature readings every night from the nightly satellite than even the year of Katrina which had been the hottest readings. (except when a hurricane has recently cut a path through the heat and taken some away) and today's radar measurement of the north pole ice shows far less ice than even the least ice ever measured previously right here at nightly radar measurement of polar ice Those are nightly current satellite measurements and are not "subject to interpretation". They are there for everyone to see each day.
    0 0
  39. Many posters have alluded to a lack of a mechanism for transporting surface heat to the abyssal depths. Here is my take on this problem, please let me know if I have gone off the rails on this. As cold water moves from the antarctic it warms. As it warms more water is evaporated thus causing an increase in salinity. Some of this evaporated water will rain out over land thus the salinity will not be reduced. As the water goes further north it warms even more and we experience an El Nino event. This warm water evaporates and becomes even more saline. Since the equator seems to act a a barrier to further movement of the water it remains at rest when it nears the equator (at least it will not go further north). It warms even more, more is evaporated and it becomes even more saline. The more saline it becomes the more dense it becomes. Eventually it become so dense that it begins to sink into the less dense (less saline) water below. When this happens the El Nino is over and the water is replaced by cooler less saline water from further south and we experience a La Nina. This warm, highly saline water eventually makes it to the abyssal depths where it remains for a long time. There are a number of papers coming out showing an increase in the temperature of the abyssal water but it is still spotty so it is difficult to measure the increased energy content of this part of the ocean. Hopefully more research will be forthcoming in this very relevant area.
    0 0

You need to be logged in to post a comment. Login via the left margin or if you're new, register here.


The Consensus Project Website

THE ESCALATOR

(free to republish)


© Copyright 2024 John Cook
Home | Translations | About Us | Privacy | Contact Us