


 Arguments


Battered by extreme weather, Americans are more worried about climate change
Posted on 20 November 2017 by dana1981
The latest climate change survey from Yale and George Mason Universities is out, and it shows that Americans are still poorly-informed about the causes of global warming. Only 54% understand that it’s mostly human-caused, while 33% incorrectly believe global warming is due mainly to natural factors.
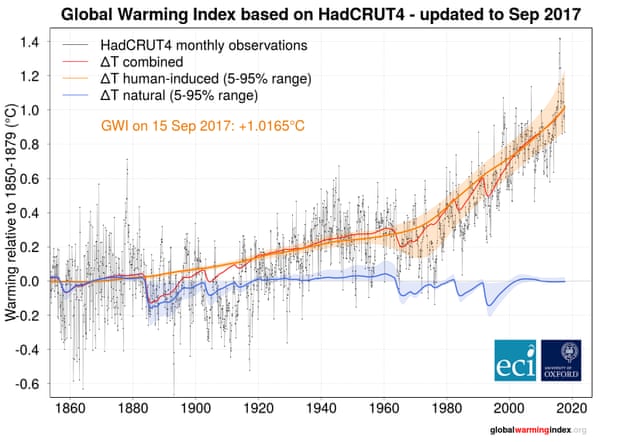
In fact, a new study published in Nature Scientific Reports developed a real-time global warming index. It shows that humans are responsible for 1°C global surface warming over the past 150 years – approximately 100% of the warming we’ve observed. Lead author Karsten Haustein explained their new index and study in a blog post.
Americans are nevertheless growing increasingly concerned about climate change. A record 22% are very worried about it (double the number in the March 2015 survey), and 63% of Americans are at least somewhat worried about climate change. That’s probably because they perceive direct climate impacts – 64% of survey participants think that global warming is affecting the weather, and 33% said it’s having a big influence.
Global warming is intensifying extreme weather
Americans also connecting the dots to specific extreme weather events. About 54% said that climate change worsened the extreme heat waves, wildfires, and hurricanes that pummeled the country in 2017.
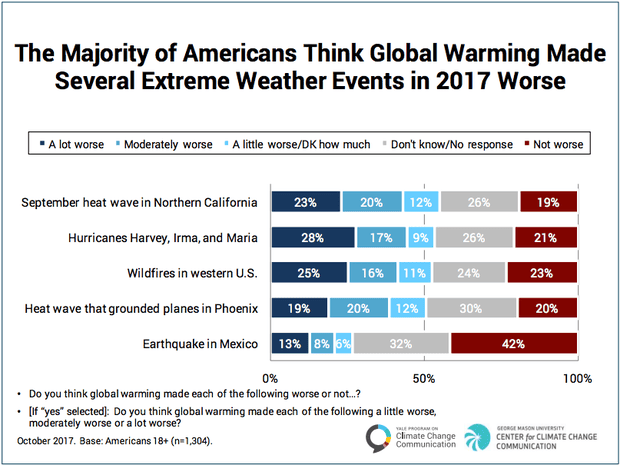
They’re generally correct; in fact, a recent study by MIT climate scientist Kerry Emanuel found that global warming made the extreme precipitation associated with Hurricane Harvey (the largest rainfall of any US hurricane on record) more likely. Previously a 1-in-100 year event for Texas and 1-in-2000 year event for Houston, Harvey’s extreme precipitation has already become a 1-in-16 year event for Texas and a 1-in-325 year event for Houston – six times more likely due to human-caused global warming.
At the same time, only 15% of Americans realize that the expert consensus on human-caused global warming is over 90%. That’s an important result because the expert consensus is a ‘gateway belief.’ Research has shown that support for climate policy is linked to perceptions about scientific agreement on climate change.
Americans are pessimistic about the future climate
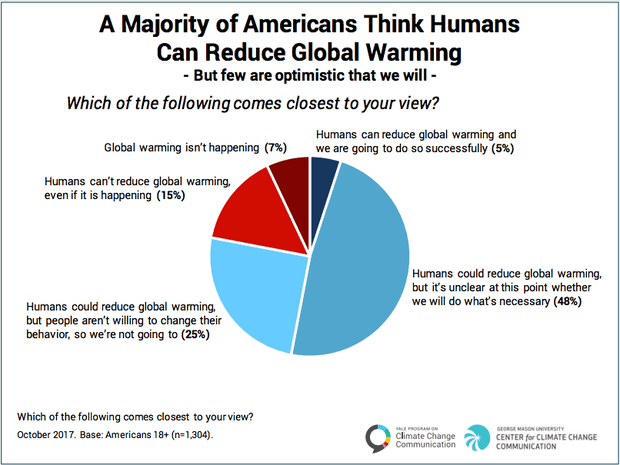
The survey also found that Americans are very pessimistic about the odds that we’ll successfully tackle the threats posed by global warming. While 78% realize that humans could potentially slow global warming, only 5% of Americans believe we’ll be successful in doing so. A quarter of those surveyed think that we’ll fail because people are unwilling to change their behavior, and 48% said it’s unclear at this point whether we’ll take the necessary action.
Given the current state of affairs in the Trump administration, that pessimism is certainly justified. However, there are still reasons for hope, especially since the climate-denying Republican Party is beginning to lose its grip on power.


Regarding lack of reporting of 97% consensus in media. The media don't report this as IMO they prefer to keep controversy alive as it makes news. They like to make out theres huge difference of opinion to keep stories going.
This is irresponsible and has to stop, because its deadly serious issue. Media have a duty of care to society to inform people of consensus.
Yes I think bad weather is clearly making people take notice.There is much we can do individually about climate problem, without having to be forced, but humans are followers. It also needs strong political and business leadership, plus carbon fee and dividend scheme.
A few observations
1) The line representing the natural variations shows no increase for the 2015/2016 el nino,
2) The line representing the natural variations shows no warming for the warming side of the pdo/amo cycle which was generally credited from the early 1980's through the late 1990's,
3) the line representing the natural variations shows no effect for the emergence from the little ice age,
4) The line representing the natural variations shows no effect for the long term general increase in solar radiance for the period from 1850 through 2015.
That is just the first four items in the study that jump out which do not reconcile with known natural events..
weather.plus/total-solar-irradiance-tsi.php
lasp.colorado.edu/home/sorce/data/tsi-data/
www.iceagenow.info/historical-total-solar-irradiance/
[DB] Off-topic snipped.
I was going to point out to Tom13 that his statement that solar irradiance has increased from 1850 to 2015 is totally false. Any solar astronomer knows that the sun has been slightly cooler than normal for decades, and this is forecast to continue for at least a few more decades. It's called a Maunder Minimum.
Tom13@3 said: "The line representing the natural variations... [doesn't match the natural drivers that I think it should match]" Tom, the line is from a physical model of the atmosphere and its climate drivers. If you think you have a superior understanding, the obvious request is that you build your own model, make predictions with it from 1850 on, and see if it does a superior job. Otherwise, its like someone building the Golden Gate Bridge, and you saying "I could have done better." Well, talk is cheap...
You're speaking on behalf of an industry that makes a trillion dollars a year in pure profit. Don't you think they can afford a model? Case in point: you think models from 1850-on should reflect some 'rebound' from the Little Ice Age. But the LIA ended around 1700. Why should there be 'rebound' and how much 'rebound' should there be? And that's why you need a model: so you can put that in and prove it matters. People who actually build models don't include effects, like the LIA, that they don't think applies. That's their perogative. You can insist on deaf ears that they do it anyway. But if you can't lean on your incredibly wealthy fossil friends to build a competing model, you'll be ignored. The scientists are not including the LIA to be nasty to you. They genuinely don't think it matters. If you do, prove it.
Tom @3
1) The line representing the natural variations shows no increase for the 2015/2016 el nino,
It doesn't show 2015 el nino spike, and any other el nino. This is probably because El nino / la nina is a repeating very short term cycle, that doesnt show a long term trend upwards or downwards. Its flat in other words on time scales more than a decade.
"2) The line representing the natural variations shows no warming for the warming side of the pdo/amo cycle which was generally credited from the early 1980's through the late 1990's,"
It doesnt show pdo warming, or cooling side either, because its a roughly 20 year cycle upwards and downwards so not driving longer term trends. Its also not big causal factor in warming, its affects are complicated, and trend was peaking in 1980 and falling gradually after 1980. See article below.
www.skepticalscience.com/Pacific-Decadal-Oscillation.htm
"3) the line representing the natural variations shows no effect for the emergence from the little ice age,"
Thats because theres no such effect. An emergence is just a vague word, not something quantified.
"4) The line representing the natural variations shows no effect for the long term general increase in solar radiance for the period from 1850 through 2015."
Theres no long term general increase. There was increase in solar irradiance from approx 1920 - 1980 which is reflected in the slight positive slopes in the global warming "index" graph in article over those periods. I'm going from data on solar irradiance here from 'sorce', the official people who compile this as below:
lasp.colorado.edu/home/sorce/files/2011/09/TIM_TSI_Reconstruction-1.png
It's also important to recall effect of solar irradiance changes is much less in watts / m2 than CO2.
"My citation to the two solar radiance links, both of which show a general long term increase in solar radiance are directly on point"
Your citation is someones weather blog, that is unclear on original source on data, and shows two contradictory graphs. The actual real data is as follows from 'Sorce' as I stated above.
[PS] If Tom13 is trying to indicate that climate is not following natural forcings or that models fail to reproduce past variations, then it would helpful if he and commentators would reference 5.3.5.3 of the IPCC WG1 report (or the referenced papers). The relevant graphic is here showing temperature reconstructions, simulations from models and natural forcings.
What Americans do or don't believe is hardly a measure of anything but gross ignorance. After all, survey after survey shows that 40% of them think that the world was created around 6000 years ago and deny the theory of evolution.
The 40% of Americans in denial of evolution are probably the same group sceptical of climate science, and vaccines, and they are probably the same people who believe the moon landings were fake, and 911 was an inside job. Foolishness and ignorance loves company.
Just out of interest I googled my own speculation, to try to find some evidential support, and first hit was interesting article on conspiracy theories by Scientific American as below "Why people believe in conspiracy theories":
www.scientificamerican.com/article/moon-landing-faked-why-people-believe-conspiracy-theories/
Some tasty little samples:
"A popular example of such higher-order beliefs is a severe “distrust of authority.” The authors go on to suggest that conspiracism is therefore not just about belief in an individual theory, but rather an ideological lens through which we view the world."
"Interestingly, belief in conspiracy theories has recently been linked to the rejection of science. In a paper published in Psychological Science, Stephen Lewandowsky and colleagues investigated the relation between acceptance of science and conspiricist thinking patterns. While the authors' survey was not representative of the general population, results suggest that (controlling for other important factors) belief in multiple conspiracy theories significantly predicted the rejection of important scientific conclusions, such as climate science or the fact that smoking causes lung cancer. Yet, rejection of scientific principles is not the only possible consequence of widespread belief in conspiracy theories. Another recent study indicates that receiving positive information about or even being merely exposed to conspiracy theories can lead people to become disengaged from important political and societal topics."
[PS] Just a little note to commentators to say "Eagleflight" was yet another manifestation of banned serial sockpuppet cosmowarrior et al. Removed and thread cleaned of all references. Sorry to those who wasted time replying this idiot. You were wasting your time.
The graph in figure 1 asserts the warming attributable to natural forcings since circa 1860 has been flat. That assertion would seem highly unlikely. As previously noted, the blue line representing the natural forcings, do not include then AMo/PDO cycles, nor the El nino spikes, nor the increase in TSI (with the links previously attached), which has shown a general long term upward trend (albiet with a small down turn since the mid 1950's while still maintaining the general upward trend).
Those well known factors are not incorporated in the blue line representing the natural forcings.
[JH] Please provide the source for Figure 1 and a link to it.
Figure 1 is the first graph in this article - between paragraph 2 and pargraph 3
Oceanic oscillations by definition cannot sustain a long term trend.
You need to up your game to compete in this forum.
In addition, incoming solar radiation is accounted for in the blue line. You need to click on the links and read them to understand what you're seeing.
Daniel Bailey or SteveS:
Given the scale of the graph, would the impacts of ENSO variations even be discernible?
Tom13,
You are clearly misunderstanding what El Nino is.
Even if you looked into El Nino a little more you might still misunderstand its relationship with global warming. It is complex, but understandable with a little effort.
NOAA is one of the groups that reports its measurement of the status of the ENSO cycle (La Nina, El Nino). It is the NOAA Ocean Nino Index (ONI).
The explanation of the NOAA ONI process is presented by NOAA on the tabulated summary of the ONI values.
The presentation includes the understanding that they need to update the baseline for determining if the Nino 3.4 region of the Equatorial Pacific Ocean is warmer or cooler than average.
The NOAA presentation of their updates of the 30-year averages every 5 years shows that the 5 year averages have been increasing. That increase is not a natural variation. That increase is due to the warming caused by the added GHG created by human activity.
The 30-year averages have increased about 0.3 C. That is significant compared to the threshhold of + 0.5 C for declaring La Nina or El Nino. If NOAA did not adjust the ONI baseline then eventually there would be no identified La Nina events. And with a little more human induced global warming eventually El Nino would be identified as permanent. That would be a massive misunderstanding since the Nino 3.4 would still be cycling warmer and cooler than the average.
Properly understanding many aspects of climate science requires the setting aside of personal preferences for information that excuses a personal desire to benefit from the burning of fossil fuels. Once you have set aside personal belief preferences you will be able to more effectively analyse the legitimacy of information sources.
Warning - if you do not set aside your personal interests you will struggle to properly understand many things, potentially going so far as to believe/claim that information like NOAA's ONI is fake because they revise the numbers every 5 years, and by extension believing that everything from NOAA or NASA or any other major science group that is contrary to your preferred beliefs is fake.
Tom13 @9
The natural variation line in the global warming index graph is flat overall, if by that you mean it shows no upwards trend over the whole period, but it is clearly not flat as a graph. It clearly shows small increase from 1920 to approx 1980. This is consistent with increasing solar irradiance over this period. The reason the slope is small is because solar irradiance is not as powerful a driver as CO2. Solar irradiance was flat as a trend from 1980 - 2016, so obviously would not be represented in the graph other than as a flat line.
Things like le nino and la nina are short term repeating cycles that show no long term trend upwards or downwards. When you put that information in the index the el ninos and la ninas cancel out and you get a straight line. That is why you dont see them in the index. Remember its an index not a temperature trend, in laymans terms its a composite index. The PDO cycle is the same basically.
There are no natural forcings known that would cause the index to slope up over the entire period. Thats just the way it is. If you believe otherwise theres nothing stopping you publishing a research paper.
First of all, I have to agree that including ENSO would be incorrect. However, if one were to do so, I believe you would be able to, on occasion, see an ENSO event on the above chart. Gavin Schmidt is on record as estimating the effect of ENSO on the 2015 temperature as 0.07C (see here). That would suggest that there would be a visible blip at 2015 in the natural line. However, again, that wouldn't be the correct thing to do. My understanding of the blog article by Karsten Haustein is that they were only looking at climate forcings (i.e., things that actually cause the climate to change) and ENSO isn't a forcing.
Let's distinguish carefully between natural forcings (things that change the planetary energy balance and thus climate of natural origin) and internal variability (modes of weather variation due to uneven heating of a wet planet - ie ENSO, PDO etc. This is internal redistribution of heat, not a change in planetary energy balance). Climate is defined formally as 30 year average of weather because shorter time periods are dominated by internal variability. The temperature readings are absolutely a combination of internal variability and long term forcings but internal variability is chaotic and cant be predicted more than few months in advance.
If you want to see how well you can account for the temperature record using just forcing + ENSO, then see the excellent series here. Unlike various mathturbation exercises fitting climate to planets, moon, no. of athetists in world etc. this uses part of the record to determine the fit parameters and then then uses those to predict the other part. However, this cannot be used to predict the temperatures in next decade because ESNO in the future is unknown (and seems to be unknowable).
Possibly. As referred to earlier, analysis shows that 2015 would still have been a record year even had the El Niño never occurred.
And
And
El Niño, La Niña and ENSO-neutral years are all warming. Due to the human burning of fossil fuels.