Climate Science Glossary

Term Lookup

Enter a term in the search box to find its definition.

Settings

Use the controls in the far right panel to increase or decrease the number of terms automatically displayed (or to completely turn that feature off).

Term Lookup

Settings


All IPCC definitions taken from Climate Change 2007: The Physical Science Basis. Working Group I Contribution to the Fourth Assessment Report of the Intergovernmental Panel on Climate Change, Annex I, Glossary, pp. 941-954. Cambridge University Press.

Home Arguments Software Resources Comments The Consensus Project Translations About Support

Twitter Facebook YouTube Mastodon MeWe

RSS Posts RSS Comments Email Subscribe


Climate's changed before
It's the sun
It's not bad
There is no consensus
It's cooling
Models are unreliable
Temp record is unreliable
Animals and plants can adapt
It hasn't warmed since 1998
Antarctica is gaining ice
View All Arguments...


Username
Password
New? Register here
Forgot your password?

Latest Posts

Archives

Ice-Free Arctic

Posted on 7 November 2010 by Riccardo

Talking about ice-free arctic often triggers a lot of shouts and accusations of catastrophism. Yet, we know that the arctic has already been ice-free in summer before. We know it's possible, what is left to understand are the conditions which may produce such an event.

There is evidence (Polyak et. al 2010) that current conditions of an extensively glaciated Arctic were established at the beginning of the Pleistocene, about 3 million years ago. The quaternary glacial-interglacial cycles, governed by orbital cycles, are reflected in the Arctic sea ice extension. At times, average temperature has been 3-5 °C higher than present and totally or almost totally ice-free conditions during summer occured.

It is thought that the main driver of these ice retreats is summer insolation at high latitudes, though regional effects (e.g. the presence of large ice sheets) produce geographically non uniform or delayed retreats. The last occurrence of a maximum in northern high latitude summer insolation was about 10 thousand years ago. It was a generally warmer than present period, but not uniformly so, and the temperature north of 60° was a couple of degrees centigrade above present (Kaufmann 2004).

A recent review on arctic ice variability suggests that "the seasonal Arctic sea ice cover was strongly reduced during most of the early Holocene and there appear to have been periods of ice-free summers in the central Arctic Ocean". This finding lowers the "threshold" for an ice-free summer to a few degrees centigrade of warming.

This fact may come as a surprise. Indeed, IPCC projections of summer arctic sea ice extent, while showing an overall decrease, do not show ice-free conditions up to at least the end of 21st century.

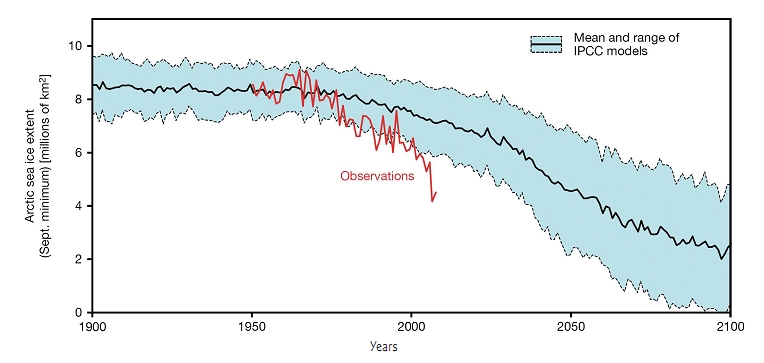
Observed (red) and modeled September Arctic sea ice extent (Copenhagen Diagnosis 2009)

But as the figure itself shows, the projections do not agree well with the real world. Measurements of the ice extent (red curve, updated to 2008) show a much steeper decrease in the last 30 years. Modelling results have shown that "abrupt reductions are a common feature of these 21st century simulations". Ice albedo feedback and increased ocean heat transport are identified as the culprits of these abrupt reductions.

An anticipated consequence of the ice albedo feedback is that the september minimum ice extent reduction trend should at first increase. At some point, the remaining ice extent becomes too small for its reduction to have a significant amplification effect and the decreasing trend slows down. We can easily check where we're now by looking at the NSIDC september ice extent.


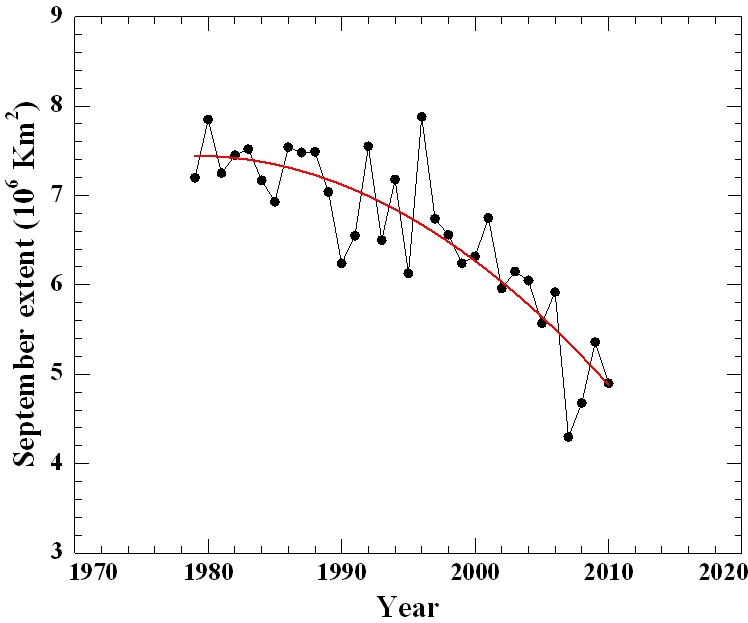
NSIDC september arctic sea ice extent (black) with a second order polynomial fit (red).


The linear fit (not shown) gives a trend of 80,000 square kilometers of sea ice extent loss per year or about 12% of the average over the full period per decade. But the analysis of the residuals shows that a second order polynomial is more appropiate. Then, we can confidently say that over the period 1979-2010 the downward trend has accelerated.

In summary, we know that a summer ice-free arctic is possible, that it does not require extremely high temperature, that we're not far from there, and that the downward trend is accelerating. So, why should we be surprised when scientists say that in a few decades we'll easily sail to the North Pole in September?

0 0

Printable Version  |  Link to this page

Comments

1  2  Next

Comments 1 to 50 out of 77:

  1. I don't like the NSIDC graph. Y-axis should start at 0. As it is, it implies wrong things. Facts are bad enough without a distortion like that. Of course the graph is correct, y-axis correctly labeled, nevertheless starting at 0 might show better where we are heading.
    0 0
  2. _Flin_ you don't say what that figures apparently implies, so forgive me if I misinterpret your thought. What I wanted to show, and as explicitly said in the text, is that the downward trend has accelerated. If you think that by having the y axis starting at 3 I'm suggesting that we will have an ice-free arctic when the extent reaches the x-axis, it would be in contraddiction with what I wrote. I'd also like to underline that a polynomial fit is an interpolation technique, I hope no one will try to extrapolate it to zero without good (physical) reasons to believe it will continue. As I said in the text, we have good reason to believe it won't. Anyways, if you're happier with the y-axis starting at zero, here's the graph:
    0 0
  3. I'd forgotten the Copenhagen Diagnosis! I think that is because it coincided with the CRU email theft.
    0 0
  4. The Copenhagen Diagnosis link is broken. There is an extraneous space at the end i.e 'LOW.pdf_'
    0 0
  5. I'm terribly sorry. My previous message was very curt. I should have added my thanks to Riccardo for all the work he put into writing the article.
    0 0
  6. Thank you, Riccardo. Looking at accelerating arctic sea ice loss the question one asks is: "When will the arctic be ice-free in September?". The first graph supports the impression: "Oh, in 2020, or maybe even a bit earlier". Which is of course not true, and differs from your text as well. Thank you for providing the other graph, I really do appreciate it. It helps for pointing people over here without having to discuss things like "Oh, the alarmists over there use misleading scales."
    0 0
  7. Some are betting on sooner, rather than later: Shell is pressing the Interior Department to grant final approval for its Arctic projects by the end of this year so that the company has enough time to move the necessary equipment to drill next summer, when the waters offshore are free of ice. -- New York Times, 5 Nov 2010 (emphasis added)
    0 0
  8. "Catastropism"? :)
    0 0
  9. If you look at the volume instead of the area it looks like the Arctic will be ice-free sooner rather than later. The average volume in September is 13,500 cubic Km, and the bottom of this graph equates to an anomaly of 13,500: http://psc.apl.washington.edu/ArcticSeaiceVolume/images/BPIOMASIceVolumeAnomalyCurrent.png http://psc.apl.washington.edu/ArcticSeaiceVolume/images/PIOMAS_daily_mean.png
    0 0
  10. The article suggests that ice-albedo feedback will eventually reach a point of diminishing returns which should cause the currently accelerating decline in extent to level off. How certain is it that the trend is being driven primarily by ice-albedo feedback? Pikaia brings up the much steeper ice VOLUME trend (declining an average of about 1000 km^3 per year for the past decade, Sept minimum 5800 km^3 in 2009 and 4000 km^3 in 2010)... which might suggest that the melt is being driven by ocean temperature change. Yes, ice albedo factors into the ocean temperature, but ice volume has dropped even in years that extent has increased. Each of the past three years has had ice extent greater than 2007, but ice volume has continued to decline to new record lows each year. To me that suggests that what we are seeing is part of the effect of global warming on world ocean temperatures. The water flowing into the Arctic ocean is warmer than it was in decades past and that is accelerating the breakup of the Arctic ice cover. This causes old thick ice to break into smaller chunks which can then spread out to continue 'filling' extents similar to past years... but eventually that thick ice will be gone and extent will drop as sharply as volume has been. If the ice volume trend is going to level off it only has a few years left in which to do so before hitting zero. We should be starting to get Cryosat 2 data soon now. Hopefully that will dispel any questions about the accuracy of ice extent and volume estimates.
    0 0
  11. Thanks Riccardo, very clear. I've been lurking at this site a long time... thank you John for all the work. Robert Grumbine has a discussion of the timing for an ice-free arctic September. He estimates 2035, plus or minus seven years, based on a probabilistic prediction. Which starts with a logistic curve as a best fit for the data, I think. RG is an infrequent blogger, but always worth a look. He has a lot to say about arctic ice.
    0 0
  12. Thank you MichaelM and NickD, I made the necessary corrections. _Flin_ as you may have noticed, the post didn't focus on the timing. I think it's more important to focus on the process itself and to know that it's a matter of decades, not millennia.
    0 0
  13. Riccardo and _Flin_.... You might look at Dr. David Barber's lecture here. If you go to minute 19:40 Dr Barber is predicting ice free summers sometime between 2013 and 2030. And this is a very recent lecture.
    0 0
  14. CBDunkerson I think we all agree that ice volume is the real quantity of interest. The problem is that we do not yet have good measurements. Hopefully in a few years we'll have enough to hindcast past conditions accurately and eventually redo this kind of estimates. Crispy I don't like betting, but I know many people do. Grumbine's estimate using a logistic function is easy to reproduce, but before showing the results I'd like to emphasize that it's a purely probabilistic approach, no physics whatsoever behind it.
    The two dashed lines represent the 2σ uncertainty on the timing, the year at which the extent is half of the initial value. Place an ice extent minimum threshold and go ahead with your bet :) Rob Honeycutt I've seen Barber's lecture, very interesting. He claims, and I have no reason to doubt, that satellites are fooled by thin ice between thick floes. Only good volume measurements can give us a better picture of the situation there.
    0 0
  15. There are no (systematic) observations from 1900 till 1950 (according to the IPCC-curve). How do they know that minimum sea-ice extent was above 8 mill km2 all these years? Isn´t it likely that minimum sea-ice extent was much lower in the 1930s when temperatures were (almost) as high as today?
    0 0
  16. Several questions: 1) When will cryosat 2 begin collecting data? 2) Will cryosat 2 data serve to calibrate the PIOMAS model? 3) Why the big time lags in PIOMAS web updates?
    0 0
  17. One would expect the ice conditions to be low at this time as we are at the end of the 30 year cycle. The northern northwest passage was sailed in 1944. As low as the ice was during the past 6 years, that voyage has not been repeated. There are numerous stations showing the current air temps of the Arctic are very simliliar to the temps of the late 30's and early to mid 40's. Geomagnetic research is showing that solar winds and the sun's cycles play an extremely important role in the placement of the jet streams. There also seems to be a link between geomagnetic levels and placement of global ocean circulation. And not least, is the tremendous amount of soot that China spews that lands in the Arctic. Mr. Schmidt etal published a paper in Science expressing that co2 has a minor effect on the Arctic verses the culmination of soot etc.
    0 0
  18. Re: oamoe (16) Not an expert, but here are some answers: 1. As soon as the calibration phase is completed. Here's the most recent (26 Oct 2010) press release on the matter. 2. As PIOMAS is a climate modeling tool used to make Arctic ice forecasts (model runs through 2049 are available on their site), then that would be a safe assumption. It may take awhile to figure out the necessary calibrations, as PIOMAS uses 7 years worth of forcings to hone its accuracy. 3. As an add-on to #2 above, PIOMAS is not a data reporting effort but a climate modeling tool. It used to be that updates would be announced every 2 weeks, but as we all know, life sometimes gets in the way of ill-funded missions. A cool thing: for the curious, you can track the current location of Cryosat-2 here. The Yooper
    0 0
  19. Camburn.... If look up the prior sailings of the NW Passage you'll find that these were major endeavors requiring aid from ice breakers. This past summer Graeme Kendall in the Astral Express sailed the NW Passage in a small one man sailboat in but a few weeks. The conditions of the Arctic now is not at all comparable to those of previous expeditions.
    0 0
  20. Rob: He sailed the southern passage, not the northern passage. The southern passage is open most years to small boats.
    0 0
  21. The Canadians use the southern passage yearly. Usually during the month of September to re-supply towns etc in the Arctic.
    0 0
  22. Camburn.... "Kiwi Yachtsman, Graeme Kendall, completes world sailing firsts; Arctic North West Passage solo, non stop & in a record 12 days."
    0 0
  23. Camburn.... Think about it for just one second. Sailing of the NW Passage, on any route, was a fantasy of traders for most of the 19th and 20th century. Lots of attempts made. Many lost ships and men along the way. The first passage by Amundsen took three years, spending two full winters stuck in the ice. This year a guy does it solo in 12 days.
    0 0
  24. Camburn.... I also find this from Weather Underground regarding passages of the Northern Passage... "We can be sure the Northwest Passage was never open from 1900 on, as we have detailed ice edge records from ships (Walsh and Chapman, 2001). It is very unlikely the Passage was open between 1497 and 1900, since this spanned a cold period in the northern latitudes known as "The Little Ice Age". Ships periodically attempted the Passage and were foiled during this period, and the native Inuit people have no historical tales of the Passage being navigable at any time in the past."
    0 0
  25. Various points; Riccardo #14, Arctic ice volume accuracy - While the PIOMAS model results are the only continuous 'record' I am aware of it should be noted that this has been validated against submarine and ICESat records. Thus, there is a fairly strong case for the PIOMAS results being accurate within a relatively small margin of error. Camburn #17, "...we are at the end of the 30 year cycle" - What cycle are you referring to? The usual '30 year cycle' that skeptics go on about is the Pacific Decadal Oscillation... but we are actually ten years into the 'cool' phase of that rather than "at the end". Oamoe #16, Cryosat - Cryosat has actually been "collecting data" since April. They have been fine tuning the sensors and working out the kinks, but the commissioning phase actually ended a couple of weeks ago. I'm not sure whether they will release anything from prior to the end of the commissioning phase since they were still making adjustments during that period, but they should be able to tell us whether the current (remarkably low) volume reported by PIOMAS is roughly accurate.
    0 0
  26. Brutus no systematic observations does not mean we know nothing. Take a look at Polyak2010 fig. 2a, reproduced below for your convinience.
    0 0
  27. Brutus,
    Isn´t it likely that minimum sea-ice extent was much lower in the 1930s when temperatures were (almost) as high as today?
    While anecdotal evidence is hardly foolproof, and a lack of anecdotes even less so, still we have little from that period corroborating the notion of significantly less sea ice coverage than where we started at the beginning of the instrumental record. I'm aware of pictures from the North Pole in the 1930s of areas of open water, but this only reflects local conditions, not the entire Arctic. We also have had open water at the pole from time to time throughout the last 30 years. This is a result of various conditions, mostly to do with how winds blow the sea ice about. We've also had a longer period of warming (since 1970s) today than then, a couple of decades more of sustained warmth. Overall Arctic sea ice doesn't respond in lockstep with temps, but declines as a result of continued warmth over years until an equilibrium is reached. Thus, it is probably unlikely that sea ice coverage in the 30s was less than today's, as there wasn't the same long-term build up and sustained high temps for long-term melt. Reconstructions from observational data (which is admittedly sparse pre-1950) and proxy data support this probability. One could reasonably argue that these findings are not certain, but it would be unreasonable to posit that sea ice coverage in the 1930s was "likely" as low as today.
    0 0
  28. Here's a full version of Polyak 2010 for anyone to review. http://www.cgd.ucar.edu/oce/mholland/papers/Polyak_2010_historyofseaiceArctic.pdf
    0 0
  29. #27: "we have little from that period corroborating the notion of significantly less sea ice coverage" The reference in Polyak goes through Kinnard et al 2007 to the University of Illinois sea ice data set. There's a slight offset to match the satellite data, but there's enough overlap to work that out.
    0 0
  30. During the 1930's the Russians took extensive pictures of the ice edge during the summer from airplanes. These photos have been used to archive that side of the Arctic. I have not seen American records, but there is undoubtly something. Probably not as systematic as the Russian records. There are many towns in the Canadian and Alaskan Arctic. Those peole keep records every year, going back to the 1800's, of the local ice conditions. It is well known that the Northwest passage was only open to non-icebreakers in the past 5 years. The people who say the passage was previously open are trying to fool naive readers. Around 1900 Peary and Cook were doing their exploring. There is a lot of data about the Arctic ice before satelites were launched.
    0 0
  31. Thanks, muonocounter. There is time series data for 1870 - 2007 at that page, including extent for the 1930s. http://arctic.atmos.uiuc.edu/SEAICE/timeseries.1870-2008 According to that data set, Arctic sea ice extent (annual) first dipped below 13 million sq/km in 1960. Prior to that it was always greater than 13 mil. From 1979, annual extent has always been below 13 million sq/km, and by 2000 was starting to dip below 12 mil. In 2007, the annual sea ice extent fell below 11 million square kilometers. The first column is annual data. The following four columns are Winter, Spring, Summer and Autumn extents year by year from 1870. Although summertime extent is more variable, the 1930s were relatively stable, and the data show considerably greater extent for that period/season than today. While we have a lot of ice-edge data from the 1930s, it is quite inferior to the satellite period data. All the above should be read with the usual caveats.
    0 0
  32. The St Rock sailed the northern northwest passage in 1944. Henry Larson was the captain. They left Halifax, Nova Scotia and docked in Vancourver, British Columbia 86 days later. Using fixed wing aircraft, the Alfred Wegener Institute for Polar and Marine Research found the ice to be thicker than anticipated. This was done in 2009. This is emperical data, not modeled nor guesses from the current satillites. The approx 60 year ice cycle is not dependent on the PDO. Within that 60 year cycle there is also a ten year cycle. Interesting information to study. One other thing that must be taken into consideration is the effect of magnetic flux on high latitude temperatures. There are numerous published papers that show that cause and effect. Here is something from the US Weather Bureau. "The Arctic seems to be warming up. Reports from fishermen, seal hunters and explorers … all point to a radical change in climate conditions, and hitherto unheard-of high temperatures in that part of the earth's surface. … Ice conditions were exceptional. In fact so little ice has never before been noted. The expedition all but established a record, sailing as far north as 81 degrees 29 minutes in ice-free water. … Many old landmarks are so changed as to be unrecognizable. Where formerly great masses of ice have been were found, there are now often moraines... At many points where glaciers formerly extended far into the sea, they have entirely disappeared." The date was October 1922. Antidoal evidence shows that we have a lot to learn about the Arctic and Ice. And the reasons for the increase and decrease of said ice. While co2 potentially plays a part, it is far from the only reason that the ice varies on a decadal scale.
    0 0
  33. #32: "Using fixed wing aircraft, the Alfred Wegener Institute for Polar and Marine Research found the ice to be thicker than anticipated." From the AWI website: The results have been obtained by means of computations with a numerical dynamic-thermodynamic sea ice model, using six-hourly atmospheric forcing data. Perhaps some modeling is part of that work after all? "the effect of magnetic flux on high latitude temperatures." Sounds like you may have heard that its all due to cosmic rays? Been there, done that: no dice.
    0 0
  34. muoncounter: Did you read more or just the first few paragraphs? In case you didn't: "An advantage of the EM technique is that it can be deployed from helicopters or airplanes. In the summer of 2001, a new helicopterborne EM sensor ("EM-Bird") was operated in the Arctic for the first, yielding high resolution thickness data of good quality. With the EM-Bird, we will now be able to perform systematic large-scale studies of the ice thickness distribution, improving our ability to better judge observations and predictions of possible climate changes" They took the EM and put it on Polar five and flew grids over the Arctic in 2009. The results were much thicker ice than had been anticipated. I will be the first to admit that one year does not prove anything. However, it does prove that there is large variances in ice thickness that were not expected as the 2009 data showed.
    0 0
  35. Muoncounter: What is the effect of cosmic rays?
    0 0
  36. Re: Camburn (34)
    "They took the EM and put it on Polar five and flew grids over the Arctic in 2009. The results were much thicker ice than had been anticipated."
    Actually, thin, “rotten” ice can electromagnetically masquerade as thick, multiyear sea ice, as was found by Professor David Barber aboard the research vessel (NGCC) Amundsen in 2009. So, an Arctic ice expert with decades of researching the ice takes a ship physically through the areas of thickest multiyear ice in the areas covered by the AWI aerial overflights finds ice, though thick, that is rotten and essentially no barrier to late-season navigation. Nor the type of ice to build a recovery around. This also has been covered here, where they include this link (which references the Barber video). The Yooper
    0 0
  37. (first post here, so first and foremost many thanks for this very interesting and insightful site). I was a bit intrigued by the claim that a ship managed to get through the NW passage in 1944, since it means that it could have been a far safer way for the US and Canada to bring equipment to URSS. So I dug a bit, and I found an (interesting) article from the Calgary university about this exploit : http://www.ucalgary.ca/arcticexpedition/larsenexpeditions It states that the St Roch was an Arctic ship with extra-hard and heavy hull, and in 1944 it was fitted with larger engines to break more easily ice. An icebreaker, to be short. We cannot therefore deduce from this trip that NW passage was ice free in 1944.
    0 0
  38. You got there before I did, bratisla, but it is also worth noting that the St. Roch's previous attempt took over 2 years to complete. Conditions were obviously not as ice-free as they have been in at least the last 10 years, as can be seen from the number of successful attempts by all sort of sailing vessels, usually without any form of ice-breaking facilities. Wikipedia has lots of details and further information.
    0 0
  39. Camburn.... There is a huge difference between an ice breaker getting through the Northwest Passage and a 12.5 meter sailboat. The difference is that now we are seeing the NW Passage clear of ice.
    0 0
  40. For the first time, both the northwest and northeast passages offered smooth sailing this summer. I don't know what's up with that first graph, but look for an essentially ice free Arctic winter before 2100 unless we stop burning carbon.
    0 0
  41. After reading Neven, google up this dissertation Ocean heat transport as a cause for model uncertainty in projected Arctic warming [large pdf] and especially Chapter 2, Ocean heat transport as a cause for model uncertainty in projected Arctic warming. Note that heat transport into the Barents Sea has an influence out of proportion to its fraction of the Arctic heat budget. Further study of this heat transport looks to be a key to reducing the uncertainty of Arctic sea ice projections.
    0 0
  42. Oops. The title of Irina Mahlstein's dissertation is Ocean heat transport as a cause for model uncertainty in projected Arctic warming.
    0 0
  43. Pete Dunkelberg #41: "Note that heat transport into the Barents Sea has an influence out of proportion to its fraction of the Arctic heat budget." Aha... precisely the theory I was going on back in comment #10. There is clearly something major missing from the Arctic sea ice prediction models and this seems like a strong candidate to me. It also suggests a very different 'end game' for the Arctic sea ice than current models... because if a large portion of the ice loss is being driven by influx of warmer water there should be no 'slowing down' of the decline. Indeed, it should just keep accelerating as less ice = stronger currents = more warm water imported. Given that there was only 4000 km^3 of ice left this past September (average for the month) and it has been dropping about 1000 km^3 per year for the past decade we should know in the next few years whether this 'fast decline' scenario or the 'leveling off' prediction is correct.
    0 0
  44. Despite some of the comments above, PIOMAS has already undergone extensive Model Validation. Long before CryoSat-2, NASA's ICESAT mission provided 5 years of sea ice thickness data (2003-07). Researchers also used data from US Submarine cruises, and moored Buoy Arrays to have 3 independent sources of data. More details on the model, assimilation procedures and validation results can be found here.
    0 0
  45. CBDunkerson #43 ... we should know in the next few years whether this 'fast decline' scenario or the 'leveling off' prediction is correct. Unless you believe in negative ice, leveling off is a sure bet. :)
    0 0
  46. Heh... obviously I meant 'leveling off BEFORE hitting zero'. The standard hypothesis, as articulated by Riccardo in the article, is that ice loss is being driven primarily by air temperature rise from global warming and ice-albedo feedback. As the amount of ice declines the change in albedo from any further decline becomes smaller and thus there would be 'diminishing returns' and a long period of slowly declining sea ice. Obviously the volume trend, as inferred by PIOMAS, tells a different story unless it suddenly changes course radically some time in the next few years OR the PIOMAS results are off. I don't think the latter is likely based on verifications against other data sources (as I mentioned previously and Artful Dodger has just explained in more detail). However, with Cryosat-2 now online and the current volume trend only a few years from hitting zero I think we'll have a clear answer some time relatively soon.
    0 0
  47. Hey, there's been an Artful Dodger sighting! Welcome! The Yooper
    0 0
  48. Camburn says that: “ Geomagnetic research is showing that solar winds and the sun's cycles play an extremely important role in the placement of the jet streams.” I think he's right. If compared to the work on the optimum of the middle Holocene: “We do not know whether the Arctic Ocean was completely devoid of ice, but the areas north of Greenland, it was more open water than today ... " - says geologist and researcher Astrid Lysa ...” (NGU). “Changes that took place 6000-7000 years ago were controlled by other climatic forces than those which seem to dominate today ... " ... and this paper: “Evidence of 6 000-Year Periodicity in Reconstructed Sunspot Numbers”, M. A. Xapsos and E. A. Burke, 2009, Solar Physics, Volume 257, Number 2, 363-369: “We have examined these data using Hurst analysis, a moving average filter, and Fourier analysis. All of the procedures indicate the presence of a long term (≈6 000 year) cycle not previously reported.” The conclusions suggest themselves ...
    0 0
  49. Arkadiusz Semczyszak wrote : "The conclusions suggest themselves ..." Not to me, at least. Your first link doesn't mention anything to do with the quote you referred to from Camburn (to do with geomagnetic research, solar winds, sun cycles or jet streams). Your second link does refer to sunspots but doesn't mention jet streams or anything to do with climate on earth. And the main graph at that link (just like every other sunspot graph I've seen) doesn't seem to correlate to any temperature reconstructions going back that far, that I'm aware of, especially over the last 50 years or so. Please 'suggest' those conclusions.
    0 0
  50. #35: "What is the effect of cosmic rays? " Not much. Were you referring to something else with "the effect of magnetic flux on high latitude temperatures"?
    0 0

1  2  Next

You need to be logged in to post a comment. Login via the left margin or if you're new, register here.


The Consensus Project Website

THE ESCALATOR

(free to republish)


© Copyright 2024 John Cook
Home | Translations | About Us | Privacy | Contact Us