


 Arguments


Greenland Ice Sheet outlet glaciers ice loss: an overview
Posted on 16 December 2010 by Daniel Bailey
The mass loss from Greenland's ice sheet has been well documented over the years. In recent years, the rate of loss has accelerated.

Figure 1: Greenland ice mass anomaly (black). Orange line is quadratic fit (John Wahr).
To understand the causes of the acceleration we must examine how they vary in time and from glacier to glacier. It also must be recognized that the same processes will not have the same level of impact on each glacier. The two key mechanisms are the Zwally Effect and the Jakobshavn effect. Let's take a closer look at those.
The Zwally Effect
This mechanism relies on meltwater reaching the glacier base via moulins and reducing the friction at the base of the glacier. This mechanism has been examined in detail and has yielded short term accelerations in the 10-20 % range (Zwally et al, 2002) (Das et al, 2008), but is of little significance to the annual flow of the large outlet glaciers. A recent paper by Schoof et al (2010) further examines this issue. They conclude that rapid changes in the basal water pressure is key: long periods of sustained melt may lead to reductions in basal water pressure as the channels that drain the meltwater at the glacier base mature.
A mature channel system would successfully remove the meltwater, instead of having the meltwater fill the channels and spread out as a lubricant over more of the glacier bed. This is not a new concept, having been observed on Ryder Glacier during a surge after a lake outburst in 1995. This mechanism has been observed in Iceland and Bering Glacier in Alaska as well.
The mechanism does have limitations, however. First of all it would be short lived, as it is only at times of rapid change in the amount of available meltwater that acceleration would occur. The examinations of increased speeds from glacial lakes in Greenland to the base fit the pattern noted. It is not a continuous summer long acceleration necessarily; it is often a short term rapid flow increase that is also localized. Thus, this mechanism falls within the domain of the observed meltwater driven accelerations. For this to be the star player, we need a glacier area where flow is slow enough for channels to develop and where basal water pressure is often limited.
This is not the case on the rapid flowing marine terminating outlet glaciers. The mechanism of a meltwater impulse driving short term acceleration would then be most important in regions where flow is slower and basal meltwater production not persistent. Joughin and others, 2008 observed that seasonal drainage of meltwater to the glacier bed induces a uniform acceleration of 50–150 meters/year over a ~300 km long section of the West Greenland margin that is not drained by outlet glaciers, causing a large fractional acceleration of the interior ice sheet but a small fractional change in the speed of fast-moving outlet glaciers. This suggests that glacial ice acceleration due to changes in seasonal meltwater flux tend to not make a significant overall change in outlet glacier ice velocities.
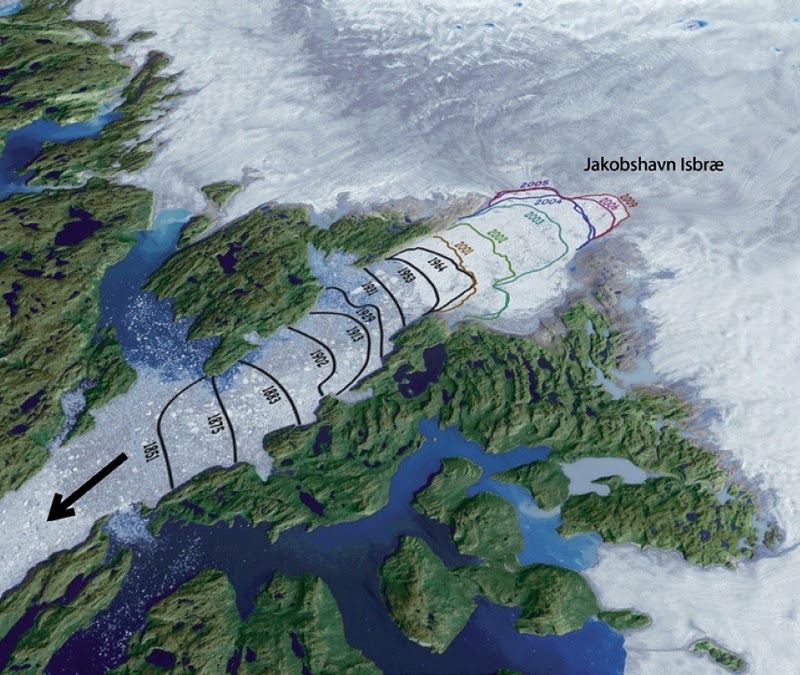
The Jakobshavn Effect
We are still left with the main cause of glacier acceleration in Greenland resulting from dynamic thinning of the terminus zone of the marine terminating outlet glacier reducing the effective bed pressure, allowing acceleration – the Jakobshavn effect. The reduced resistive force at the calving front due to the thinner ice, now experiencing greater flotation, is then propagated “upglacier” (Hughes, 1986; Thomas, 2003 and 2004). This type of acceleration has a limited seasonal signal, and propagates upglacier from the terminus.
Howat and others (2008) examined changes in terminus position, surface elevation and flow on 32 glaciers along the southeast coast of Greenland from 2000-2006. They affirmed that speedup results from loss of resistive stress at the front during retreat. Many retreats began with an increase in thinning rates near the front in the summer of 2003, a year of record high coastal-air and sea-surface temperatures.
This indicates again the importance of preconditioned thinning via melting. The mass balance at the calving front is the sum of the ice flux from upglacier, the rate of melting above and below the waterline and the iceberg-calving rate. Mass balance transfer to the calving front is a slow process with a large lag time (centuries) and is not capable of playing a meaningful role in the recent relatively large and sudden glacier accelerations (Pfeffer, 2007).
Surface ablation and basal ice ablation are determined by the climatic and oceanographic conditions at near the glacier front. Increased ablation even in a single summer will cause thinning near the ice front. This will reduce the effective pressure at the glacier bed, reducing friction and encouraging acceleration. Acceleration at the calving front will then effectively pull on the ice upstream, stretching it causing further thinning and acceleration. This is how the marine terminating outlet glaciers can respond rapidly to climate conditions. Howat and others (2008) in observing the seasonal flow rates of 32 outlet glaciers concluded that the presence of a seasonal oscillation in speed was ambiguous. On average, the glaciers show a difference in summer (faster) and winter (slower) speeds on the order of 10%.
How does this play out on various glaciers?
Petermann Glacier is a much different glacier than the large fast flowing marine terminating glaciers above. Its extensive ice tongue makes it particularly susceptible to basal melt processes, due to the area and duration of exposure of the glacier base. Its velocity of 2-3 m/day is much lower than 10-30 m/day observed on the other marine terminating outlet glaciers.
Petermann is located on the northwest corner of Greenland and certainly experiences less melting and less snowfall. The lower 80 km (in length) and 1300 km2 (in area) of the glacier is afloat. This makes it (by area) the largest floating glacier in the Northern Hemisphere. The ice front is not impressive, unlike the faster outlet glaciers. The calving front protrudes a mere 5-10 m above sea level, reflecting the fact that the ice at the front is only 60-70 m thick.
Further upglacier, the ice at the grounding line is 600-700 m thick. The combination of velocity and thickness yield the volume of material calved each year. Petermann Glacier calves 0.6 km3 (Higgins, 1990), whereas Jakobshavn yields close to 40 km3. The thinning between the grounding line and the calving front is mainly via melting as the snowline is at 900 m. The low slope leads to very low velocities, giving the low-lying floating section plenty of time to melt, and surface melt ponds are common. The glacier flow in the long terminus section is not susceptible to basal water pressure changes.

Humboldt Glacier is much different as the lack of confining topography prevents the development of the strong ice stream flow we see on Jakobshavn Glacier or the weaker ice stream flow of Petermann Glacier and its subsequent long floating tongue. This glacier could then be more susceptible to changes in meltwater flux.

Ryder Glacier is much different: Howat and others (2008) note that Ryder Glacier, North Greenland, accelerated by 300% over a 7 week period following drainage of a supraglacial lake in 1995. This indicates the ability of an unusually large sudden discharge of water can increase basal water pressure dramatically and enhance basal sliding. This glacier is in the north of Greenland and has an order of magnitude less melt than Jakobshavn and would be more susceptible to such a sudden meltwater pulses.

Essentially, several effects are at play and each glacier has its own story; but in the end they all point to a warming world, which continues apace. The mass loss of Greenland’s outlet glaciers is not only expected to continue but to increase their acceleration as well. Current events surrounding increased oceanic heat around ice sheet margins in Antarctic are expected to play a dynamical role in marine terminating glacial ice loss acceleration there as well. Stay tuned...
Update:
Just ran across this animation over at Climate Progress:
The animation shows the spread of ice loss into northwest Greenland observed by NASA’s Gravity and Recovery Climate Experiment (GRACE) satellite system from 2003 through 2009 (updated to 2011; DB).
The vast majority of this blog post was contributed by glaciologist Mauri Pelto (all credit to Mauri, all errors are mine). Examples of his work can be found at From A Glaciers Perspective and at RealClimate.


 0
0  0
0


Comments