


 Arguments


Dispelling two myths about the tropospheric hot spot
Posted on 24 February 2011 by thingsbreak
Things Break has kindly allowed us to repost his blog post where he debunks two common myths about the tropospheric hot spot from a few days ago. This post has also been used as the Advanced Rebuttal to "There's no tropospheric hot spot" (also found at http://sks.to/hotspot).
Part 1: The “Hotspot” as an Alleged Fingerprint of Anthropogenic Warming
A great deal of the confusion surrounding the issue of temperature trends in the upper troposphere comes from the mistaken belief that the presence or lack of amplification of surface warming in the upper troposphere has some bearing on the attribution of global warming to man-made causes.
It does not.
Attribution of anthropogenic origins of the current climatic changes can be tested from many different directions. One of the most clear examples for those with some familiarity with the Earth’s atmosphere is the issue of stratospheric cooling. If the sun were to suddenly increase its output by 2%, we would rightfully expect the atmosphere as well as the surface to warm up in response. This can be examined, for instance, by looking at the response in a GCM like GISS ModelE:
2% increase in solar forcing (via RealClimate)
Likewise, if we were to double preindustrial levels of CO2, we would expect the surface and the lower atmosphere to warm. However, unlike the case of increasing solar influence, we would not expect the lower atmosphere to warm through at all levels. Increasing the greenhouse effect should warm the surface and troposphere, but cool the lower stratosphere.
Doubling of CO2 (via RealClimate)
In the doubled CO2 scenario, there is a pronounced cooling of higher altitudes, i.e. the stratosphere, and this feature is entirely absent in the +2% solar scenario.

This stratospheric cooling is a fingerprint of increased greenhouse (as opposed to solar) warming. For a more in depth discussion of why the stratosphere cools under enhanced greenhouse warming, see discussions at Skeptical Science and The Science of Doom. In other words, the difference in the two simulations is not the presence of a "hot spot" in one and its absence in the other, it's the stratospheric cooling apparent in the increased CO2 simulation.
In the IPCC Fourth Assessment Report (AR4), historical forcings were simulated in the Parallel Climate Model, and and the zonal mean temperature responses to each were broken out in separate panels. There was some increase in solar irradiance during the period, which shows up as a modest amount of warming throughout the atmosphere, with some amplification in the upper troposphere (the sort of greenish-yellow and yellow patterns respectively in panel a). As we all know, there was a significant change in GHG forcing during that time, which manifests as surface warming, amplified upper troposphere warming, and stratospheric cooling (panel c), and the net effect of all forcings was shown (panel f).

Fig 9.1: Zonal mean atmospheric temperature change from 1890 to 1999 (°C per century) as simulated by the PCM model from (a) solar forcing, (b) volcanoes, (c) well-mixed greenhouse gases, (d) tropospheric and stratospheric ozone changes, (e) direct sulphate aerosol forcing and (f) the sum of all forcings. Plot is from 1,000 hPa to 10 hPa (shown on left scale) and from 0 km to 30 km. (IPCC AR4 WG1)
So far so good. Right? Well, this is actually where things went off the rails.
Climate “skeptics” apparently became convinced that the “hot spot” in Figure 9.1c was the fingerprint of anthropogenic warming the IPCC was referring to, rather than stratospheric cooling coupled with tropospheric warming.
As he so often does, Monckton serves as a useful example of getting things wrong, claiming:
the models predict that if and only if Man is the cause of warming, the tropical upper air, six miles above the ground, should warm up to thrice as fast as the surface, but this tropical upper-troposphere “hot-spot” has not been observed...
This unequivocally incorrect claim was also made in the NIPCC "skeptic" report (Section 3.4), which was signed off on by such supposedly "serious" contrarians as Craig Idso and S. Fred Singer.
The mistaken belief in “skeptic” circles is that the existence of anthropogenic warming somehow hinges on the existence of the tropospheric “hot spot”- it does not. Period. Tropospheric amplification of warming with altitude is the predicted response to increasing radiative forcing from natural sources, such as an increase in solar irradiance, as well. Stratospheric cooling is the real "fingerprint" of enhanced greenhouse vs. natural (e.g. increased solar) warming.
Part 2: The Existence of Amplified Warming in the Upper Tropical Troposphere
So, does the “hot spot” actually exist? That is to say, is the tropsosphere actually warming as expected? Unfortunately, the answer to this is much less cut and dry.
There is a good theoretical basis for this expectation of amplification in the upper troposphere relative to the surface. We expect that an increase in radiative forcing would result in a moist adiabatic amplification of warming with altitude, i.e. that the troposphere would warm faster with height. This also appears as an emergent property in climate models, which show a similar vertical profile of warming to that expected under the moist adiabatic lapse rate.
Unfortunately, actually determining what is happening in the real tropical troposphere has proven to be quite difficult. Perhaps the largest reason for this is the quality of data from the main source of our information from this region for long time periods- radiosonde networks.
Although on seasonal and annual scales, some radiosonde records are in relatively good agreement with theoretical and modeling expectations, on decadal timescales, they show less warming or even cooling of the upper troposphere. However, the tropics, especially at higher altitudes, are a notorious problem area for most if not all of the older radiosonde networks. And attempts to stitch together longer records from multiple networks (and integrate them with newer satellite records) have introduced problems as well. There have been many attempts to quantify and remove these biases (e.g. Randel 2006, Sherwood 2008). Although these attempts have managed to reconcile the observational data with theoretical and model expectations within overlapping uncertainty intervals, the real world behavior of the troposphere is still unclear (Bengtsson 2009, Thorne 2010).
Allen and Sherwood sought to side step the problems associated with the radiosonde data entirely, and examined the “dynamical relationship known as the thermal-wind equation, which relates horizontal temperature gradients to wind shear”. Thermal wind speed data, in contrast to the temperature data, lacked many of the systematic adjustment issues and other errors, and were used as a proxy for temperature. Allen and Sherwood found that the troposphere appeared to be warming in reasonable agreement to theoretical and modeling expectations.

Vertical profile of tropical mean temperature trends. Trends reflect the mean change in temperature (in K per decade) between 20° N and 20° S for the period 1979–2005, obtained from radiosonde temperature measurements5 (blue and green colours), climate models8 (dashed orange, with grey shading indicating 2-sigma range) and the new reconstructions from radiosonde winds4 (pink, with error bars indicating 2-sigma range). The surface temperature change11 from 1979–2005 (grey asterisk) and the vertical profile inferred from the moist adiabatic lapse rate (dashed yellow) are also shown. The model range was derived by scaling the model vertical trend behaviour (which has been shown to be tightly constrained8) and its uncertainties8 by the surface trend. Prior to 2007, only the HadAT and RATPAC estimates existed, and a case could be made for a fundamental discrepancy between modelled and radiosonde observed behaviour. (Thorne 2008)
Recently, Johnson and Xie have approached the question from a different but similarly indirect angle. They examined trends in tropical sea surface temperatures (SSTs) and precipitation, which have direct implications for the behavior of the vertical tropical tropospheric temperature profile:
As the SST threshold for convection is tied to convective instability, this threshold must be strongly related to the tropical upper-tropospheric temperature. Observations show that tropospheric temperatures in the tropics approximately follow a moist-adiabatic temperature profile, which suggests an adjustment of upper-tropospheric temperatures in response to surface temperatures in the tropics. This hypothesis of moist-adiabatic lapse rate (MALR) adjustment predicts a close covariability between the SST threshold and tropical mean SST. If true, the variability and long-term trend of the SST threshold may reveal important information about the variability and trends in the tropical troposphere.

Climate warming over the tropical oceans [exaggerated]: a) In a climate before warming, convection and heavy tropical rain is restricted to a region where SSTs exceed a threshold value (dotted line), and temperatures decrease with altitude. b) Johnson and Xie show that this SST threshold has risen in tandem with mean SSTs over past decades, and that the area of surface ocean where convection occurs has remained constant. As a result of warming at the sea surface, air temperatures rise most at high altitudes. (Sobel 2010)
Tropical convection and thus precipitation is heavily dependent on sea surface temperatures (SSTs). Thus the absence of increased precipitation is indicative of stability upwards through the troposphere, which suggests that the upper tropical troposphere is indeed warming faster than surface temperatures.
[T]he similarity between the trends of SST and the SST threshold for convection in [the following figure] is consistent with approximate MALR adjustment in observations and inconsistent with reduced upper tropospheric warming relative to the surface, as indicated in some observational data sets. Although the statistical uncertainty of 30-year trends is rather high, the clean relationship between the SST threshold and tropical mean SST at all timescales in both observations and models increases confidence that the tropical atmosphere is warming in a manner that is broadly consistent with theoretical MALR expectations.

Time series of tropical mean SST and the SST threshold for convection. Thirty-year time series of annual tropical mean (20° S to 20° N) SST (black diamonds) and two estimates of the SST threshold for convection (blue squares and red stars). Linear trend lines are also shown. The linear trends with 95% confidence intervals for the tropical mean SST, the PD2mmd^-1 SST threshold estimate and the linear P fit SST threshold estimate are 0:088±0:057;0:083±0:076 and 0:080±0:113 °C per decade, respectively. The effective degrees of freedom in the 95% confidence interval calculations account for the lag-1 autocorrelation in the residual time series. (Johnson 2010)
Is this the “final word” on amplified tropospheric warming? Of course not. Ideally, instrumental biases and gaps in the satellite and radiosonde records can be sorted out, longer records from newer networks will provide more confident results, and we can get an even clearer picture of what’s going on in the tropical troposphere. In the meantime, however, this is further evidence that things are behaving more or less as we’d expect.
But moreover, these papers illustrate some key aspects of science (and particularly climate science), that could use some emphasizing. Science is iterative, not dictative or supernaturally revelatory. There’s no single, infallible decree. Science is the process by which we strive to best approximate reality. The first results are not necessarily the “best” results, and they certainly are not written in stone. Our monitoring systems, particularly (ironically?) the ones with multidecadal records, were not designed for the kind of questions we may be trying to investigate with them. Or, to paraphrase a certain former Secretary of Defense, you study the world with the instruments you have, not the instruments you might want or wish to have at a later time. Would life be a lot easier if we had designed and implemented global climatic monitoring systems in the 60s and 70s with an eye for explicitly addressing the questions we have now? Of course! But we have to make do with what we’ve got, and that means working with problematic data and finding creative ways to work around them. To that end, it’s worth pointing out, proxies aren’t just used to study the past. Through comments here and at other blogs, I get the impression that people think using proxies is restricted to paleo questions. The presumption seems to be that in our digital, high-speed, satellite-monitored age, direct observations are the only game in town. As this case shows, however, this is decidedly not true. Indirect methods of assessing an issue are sometimes the only (or only alternate in the case of suspect data) methods available. And that’s not necessarily a bad thing! Sometimes looking at a question from a different angle can avoid some potential complications altogether. And finally, there is a pernicious lie that can be heard in climate denialist circles, typified by remarks like these from Dick Lindzen:
[I]t has become standard in climate science that data in contradiction to alarmism is inevitably ‘corrected’ to bring it closer to alarming models. None of us would argue that this data is perfect, and the corrections are often plausible. What is implausible is that the ‘corrections’ should always bring the data closer to models.
Lindzen’s implication is clear- observational data that don’t support “models” are fraudulently adjusted until they do, ergo climate change is at least partially an artifact of data manipulation. This is, in a word, absurd. First, due to the ludicrous nature of the claim and its inherent absolutism, it’s easily debunked by a single contrary example. Take, for instance, the notorious problem of climate models producing double ITCZs (e.g. Zhang 2006). This is a case in which models produced a result at odds with both theoretical expectations and observations. No one attempted to claim that the models were right about this and theory and observations were wrong.
This does illustrate a germ of truth buried in Lindzen’s conspiratorial falsehood, however. Climate models and theoretical climate dynamics/meteorology are constrained by physics, and for the most part, models tend to agree with physics-based, theoretical underpinnings of meteorology/climate dynamics. When there is an apparent discrepancy between “models” and observations, that often (but not always) means there is a discrepancy between general, theoretical meteorological expectations and the observational data. It’s not a case of trying to reconcile the observations with climate models, but rather trying to reconcile observational data (which often have well known biases) with our physics-based understanding of the climate system.
When people are quick to point out some alleged contradiction between climate models and a data set, they don’t realize that often as not they are pointing out a contradiction between the observations and our fundamental explanations of the climate system irrespective of the question of anthropogenic influence. And far from justifying a position of “nothing to worry about”, significant flaws in our understanding of the climate system would greatly strengthen the case for mitigation from a risk management perspective, as uncertainty and ignorance of consequences increase the relative value of insurance. But that’s a topic for a different day…
References:
- Allen, R.J. and S.C. Sherwood (2008): Warming maximum in the tropical upper troposphere deduced from thermal winds. Nature Geoscience, 1, 399-403, doi:10.1038/ngeo208.
- Bengtsson, L. and K.I. Hodges (2009): On the evaluation of temperature trends in the tropical troposphere. Climate Dynamics, “Online First”, doi:10.1007/s00382-009-0680-y.
- Johnson, N.C. and S.-P. Xie (2010): Changes in the sea surface temperature threshold for tropical convection. Nature Geoscience, 3, 842–845, doi:10.1038/ngeo1008.
- Randel, W.J. and F. Wu (2006): Biases in Stratospheric and Tropospheric Temperature Trends Derived from Historical Radiosonde Data. Journal of Climate, 19, 10, 2094-2104, doi:10.1175/JCLI3717.1.
- Sherwood, S.C., et al. (2008): Robust Tropospheric Warming Revealed by Iteratively Homogenized Radiosonde Data. Journal of Climate, 21, 20, 5336-5352, doi:10.1175/2008JCLI2320.1 .
- Sobel, A. (2010): Raised bar for rain. Nature Geoscience, 3, 821–822, doi:10.1038/ngeo1025.
- Thorne, P.W., et al. (2007): Tropical vertical temperature trends: A real discrepancy? Geophysical Research Letters, 34, L16702, doi:10.1029/2007GL029875.
- Thorne, P.W. (2008): The answer is blowing in the wind. Nature Geoscience, 1, 347-348, doi:10.1038/ngeo209.
- Thorne, P.W., et al. (2010) Tropospheric temperature trends: history of an ongoing controversy. WIRES: Climate Change, in press, doi:10.1002/wcc.80.
- Zhang, G.J., and H. Wang (2006): Toward mitigating the double ITCZ problem in NCAR CCSM3. Geophysical Research Letters, 33, L06709, doi:10.1029/2005GL025229.
This rebuttal is a repost of a blog post from The Way Things Break.


 0
0  0
0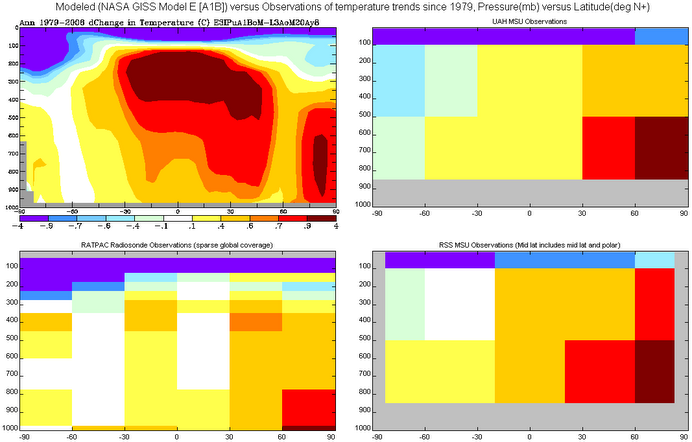 Upper Left: NASA GISS Model through 2006
Lower Left: RATPAC Raob data through 2006
Upper Right: UAH MSU (LT, MT, LS) through 2006
Lower Right: RSS MSU (LT, MT, LS) through 2006
Upper Left: NASA GISS Model through 2006
Lower Left: RATPAC Raob data through 2006
Upper Right: UAH MSU (LT, MT, LS) through 2006
Lower Right: RSS MSU (LT, MT, LS) through 2006

 (Channels ordered in terms of decreasing altitude. Still higher channels show greater trends, but I could not find any graphs of their trends up later than about 2007.)
3) Even ignoring the temporal signature, the Haigh et al hypothesis faces a problem in the spatial signature. Based on the fact that it predicts a peak of ozone at 45 km, and declining ozone and UV below that level, it predicts a cooling lower stratosphere, and a warming or constant temperature mid to upper stratosphere. In fact, the opposite is observed, with very low cooling trends in the lower stratosphere, and a very strong cooling trend in the upper stratosphere.
The low trend in the lower stratosphere is because decline in O3 concentrations results in more UV penetrating to that level, which tends to warm that level, and effect counterbalanced by the cooling effect of increased CO2. In the upper stratosphere, both increased CO2 and decreased O3 have a cooling effect, the reinforcement resulting in the strong cooling trend.
In fact, the observed spatial patern of cooling and warming in the stratosphere, coupled with the observed changes in radiation at different frequencies is only consistent with cooling brought about by increased CO2 levels,and decreased O3 levels. Any other effects must be minor in comparison.
(Channels ordered in terms of decreasing altitude. Still higher channels show greater trends, but I could not find any graphs of their trends up later than about 2007.)
3) Even ignoring the temporal signature, the Haigh et al hypothesis faces a problem in the spatial signature. Based on the fact that it predicts a peak of ozone at 45 km, and declining ozone and UV below that level, it predicts a cooling lower stratosphere, and a warming or constant temperature mid to upper stratosphere. In fact, the opposite is observed, with very low cooling trends in the lower stratosphere, and a very strong cooling trend in the upper stratosphere.
The low trend in the lower stratosphere is because decline in O3 concentrations results in more UV penetrating to that level, which tends to warm that level, and effect counterbalanced by the cooling effect of increased CO2. In the upper stratosphere, both increased CO2 and decreased O3 have a cooling effect, the reinforcement resulting in the strong cooling trend.
In fact, the observed spatial patern of cooling and warming in the stratosphere, coupled with the observed changes in radiation at different frequencies is only consistent with cooling brought about by increased CO2 levels,and decreased O3 levels. Any other effects must be minor in comparison.
 4) Finally, a decreasing aerosol optical thickness will also warm the troposphere, and cool the stratosphere; and due to volcanism or its lack, this can be a natural effect. However, aerosol optical thickness has been observed by satellites to be increasing rather than decreasing over the last decade, in large part due to the industrialization of India and China with limited pollution controls. Increassing optical thickness, of course, warms the stratosphere and cools the troposphere, which may be part of the reason for the reduced trends in both regions since 2000.


Comments