Climate Science Glossary

Term Lookup

Enter a term in the search box to find its definition.

Settings

Use the controls in the far right panel to increase or decrease the number of terms automatically displayed (or to completely turn that feature off).

Term Lookup

Settings


All IPCC definitions taken from Climate Change 2007: The Physical Science Basis. Working Group I Contribution to the Fourth Assessment Report of the Intergovernmental Panel on Climate Change, Annex I, Glossary, pp. 941-954. Cambridge University Press.

Home Arguments Software Resources Comments The Consensus Project Translations About Support

Bluesky Facebook LinkedIn Mastodon MeWe

Twitter YouTube RSS Posts RSS Comments Email Subscribe


Climate's changed before
It's the sun
It's not bad
There is no consensus
It's cooling
Models are unreliable
Temp record is unreliable
Animals and plants can adapt
It hasn't warmed since 1998
Antarctica is gaining ice
View All Arguments...


Username
Password
New? Register here
Forgot your password?

Latest Posts

Archives

Lindzen Illusion #5: Internal Variability

Posted on 8 May 2011 by dana1981

In a recent media article which was uncritically re-posted at a number of websites like "skeptic" blog WattsUpWithThat, in amongst many other erroneous statements, Richard Lindzen attempted to blame global warming on natural internal variability (emphasis added):

"For small changes in climate associated with tenths of a degree, there is no need for any external cause. The earth is never exactly in equilibrium. The motions of the massive oceans where heat is moved between deep layers and the surface provides variability on time scales from years to centuries."

Achilles Heel for Internal Variability

In the quote above, Lindzen has unwittingly revealed the Achilles heel of the 'internal variability' argument.  Internal variability means that heat is just being moved around from one part of the Earth's climate system from another, i.e. in Lindzen's example, from the deep ocean layers to the surface.  But if the movement of heat from the deep oceans is what's causing the surface air to warm, this hypothesis requires that the oceans as a whole and deep ocean layers in particular must be cooling.

In reality, that's not happening.  We know that the upper 2,000 meters of the oceans exhibit a long-term accumulation of heat (Figure 1).


Figure 1: Changing heat content of the global ocean, with respect to the mean of 1993 to 2008 (Trenberth 2010). This analysis samples the ocean to 700 m depth and gives an average warming trend of 0.64 W m−2 (pink line). The data available from Argo floats since 2003 enable an estimate to 2,000 m depth (blue line).

And Purkey & Johnson (2010) reconstructed ocean heat accumulation down to abyssal depths and found significant amounts of heat building up even at the bottom of the ocean (Figure 2).

Figure 2: Rate of ocean warming. Areas of warming are shaded in red and regions of cooling are shaded in blue with intensity scaled by the magnitude of the warming. The basins from south to north are the Southeast Pacific Basin, Chile Basin, Peru Basin, and Pacific Basin (Purkey & Johnson 2010).

There are several other indicators of building ocean heat. Satellites observing incoming and outgoing radiation are able to measure changes in the planet's energy imbalance from year to year. What they find is the planet's energy imbalance continues to increase (Trenberth & Fasullo 2010, Hansen et al. 2011).  And sea levels continue to rise, largely due to thermal expansion as a result of the warming oceans.

Clearly this warming of the entire global climate system must be caused by an external forcing, and the radiative forcings over the past century have been dominated by greenhouse gases.  Lindzen's internal variability argument just doesn't hold up in the face of the observational data and physical reality.  Unfortunately, in the aforementioned article, Lindzen proceeds to attempt to defend this indefensible argument by misrepresenting the work of a number of other climate scientists.

Tsonis et al. 2007

Lindzen first makes the following claim about the work of Tsonis and colleagues:

"Recent work (Tsonis et al, 2007), suggests that this variability is enough to account for all climate change since the 19th Century."

This statement is quite different from the actual conclusions of Tsonis et al. (2007) (emphasis added):

"The standard explanation for the post 1970s warming is that the radiative effect of greenhouse gases overcame shortwave reflection effects due to aerosols [Mann and Emanuel, 2006]. However, comparison of the 2035 event in the 21st century simulation and the 1910s event in the observations with this event, suggests an alternative hypothesis, namely that the climate shifted after the 1970s event to a different state of a warmer climate, which may be superimposed on an anthropogenic warming trend."

Nowhere in their paper do Tsonis et al. claim that natural variability can account for the entire warming trend over the past century.  Tsonis was also a co-author on a more recent paper,  Swanson et al. (2009) which John has previously discussed

Swanson and Tsonis 2009 was a similar study exploring the role of natural variability in global temperatures, and as with Lindzen's treatment of Tsonis' 2007 paper, it was widely misrepresented, as Dr. Swanson noted:

"What do our results have to do with Global Warming, i.e., the century-scale response to greenhouse gas emissions? VERY LITTLE, contrary to claims that others have made on our behalf. Nature (with hopefully some constructive input from humans) will decide the global warming question based upon climate sensitivity, net radiative forcing, and oceanic storage of heat, not on the type of multi-decadal time scale variability we are discussing here. However, this apparent impulsive behavior explicitly highlights the fact that humanity is poking a complex, nonlinear system with GHG forcing – and that there are no guarantees to how the climate may respond."

In their paper, Swanson and Tsonis use climate models to hash out the role internal variability has played in average global temperature changes over the past century (Figure 3). 

Swanson Tsonis variability

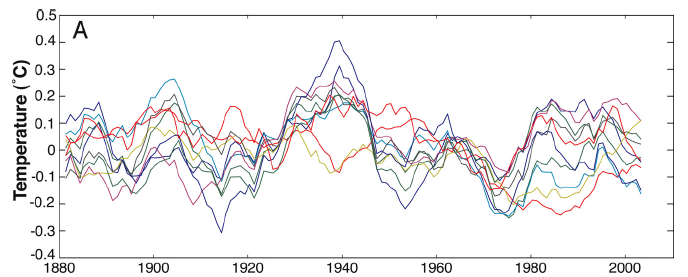
Figure 3: Estimation of the observed signature of internal variability in the observed 20th century global mean temperature in climate model simulations

As you can see, over periods of a few decades, modeled internal variability does not cause surface temperatures to change by more than 0.3°C, and over the entire 20th Century, its transient warming and cooling influences tend to average out, and internal variability does not cause a long-term temperature trend.

Smith et al. 2007

Lindzen's article proceeds with an even worse misrepresentation of Smith et al. 2007 (emphasis added):

"scientists at the UK’s Hadley Centre for Climate Research recently noted that their model did not appropriately deal with natural internal variability thus demolishing the basis for the IPCC’s iconic attribution (Smith et al, 2007). Interestingly (though not unexpectedly), the British paper did not stress this. Rather, they speculated that natural internal variability might step aside in 2009, allowing warming to resume."

So according to Lindzen, Smith et al. (2007) "demolishes the basis" for attributing global warming over the past century to anthropogenic influences.  I'm sure this interpretation of their work would come as a shock to the authors, who conclude as follows:

"We present a new modeling system that predicts both internal variability and externally forced changes and hence forecasts surface temperature with substantially improved skill throughout a decade, both globally and in many regions. Our system predicts that internal variability will partially offset the anthropogenic global warming signal for the next few years....Both NoAssim and DePreSys, however, predict further warming during the coming decade, with the year 2014 predicted to be 0.30° ± 0.21°C [5 to 95% confidence interval (CI)] warmer than the observed value for 2004. Furthermore, at least half of the years after 2009 are predicted to be warmer than 1998, the warmest year currently on record."

DePreSys is a dynamical climate model which takes into account the observed state of the atmosphere and ocean in order to predict internal variability, while NoAssim is identical to DePreSys, but does not assimilate the observed state of the atmosphere or ocean or predict internal variability.  Smith et al. used these models to compare the accuracy of the model global temperature hindcasts back to 1982 (Figure 4).

Smith et al Fig 2A

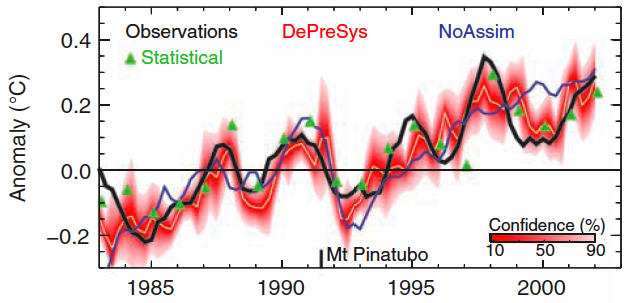
Figure 4:  Smith et al. (2007) temperature hindcasts for the DePreSys model (red, accounting for internal variability) and NoAssim (blue, no  internal variability)

As you can see, the DePreSys model (which accounts for internal variability) matches the short-term temperature changes significantly better than the NoAssim model.  However, both models produce the same warming trend.  So how does Lindzen conclude that this paper "demolishes the basis" for man-made global warming when accounting for natural variability does not change the warming trend?  Your guess is as good as mine, but it's clearly a gross misrepresentation of the results of the study.

Wrong for Two Decades, Again

As with many of Lindzen's arguments, he's been making this one for a long time.  In his 1989 MIT Tech Talk, Lindzen similarly argued that global warming boiled down to little more than internal variability.

"What we have is data that says that maybe [warming] occurs, but it's within the noise....The point we have to keep in mind is that without any of this at all our climate would wander--at least within limits."

However, as we've shown in this post, contrary to Lindzen's claims, internal variability simply cannot account for the warming over the past century.  The magnitude of the observed warming is too large, and the fact that the entire climate system is warming tells us that an external forcing is at work.  Perhaps most disturbing is Lindzen's misrepresentation of other climate scientists' work in defending his fundamentally flawed argument.

Bottom line, as convenient as it would be, it's not internal variability!

0 0

Printable Version  |  Link to this page

Comments

Prev  1  2  3  Next

Comments 51 to 100 out of 132:

  1. #49 Adelady: "I'm having a problem with what you're getting at." Well said. Don't you enjoy it when a new 'skeptic' breezes in and seems to know immediately that everything here is wrong and that only he or she is in possession of the whole Truth? Except: #25: "I have no idea of the natural noise of the system" Great! Let us know when that quantity is available; until then, this 'natural variability' argument is moot. #23: "variations of the heat content can occur with small imbalances due to any cause of variability (for instance oceanic circulation), without "cooling" anything anywhere." That's fun because it conflicts neatly with #43: "Some regions can cool, like the Gulf coast, but not because the conservation of anything" Of course, parts of the 'cool' Gulf Coast are now sweltering in the 90s and suffering in drought; other parts wait as the 500 year flood heads their way. #45: "I would be interested in continuing the discussion if I were sure that it could be hold in an open and peaceful way, without censorship ... so good bye. " And the inevitable cry of censorship. And like others who've said 'goodbye,' unfortunately that word doesn't mean much. Here - exactly two comments later, we get the beautifully circular #47: "All this wouldn't be contradictory with the fact that the warming is still compatible with the natural variability (which doesn't mean that it proves there is no anthropogenic component)" All I can take from that last is that it could be this or it could be that; our new expert really doesn't have anything of substance to contribute after all. That's great science.
    0 0
  2. johnny I am perplexed by your contributions to this thread. You seem to be postulating a long term "natural variability" whereby heat is transported into the atmosphere @49. From what I understand you do not believe this heat is from the Sun (either directly by increased insolation or indirectly via increased trapping of outgoing energy) and so it is from another part of the Earth. However you have repeatedly suggested that people should not expect a cooling region of the planet to compensate for the warming atmosphere (by the statement "the Earth is not a closed system"). Where, then, is this energy coming from if not from the Sun ?
    0 0
  3. johnny - The major issues with "internal variability" for warming on a century+ timescale are (A) a lack of evidence for them, (B) a lack of a plausible physical mechanism for them, and (C) a perfectly adequate explanation in CO2 forcing. The energy accumulation in atmosphere, surface, and primarily ocean over the last 150 years or so is large and sustained - cloud and water vapor (Lindzen's favorites) have quite fast responses to conditions, and do not seem capable of a sustained off-equilibrium forcing. So: if you (or Lindzen) claim it's internal variability, then show it. And in addition, demonstrate why the well understood physics of greenhouse gas behavior does not account for the warming. That's a two-fer; the physics and reality of CO2 forcing provide a clear explanation for the observed climate change - you need to show why that isn't the case. As to Lindzen's credibility - he has been shown to be wrong multiple times, in peer reviewed articles, about the iris effect (nope), tropical cloud response as a measure of global sensitivity (debunked), and speed of warming WRT sensitivity (nonsense, and debunked). The discussions here are in large part a response to Lindzen continuing to publicly state sillyness that cannot stand up to peer review. Finally, as to the discourse here: Your snappy dismissals of various measures of variability do you little credit, and prove not a thing other than an unwillingness to discuss the evidence. If you are as knowledgeable as you claim, then present the data, hypotheses, and papers that support your view.
    0 0
  4. Johnny "If you're not yourself very good professional scientists, with a very good knowledge of what you're dealing with, it's very unlikely that you'll be able to bring a valuable piece in the debate. Are you claiming you are ?" Good grief no! Like many others here, I'm not a scientist at all. I'm just an interested person who's willing (not as often as I should be I'll admit) to plough through scientific papers that interest me. I'm deeply grateful to others, more skilled than I am, who put in the time to highlight the meanings of items which, very often, I've not grasped as clearly as I'd like. The value I can bring is simply to ask relevant questions, or to refer to other items I've come across, or to encourage or thank those who put in extra work for the benefit of readers. "... unidentified, spontaneous cycles..." This I find puzzling. I can see where there will be occasional coincidences of an exceptional phase of a very long cycle like the thermohaline circulation with a strong La Nina and the IOD going a bit haywire - on a long enough time scale this might recur and look like a "cycle". The only reason I can think of for a cycle to be unidentified is that it is much longer than, say, Milankovitch. If that is the case, I can't see how it would be relevant to current warming. We know where we are with Milankovitch and, for all intents and purposes it's irrelevant. We're talking a couple of centuries with this warming process, Milankovitch (or any other cycle as long or longer) is about millennia.
    0 0
  5. Phil, sorry, you're addressing very basic issues that should be obvious if you want to discuss these topics. Of course the energy comes from the sun - and is, in a very large extent, reemitted towards the deep space. The enthalpy change is only an extremely tiny part of the amount absorbed and reemitted by the Earth. That's why energy conservation is not a problem - there is much more energy than what you need to "warm" the Earth by a fraction of degree - you only need less than 0.1 % of this energy. So arguing that these 0.1 % could not stem from natural variations because of conservation of energy is not justified. To be a little bit more mathematical. Energy conservation doesn't imply ∆H = 0 since the Earth is an open system. It only implies ∆H = Fin-Fout (I hope notations are obvious). Now quasi steady state implies on average ∆H=0 so Fin=Fout, and you expect Fout being some complicated function of the average temperature. So the equation Fout(T) = Fin gives an implicit equation whose solution determines implicitly the equilibrium temperature. For an isothermal black body for example, Fout = S. sigma.T^4. So what is "unforced" variability ? it is the fact that for a complex system, the relation Fout(T) is by no means univocal and can depend on very complicated things like snow or vegetation coverage, oceanic circulations, cloud coverage, and so on. So even with a constant input energy, the equilibrium temperature can fluctuate, and you can even easily get spontaneous cycles when the system never reaches the equilibrium solution - that is the essence of the predator-prey model, or the ENSO. The ENSO exists because the coupled ocean-atmosphere system is never stable - the equilibrium value is unstable, if you prefer, because strong non-linear, delayed feedbacks make the temperature and the function Fout(T) vary continuously. These cycles exist both in observations and in computations, there is no doubt that they do exist. The only question is about their amplitude and their frequency. Now energy conservation has nothing to do with these questions - energy is not conserved during an oscillation. They only depend on very complicated features of non linear couplings and are totally dependent on the system you consider. Now people like KR argue that : (A) a lack of evidence for them : wrong of course, there is plenty of evidence for decadal oscillations, and good hint for secular ones. Even the variations of climate between MO and LIA seem to imply changes in thermohaline circulation. (B) a lack of a plausible physical mechanism for them : wrong again, these kind of oscillations are very common in natural non-linear system, and again hints for their existence do exist. (C) a perfectly adequate explanation in CO2 forcing : circular argument : the question is precisely whether we can explain a part of these variations without CO2 forcings. You cannot answer this question by saying that no, because we can explain them with CO2 only ! the point raised by Lindzen is precisely that there may be other explanations - and as far as I can judge, it has not been really disproved.
    0 0
    Moderator Response:

    [DB] Note to all: johnny is Gilles under a new account name.  Please refrain from replying to him.  He has returned to waste yet more time of others.

  6. Re #50, "both arguing that contrarian blogs cannot contradict peer reviewed articles, and using your own blog to dismiss the work of real scientists." No, you are the one playing games. Had you read the multitude of posts on this site, including the one I referred you to, you should have noticed that it extensively cites the scientific literature. Moreover, John Cook et al. do not choose to distort the science in their favour like WUWT routinely does. Real scientists follow this site, so that myth has been busted. Also, John would have more scientists endorsing him publicly in writing if it were not for the fact they were working for Federal agencies. Lindzen's work has been refuted by his fellow scientists and by the observations, and their efforts are reproduced here in a format that is more accessible to the public. " you're playing a strange game here -but I think that what Lindzen says is that we cannot exclude possible long term variations - that are unnamed since they may be not identified." Please support such assertions, preferably with a link to where he said it. Also, please present a model which explains the observed warming as well as the known fingerprints associated with enhanced GHG fingerprints, and which does not have internal inconsistencies like Lindzen's musings. Yet again Occam's razor applies, one does not have to invoke mystical, hitherto undetected long-term variation to explain the observed warming. I'm also curious when this mystical long-term cycle will peak and set off a long-term cooling of global temperatures.
    0 0
    Moderator Response: [DB] Sorry, Albatross. johnny is a ghost; revealed to be Gilles in disguise. I've implemented measures to ensure johnny not being a further distraction.
  7. Oh wonderful. And Gilles is probably perplexed why 'skeptics' have no credibility. Suites me fine :)
    0 0
  8. "a perfectly adequate explanation in CO2 forcing : circular argument : the question is precisely whether we can explain a part of these variations without CO2 forcings. You cannot answer this question by saying that no, because we can explain them with CO2 only ! the point raised by Lindzen is precisely that there may be other explanations - and as far as I can judge, it has not been really disproved." Johnny = Gilles? I was wondering where I smelled logic like this before. "Officer, you're wrong. I wasn't doing 75 in a 50. Your radar gun is bad. Somewhere there may exist a radar gun that would correctly measure my speed, and since you can't disprove that possibility then I have done nothing wrong."
    0 0
  9. The frequent use of " : " was a clue.
    0 0
  10. Thanks Daniel.
    0 0
  11. I find it rather irritating that Gilles tells us he doesn't have time to give us a physics lesson, then proceeds to make an unphysical argument. Some unnamed, unknown cause of centennial internal variability, which somehow makes both the oceans and air warm, is to blame? Sounds like a 'magical natural cycles' argument to me. For his next trick, Gilles will disappear!
    0 0
  12. @Dana1981 - Even if you're right, "mercilessly" simplifies. A significant component of unforced multidecadal variability in the recent acceleration of global warming. DelSole, Tippett and Shukla, 2010. There is a sentence: “While the IMP can contribute significantly to trends for periods of 30 yr or shorter, it cannot account for the 0.8°C warming that has been observed in the twentieth-century spatially averaged SST.” ... but nevertheless (also): “The warming and cooling of the IMP matches that of the Atlantic multidecadal oscillation and is of sufficient amplitude to explain the acceleration in warming during 1977–2008 as compared to 1946–77 ...” In the past, even as big a change as the passage MCA - LIA may be caused by - “by INTERNAL VARIABILITY” Medieval Climate Anomaly to Little Ice Age transition as simulated by current climate models, González-Rouco et al., 2011.: “Therefore, under both high and low TSI change scenarios, it is possible that the MCA–LIA reconstructed anomalies would have been largely influenced by INTERNAL VARIABILITY. [...]” INTERNAL VARIABILITY is not only a redistribution of energy absorbed by the ocean, it is also a change in ocean circulation or strengthening - weakening - AMOC, ENSO, local circulation. It has an effect on the accumulation of energy by the ocean - change of place accumulation - the increase (and by changing the quantity of GHGs - water vapor, methane, CO2 - and the clouds - the spatial resolution). Today we see that part of the ocean, energy is lost - the obvious influence of ocean circulation. ... And for those circulations influences INTERNAL VARIABILITY. Solar Influences on Climate, Gray et al., 2010. : “... anthropogenic forcings are needed to explain the observations after about 1975. It should be noted that this is true globally as well as in many, but not all, regions, indicating that internal variability is larger in some regions than in others and also is larger than in the global means.” ... Top Of the Atmosphere (TOA): Estimations of climate sensitivity based on top-of-atmosphere radiation imbalance, Lin et al., 2009. . : “Currently, there is a lack of high accuracy measurements of TOA radiation imbalance.” “The range of feedback coefficient is determined by climate system memory. The longer the memory, the stronger the positive feedback. The estimated time constant of the climate is large (70-120 years) mainly owing to the deep ocean heat transport, implying that the system may be not in an equilibrium state under the external forcing during the industrial era.” “Furthermore, the climate feedbacks should include not only short-term (including instantaneous) responses but also longer time scale (or historical) responses because the climate generally has certain memories, which are omitted in these energy balance models.” “The range of feedback coefficient is determined by climate system memory. The longer the memory, the stronger the positive feedback. The estimated time constant of the climate is large (70 ~120 years) mainly owing to the deep ocean heat transport, implying that the system may be not in an equilibrium state under the external forcing during the industrial era.” @ adelady 1. The sun's been a bit cooler the last few years. And so what? The sun has always acted with considerable delay (probably many, many times I will have to resemble). Sub-Milankovitch solar forcing of past climates: Mid and late Holocene perspectives, Helama et al., 2010.: “Thus, the warmer and cooler paleotemperatures during the Medieval Climate Anomaly and Little Ice Age were better explained by solar variations on a millennial rather than bimillennial scale. The observed variations may have occurred in association with internal climate amplification [...] (likely, thermohaline circulation and El Niño–Southern Oscillation activity). THE NEAR-CENTENNIAL DELAY in climate in responding to sunspots indicates that the Sun's influence on climate arising from the current episode of high sunspot numbers may not yet have manifested itself fully in climate trends.” “... 70 ~120 years ...”, “... NEAR-CENTENNIAL DELAY ...” - After that time the climate will respond to the fact that: “The sun's been a bit cooler the last few years ...”, NO EARLIER !!!
    0 0
  13. @KR. (and evidence of what writes johnny) “The energy accumulation in atmosphere, surface, and primarily ocean over the last 150 years or so is large and sustained ...” Ocean after 2003 - has stopped - at a fast rate - to collect energy. Change 1993-2003 is “a swept” - circa 90% growth this year 1993-2003 - the period of phase change (cold - hot) in the AMO + course ENSO (most of the energy is absorbed by the ocean in the tropics ). Hansen, Sato and Kharecha, ( Earth's Energy Imbalance and Implications, 2011.) explained it this way: “Aerosol climate forcing today is inferred to be ‒1.6 ± 0.3 W/m2, implying substantial aerosol indirect climate forcing via cloud changes. Continued failure to quantify the specific origins of this large forcing is untenable, as knowledge of changing aerosol effects is needed to understand future climate change. A recent decrease in ocean heat uptake was caused by a delayed rebound effect from Mount Pinatubo aerosols and a deep prolonged solar minimum.” Suddenly the sun and volcanoes are important? However, this is probably just the heat stable phase of the AMO and ENSO - internal variability ... Once again I remind the conclusions of the paper:Climate change and solar variability: What's new under the Sun?, Bard and Frank, 2006.: “Overall, the role of solar activity in climate changes — such as the Quaternary glaciations or the present global warming — remains unproven and most probably represents a second-order effect.Cyclic variation and solar forcing of Holocene climate in the Alaskan subarctic, Hu et al., 2003.: “Our results imply that SMALL variations in solar irradiance induced pronounced cyclic changes in northern high-latitude environments. They also provide evidence that centennial-scale shifts in the Holocene climate were similar between the subpolar regions of the North Atlantic and North Pacific, possibly because of Sun-ocean-climate linkages.Response of Norwegian Sea temperature to solar forcing since 1000 A.D., Sejrup,2010.: “The observed ocean temperature response is larger than expected based on simple thermodynamic considerations, indicating that there is dynamical response of the high‐latitude ocean to the Sun. [...]” “dynamical ...” - modulation of “internal variability”? I agree that external factors were most important in the last 500 years. Influence of human and natural forcing on European seasonal temperatures, Hegerl et al., 2011.: “In particular, we find that external forcing contributes significantly ( p <5 % ) to the reconstructed long-term variability of winter and spring temperatures and that it is responsible for a best guess of 75 % of the observed winter warming since the late seventeenth century. Summer temperatures show detectable ( p <5 % ) interdecadal variations in response to external forcing before 1900 only.” Here I disagree with this sentence: ” This warming is largely attributable to greenhouse-gas forcing.” In this paper is the conclusion that the volcanoes warm up - like a fingerprint - as A. GHGs - make the winters are warmer: “Finally, throughout the record we detect highly significant summer cooling and significant winter warming following volcanic eruptions. [!!!]” External forcing as a metronome for Atlantic multidecadal variability, Otterå et al., 2010.: “We find that volcanoes play a particularly important part in the phasing of the multidecadal variability through their direct influence on tropical sea-surface temperatures, on the leading mode of northern-hemisphere atmosphere circulation and on the Atlantic thermohaline circulation.” And the Sun (with a lag - "a second-order effect") affects the volcanic activity About possible influence of solar activity upon seismic and volcanic activities: long-term forecast, Khain & Khalilov, 2008. - see Pic. 5 and Pic. 6 (influence “a second-order effect”) - strict correlation. Volcanoes affect the ozone. And ozone has been discussed on this website a few days ago: "The ozone hole is not even mentioned in the summary for policymakers issued with the last IPCC report," noted Lorenzo M. Polvani, Professor of Applied Mathematics and of Earth and Environmental Sciences, Senior Research Scientist at the Lamont-Doherty Earth Observatory, and co-author of the paper. "We show in this study that it has large and far-reaching impacts. The ozone hole is a big player in the climate system!" "It's really amazing that the ozone hole, located so high up in the atmosphere over Antarctica, can have an impact all the way to the tropics and affect rainfall there - it's just like a domino effect," said Sarah Kang, Postdoctoral Research Scientist in Columbia Engineering's Department of Applied Physics and Applied Mathematics and lead author of the paper.” Testing solar forcing of pervasive Holocene climate cycles, Turney et al., 2005. : “The cycles, however, ARE NOT COHERENT WITH CHANGES IN SOLAR ACTIVITY (both being on the same absolute timescale), indicating that Holocene North Atlantic climate variability at the millennial and centennial scale IS NOT DRIVEN BY A LINEAR RESPONSE to changes in solar activity.” Gray et al., 2010. once again: “In discussion of solar forcing and global change, it is important to note that the climate system has a chaotic element, so the climate response to solar (and OTHER FORCINGS) can be attributed partly to forced variability and partly to INTERNAL VARIABILITY.” In addition: Solar forcing of the terrestrial atmosphere, Dudok de Wit & Watermann, 2009.: “... the main mechanisms by which the Sun affects the Earth are not the most immediate ones in terms of energetic criteria.” “- feedback mechanisms are not sufficiently well understood and positive feedback may be much stronger than expected ...” “According to the IPCC, over the last century, this impact has most likely been small as compared to anthropogenic effects. There are several important working fronts as far as the Sun–Earth connection is concerned. Most GCM whose development started in the lower atmosphere still largely ignore the upper part of the atmosphere on which solar variability has the largest impact.” Internal variability. According to Lindzen - internal variability is decisive - mainly through regional influence - globally decisive. The role of any external force (not just GHG) emissions - is - according to him - a very small minority, initiating change. I do not agree with him (The Sun is very important -"second-order effect"), but I think he does have "strong arguments" - in support of his claim. There is no place for his dishonesty. Dana1981 - once again, your analysis is absolutely too poor in the reference ...
    0 0
  14. It is interesting that the 'internal variability' argument has now shifted to the deep ocean... the last remaining large area of the Earth for which we do not have significant data. Purkey & Johnson 2010 shows warming even there, but it is the first real effort at analyzing temperature trends for water that deep and only covered a small portion of the deep ocean for a limited time frame. In short, all available evidence indicates that the deep oceans are warming too, but that evidence is limited enough that Lindzen can apparently still hold out hope that it is wrong. Yet what plausible explanation would there be for a massive transfer of heat from the ocean depths to waters closer to the surface and the atmosphere over the course of the past century? Lindzen doesn't even attempt to provide one. Further, if the atmospheric warming were being caused by heat transfer from the deep oceans it would not show the greater warming at night than during the day which has been observed. Ditto stratospheric cooling. So we have a hypothesis contradicted by data from multiple lines of evidence and not supported by any data at all... yet still they cling to it.
    0 0
  15. 63, Arkadiusz Semczyszak at 20:25 PM on 10 May, 2011
    Suddenly the sun and volcanoes are important?
    This is an unnecessarily caustic statement. No, they're not "suddenly" important, nor were they ever unimportant. They're part of the system. They aren't driving current climate change, but they are important factors (and I'm sure you know this, and the comment was foolish of you to make).
    Once again I remind the conclusions of the paper:Climate change and solar variability: What's new under the Sun?, Bard and Frank, 2006...
    Bard 2006 was full of non-information and non-comments and non-conclusions. The paper is not worth citing for anything, because it proved absolutely nothing. The conclusion is a collection of but-what-ifs:
    Unfortunately, precise data are limited to the satellite era... Conflicting views exist... ...may contribute to answering... Solar records are intrinsically incomplete for periods prior to the past three decades... It appears that solar fluctuations were involved... The currently available reconstructions of geomagnetic field intensity and cosmogenic nuclide production are still not sufficiently precise to extract a meaningful solar component... ...we await more reliable and longer records...
    The paper proves and says nothing. Citing a paper that says "look, it still might be the sun" (I'm paraphrasing, of course) is hardly a substantive argument. Rather than dismantle all of your references, I think I should point out that being able to compile a gish-gallop of citations of papers does not constitute a valid argument. There are any number of "skeptical" papers, or skeptical sounding comments in real science, that you could draw from to "prove" that Trenberth is actually an alien from the Betelgeuse star system, and is bent on transforming the earth to make it habitable for colonization by his species. The fact is that current climate science has pretty much proven that solar variations have comparatively little to do with current warming, while greenhouse gases do. Your position is pretty well summed up by this comment of yours:
    Here I disagree with this sentence: ” This warming is largely attributable to greenhouse-gas forcing.”
    The point being the you disagree, and you can find lots of words published by people who share your opinion... but have little in the way of facts or substantive arguments to support that position. Come back with a paper that actually proves something. Find a paper that says something other than "it might be" or "it could be" or "we don't know." And yet, at the same time, you are able to completely ignore the vast body of scientific evidence that points towards the effects of greenhouse gases. This is hardly a scientific approach. In your own words:
    There is no place for his dishonesty.
    On that point, at least, we agree. Also, please refrain from the use of all caps, especially in conjunction with a bold font. It's offensive. The words carry the content and do not need to be shouted.
    0 0
  16. Arkadiusz - "Ocean after 2003 - has stopped - at a fast rate - to collect energy." Tamino has some interesting things to say about 2003 and OHC, namely that using that date is cherry-picking. See the residual variation around the OHC trend line: Why not pick 2002, which lies on the trend line, providing a more honest short term trend? Or 2001, which I could choose to "show" a short term (statistically completely insignificant, like trends since 2003) warming? But no, all skeptics arguing this seem to choose 2003, with the highest residual and hence least representative single sample possible. That is a distortion of the evidence. 5-6 years is far too short a time for statistically significant analysis - cherry-picking high residuals in the short term variation is a meaningless argument.
    0 0
  17. KR#66 The bit you have failed to mention is the source of the OHC data. Before 2001-03 it was XBT and other measurements. After 2003 Argo was the main source. Argo is not perfect, but the spatial and numerical distribution of 3500 floats alone must give far greater accuracy to OHC measurement. Therefore the last 5-6 years is the most accurate meaurement - and before that - the measurement far less accurate - probably pretty useless in fact. So to claim that using the most accurate recent part of the the OHC record is 'cherry picking' - is simply wrong. Anyone who understands the first law can also make the leap to the critical point that any warming imbalance must show up somewhere in the Earth system as heat energy - over 90% stored in the oceans. OHC increase is a direct measure of TOA imbalance. Accurate measurement of OHC will make or break the AGW case.
    0 0
  18. Ken Lambert - I'm well aware of the data sources; ARGO started deployment around 2000, and XBT and other measurements preceded that. I'm always saddened by claims that "imperfect data" means "no data at all" - that's tantamount to claiming that without perfect knowledge we know nothing at all, which is a fallacy. XBT data has some serious calibration issues and requirements to extract meaningful data, and ongoing reanalysis of the data and collection methods have continually improved it. Nothing is perfect, but it's certainly not invalid data as you claim. It provides a great deal of data for determining a statistically relevant trend line. On the other hand, given the variation seen in even the ARGO data (+/-2*10^22 joules over 3 years or so) a 5-6 year average is not statistically significant. To wit: "the fallacy of incomplete evidence is the act of pointing to individual cases or data that seem to confirm a particular position, while ignoring a significant portion of related cases or data that may contradict that position" - classic cherry picking.
    0 0
  19. Arkadiusz - variability is noise and trend is signal. You're arguing a strawman. Nobody disputes that internal variability accounts for much of the temperature variability. Indeed, I specifically discussed this in the article (see Figure 4).
    "Dana1981 - once again, your analysis is absolutely too poor in the reference"
    The feeling is mutual.
    0 0
  20. Even setting aside the ridiculous cherry picking involved in 'data since 2003'... that time period is clearly irrelevant when examining claims that the sharp increase in global air temperatures over the 20th century was caused by 'internal variability'. Heck, it isn't even a valid argument for a claim that 'atmospheric warming since 2003 has been caused by internal variability'... because both do still show warming. Warming at a slower rate than recent decades, but still warming... from both sources. Ergo, any 'internal variability' which is going on is getting overwhelmed by an external forcing.
    0 0
  21. Some thoughts on issues surrounding the Argo data by some eminent scientists-- caution, findings may upset "skeptics", contrarians and deniers of AGW. From Hansen et al. (2011), link provided below: "An alternative potentially accurate approach to measure Earth's energy imbalance is via changes in the ocean heat content, as has been argued for decades (Hansen et al., 1997) and as is now feasible with Argo data (Roemmich and Gilson, 2009; Von Schuckmann and Le Traon, 2011). This approach also has sampling and instrument calibration problems, but it has a fundamental advantage: it is based on absolute measurements of ocean temperature. As a result, the accuracy improves as the record length increases, and it is the average energy imbalance over years and decades that is of greatest interest.

The error estimated by von Schuckmann and Le Traon (2011) for ocean heat uptake in the upper 2000 m of the ocean, ± 0.1 W/m2 for the ocean area or ± 0.07 W/m2 for the planetary energy imbalance, does not include an estimate for any remaining systematic calibration errors that may exist. At least some such errors are likely to exist, so continuing efforts to test the data and improve calibrations are needed. The Argo program needs to be continued and expanded to achieve further improvement and minimization of error." Also, "A verdict is provided by the ocean heat uptake found by von Schuckmann and Le Traon (2011), 0.42 W/m2 for 2005-2010, averaged over the planet. Adding the small terms for heat uptake in the deeper ocean, warming of the ground and atmosphere, and melting of ice, the net planetary energy imbalance exceeded +0.5 W/m2 during the solar minimum.

This dominance of positive climate forcing during the solar minimum, and the consistency of the planet's energy imbalance with expectations based on estimated human-made climate forcing, together constitute a smoking gun, a fundamental verification that human-made climate forcing is the dominant forcing driving global climate change. Positive net forcing even during solar minimum assures that global warming will be continuing on decadal time scales." Go here for the Hansen et al. (2011) paper. Go here for the von Shuckmann and Le Traon (2011) paper. This is clearly yet another no win for Lindzen and Spencer. Shameful then that Lindzen insists on knowingly misleading the public, politicians and policy makers on the science.
    0 0
  22. Tamino, has really outdone himself this time, totally eviscerating the BS (bad science) that the 'skeptics' are so fond of using to deceive. So simply, yet utterly devastating... All data below are 5-year averages to filter out most of the noise. Red line is the Lowess smooth of the original data. GISTEMP global surface air temperature anomalies Global sea level rise 0-700 m Oceanic Heat Content (Minimum?) Arctic sea-ice extent anomaly Atmospheric CO2 These are datasets that the 'skeptics' and deniers routinely try and manipulate, distort, cherry-pick and misrepresent in order to deceive and trick.
    0 0
  23. Albatross - Tamino has outdone himself this time. Simple enough that anyone can understand the data treatment, clear enough that even in dim light, under the worst conditions, after several stiff drinks, that it's still evident what's going on. Many skeptic arguments these days seem to consist of cherry picking and graphic presentation sins, primarily concerning the Ocean Heat Content (which is both one of the most important values and considered the easiest to disagree with). Personally I find this disappointing - same old same old. I would really love to see a true skeptic argument against GHG driven global warming - one based on real-world data, with some theory behind it. But these days I'm not holding my breath waiting.
    0 0
  24. KR -
    "I would really love to see a true skeptic argument against GHG driven global warming - one based on real-world data, with some theory behind it."
    We'll present Lindzen's alternative to AGW in Lindzen Illusion #7, coming in a few days. I can't say it's based on real-world data though, as the post will show.
    0 0
  25. Albatross #72 Where did Tamino get the OHC chart from? I went to the site and could find no reference. It does not even compute with Fig 1 from the top of this thread. dana1981 #74 "We'll present Lindzen's alternative to AGW in Lindzen Illusion #7, coming in a few days. I can't say it's based on real-world data though, as the post will show." You must have beaten Lindzen to death by now - surely not another beat-up in #7. I notice that you have not included Dr Pielke Snr in the firing line. He seems well respected enough to correspond with leading ocean heat scientist Josh Willis and publish their email exchange on his website. This from 13FEB11: http://pielkeclimatesci.wordpress.com/2011/02/13/update-of-preliminary-upper-ocean-heat-data-analysis-by-josh-willis-%e2%80%93-%e2%80%9can-unpublished-update%e2%80%9d/ It seems that Willis **preliminary** analysis of the Upper Ocean Heat Content 2005-2010 is showing around 0.16W/sq.m globally. If we add Purkey & Johnson's number of about 0.1W/sq.m from the deep oceans the total is about 0.26W/sq.m globally. This is a lot less than Hansen's 0.6W/sq.m and Dr Trenberth's putative global warming imbalance of 0.9W/sq.m.
    0 0
    Response:

    [DB] Willis himself had this to say:

    This estimate only goes back to 2005. The reason for this is that Argo still has a number of floats for which no PI has responsibility for quality control of the data. For early incarnations of these floats, this could mean that significant (albeit correctable) biases still exist in the pressure data. Normally, these biases are corrected by the PI, but since these floats are sort of homeless, they have not yet been corrected. It is also difficult (or in many cases impossible) for the end user to correct these pressure data themselves. Argo is still trying to figure out how to deal with these data and I sure they will receive bias corrections eventually, but for the moment we need to exclude them. So, for this reason I am still not comfortable with the pre-2005 estimates of heat content. – Josh Willis

    The uncertainties will eventually be hammered out; the gap will eventually close.  Your earlier suggestion of a global gridded system of floats to measure the deep waters as well remains a good one.  The task is to convince someone to pay for it...

  26. Ken @75, He uses the NODC data, the same data Tisdale manipulated and cherry-picked to hide the incline. "You must have beaten Lindzen to death by now.." "...not included Dr Pielke Snr in the firing line." " Dr Trenberth's putative global warming imbalance of 0.9W/sq.m" Please tone down the innuendo and rhetoric. And one last request, please read the paper just published by von Shuckmann and Le Traon (2011)...there are hyperlinks provided above.
    0 0
  27. DB & Albatross #75 #76 Thank you for acknowledging my suggestion of a "global gridded system of floats to measure the deep waters as well remains a good one. The task is to convince someone to pay for it..." China (a 20% AGW contributor) is cashed up at the moment - maybe a call to Mr Hu?? This is from von Shuckmann and Le Traon (2011) - (excuse the length of the quotation) Quote "Many attempts have been made to estimate long-term as well as recent global OHC changes. But the underlying uncertainties in ocean warming are still unclear. An overview on the different analyses estimating OHC can be found in Lyman et al. (2010). For example, several teams have recently produced different multi-year estimates of the annually averaged global integral of upper-ocean heat content anomalies. Patterns of interannual variability, in particular, differ among methods. Especially correction methods of historical measurements (XBTs) dominate among method variability in estimating this GOI (Domingues et al., 2008; Lyman et al., 2010; Gouretski and Reseghetti, 2010). Recent short term estimations of global OHC are mostly based on Argo measurements,and thus reduce possible errors due to large data gaps in space and time as well as due to inhomogeneous sampling. But nevertheless, as interannual variability of OHC is large in the long-term estimations, analyses of global OHC during the last decade differ as well among methods (von Schuckmann et al., 2009; Willis et al., 2009; Trenberth and Fasullo, 2010)." endquote All of the Argo analyses show a flattening of the Upper 700m OHC since around 2003. Your references to the Tisdale manipulated 'cherry pick' - which explicitly produces a plot of Argo analyses only, does nothing to explain why several teams analysing Argo are getting small if any OHC increase. The 'step jump' in OHC from the NODC Upper 700m plot in 2001-2003 period of transition to Argo data is glaringly apparent. This 'step jump' has never shown in any satellite record measuring TOA imbalance. The suggestion that it is quite legitimate to splice XBT, and other methods with Argo and linearize into a 1993-2010 chart timeline, yet manipulative and bogus to look at the recent and probably more accurate Argo data by itself really defies logic. We should wait for Josh Willis published analysis of the **preliminary** data he shared with Dr Pielke - however unless Dr Willis is out by a factor of 2 or 3 in his prelim analysis - the chances are that he is finding less than half the heat of von Schukmann and less than a third of the heat of the purported warming imbalance. It looks like Von Schuckmann is the likely outlier amongst the OHC analyses here.
    0 0
  28. Ken @77, I'm not sure how your quote is meant to help your case, I know that you have attached your horse to this "missing heat" cart and are reluctant to change your mindset, but please be open minded. I'm not sure why you insist on being focussed on the 0-700 m layer (although I have an idea or two), von Shuckmann's research (and that of Hansen et al. and Trenberth) suggest that one really ought to be going two to three times that depth to better capture what is going on. So using the 0-1500 m or 0-2000 m data versus the 0-700 m data makes a notable difference, and we all know that the mean depth of the oceans is much, much greater than 700 m. You say "It looks like Von Schuckmann is the likely outlier amongst the OHC analyses here. " That would be your opinion, but von Shuckmann and Le Traon (2011) is a published paper, not preliminary data as you admit. Willis is looking at only the 0-700 m Argo data (see above comments), so that makes comparison with von Shuckmann's data difficult. And that is likely the reaosn that Willis is 'finding' a much weaker warming trend. This is not new, Trenberth came to the same conclusion back in 2010. Please read Hansen et al. (2011, in review), I was quoted some pertinent portions of the text. You seemed to have missed/ignored this on the first pass (see #71 for full quotes). "A verdict is provided by the ocean heat uptake found by von Schuckmann and Le Traon (2011), 0.42 W/m2 for 2005-2010, averaged over the planet. Adding the small terms for heat uptake in the deeper ocean, warming of the ground and atmosphere, and melting of ice, the net planetary energy imbalance exceeded +0.5 W/m2 during the solar minimum.
" "The error estimated by von Schuckmann and Le Traon (2011) for ocean heat uptake in the upper 2000 m of the ocean, ± 0.1 W/m2 for the ocean area or ± 0.07 W/m2 for the planetary energy imbalance, does not include an estimate for any remaining systematic calibration errors that may exist."
    0 0
  29. Albatross #78 Thank you for the reference to Hansen (2011) in #71. I have not studied the very long paper in great detail, but this startling statement cannot be ignored: Quote "The reduction of planetary energy imbalance between 2000 and 2009 due to declining solar irradiance is about 0.14 W/m2. If there is an indirect effect magnifying the solar forcing, the calculated effect on the planetary energy imbalance must be increased by that magnification factor. As discussed in section 12.2, empirical correlations of the solar cycle and global temperature show that any magnification cannot exceed a factor of two at most. In summary, precipitous decline in the growth rate of GHG forcing about 25 years ago caused a decrease in the rate of growth of the total climate forcing and thus a flattening of the planetary energy imbalance over the past two decades. That flattening allows the small forcing due to the solar cycle minimum, a delayed bounceback effect from Pinatubo cooling, and recent small volcanoes to cause a decrease of the planetary energy imbalance over the past decade." Endquote What on earth does this mean?: "If there is an indirect effect magnifying the solar forcing, the calculated effect on the planetary energy imbalance must be increased by that magnification factor. As discussed in section 12.2, empirical correlations of the solar cycle and global temperature show that any magnification cannot exceed a factor of two at most." How can Hansen suggest that if something like Solar magnification exists it can't have a quantity more than 2. It might not exist but we can put a number on it? This is bizarre reasoning. Further, what are we to make of this?: "In summary, precipitous decline in the growth rate of GHG forcing about 25 years ago caused a decrease in the rate of growth of the total climate forcing and thus a flattening of the planetary energy imbalance over the past two decades. That flattening allows the small forcing due to the solar cycle minimum, a delayed bounceback effect from Pinatubo cooling, and recent small volcanoes to cause a decrease of the planetary energy imbalance over the past decade". 0.9W/sq.m down to 0.5W/sq.m is not a flattening - it is a large drop. So the ripple of the 11 year solar cycle of amplitude 0.25W/sq.m (0.13W/sq.m from a mean), plus delayed Pinatubo effects and small volcanoes have dropped the planet's imbalance from 0.9W/sq.m to 0.5W/sq.m (von Schukmann OHC calc) over the last decade. Funny how I never heard this argument highlighted on SKS before. The 'delayed Pinitubo' effect seems hard to believe in energy uptake terms. The aerosols either reflect incoming energy while they are there and don't reflect it when they dissipate. How can this effect be 'delayed'? Was not the CO2GHG effect plus positive feedbacks from WV and ice albedo supposed to have a forcing effect which produced an increasing warming imbalance as CO2 emissions have risen in absolute terms? Even then, Hansen only quotes von Schukmann's Argo OHC analysis to produce the 0.5W/sq.m warming imbalance, and nowhere in the discussion could I find Josh Willis' analysis mentioned. Dr Willis is only mentioned as co-author in a couple of papers in the reference list, despite being one of the most prominent scientist involved in Argo analyses. There are several other Argo analyses which Hansen seems to ignore in the text as well, choosing only the highest number from von Schukmann to weave his analysis around. This is an extraordinary paper from the leading proponent of AGW. There will be a lot of bafflement flowing from this one, and I will have tickets for a front row seat.
    0 0
  30. 79, Ken Lambert,
    It might not exist but we can put a number on it? This is bizarre reasoning.
    My Lord, the section you quoted even tells you where to look. You could bother to glance at it (it's a pretty short section) before labeling it "bizarre reasoning." From the paper:
    Tung et al. (2008) argue that observed global temperature change in recent decades reveals a response in phase with solar irradiance change, with amplification up to a factor of two greater than expected from the direct solar forcing. However, the analysis of Tung et al. does not fully remove the effect of volcanic eruptions that occurred approximately in phase with the solar cycle, so their inferred amplification is an upper limit on what is possible. We use the measured solar variability (Fig. 21) to define the solar forcing for calculations without any amplification for indirect effects. However, we bear in mind that there remains a possibility that moderate amplification of the direct solar forcing exists.
    Really, Ken, it's not that difficult to get it right (although it's certainly very, very easy to just cast random aspersions).
    0 0
  31. 79, Ken,
    The aerosols either reflect incoming energy while they are there and don't reflect it when they dissipate. How can this effect be 'delayed'?
    Again, why don't you just read the relevant section of the paper? It's all of 2 short paragraphs long. Just search for the word "rebound" (it only occurs 4 times in the document). Come on, Ken. It's one thing to take an educated stance on something, and it's another to take an intricate, complicated, pretend-to-be-educated stance on something... but it's really unnecessary to just drop all sorts of "what the f..." attacks on something that you admit that you yourself just haven't bothered to read and comprehend. It just doesn't "look right" to you, when you read bits and pieces without bothering to study the whole? Sheesh. Please take the time to read before disparaging something. [Now you'll go read the paper, try as hard as you can to come up with reasons why it can't be true, maybe check with Tisdale or Watts for some good ideas, and then come back with all sorts of numbers and calculations that "prove" that you and they are so much smarter than Hansen.]
    0 0
  32. 79, Ken,
    Funny how I never heard this argument highlighted on SKS before. The 'delayed Pinitubo' effect seems hard to believe in energy uptake terms.
    Gee. Do you think maybe it's because it's an idea proposed by Hansen in a paper that hasn't been published yet? Is SkS supposed to do all of its own science, and beat Hansen and Schmidt and all the others to the answers, in order to make you happy? Otherwise, it's just part of some bizarre conspiracy to hide the truth from you?
    0 0
  33. KL @ 79
    "Dr Willis is only mentioned as co-author in a couple of papers in the reference list, despite being one of the most prominent scientist involved in Argo analyses. There are several other Argo analyses which Hansen seems to ignore in the text as well, choosing only the highest number from von Schukmann to weave his analysis around."
    That’s incorrect: Wilis isn't only mentioned as a co-author on a couple of papers. Five of his papers are cited [Lyman et al (2006); Lyman et al (2010); Wijffels et al (2008); Willis et al (2007); Wong et al (2005).
    "....and nowhere in the discussion could I find Josh Willis' analysis mentioned."
    Willis's data is presented in Figures 13 and 15 and discussed extensively throughout the text. The value for the planetary imbalance for the period 1993-2008 comes pretty directly from Willis's analysis (Lyman et al 2010) etc. Since Willis hasn't published an analysis incorporating data through 2010, there in't a further Willis "analysis" to cite, and if one wants to address planetary imbalance through 2010, then von Schuckmann's is the data set currently available. And of course as Willis himself has stated, if one wants to most accurately assess ocean heat uptake (that is required for approaching more accurate planetary imbalance), one really has to consider the heat taken into the deeper oceans. So von Schuckmann's type of analysis is inherently preferable, although there's no question that there remains considerable uncertainty as indicated by the around 25% 1-sigma standard error in Hansen's numbers....
    0 0
  34. Ken Lambert wrote : This is an extraordinary paper from the leading proponent of AGW. There will be a lot of bafflement flowing from this one, and I will have tickets for a front row seat." And there we have the bizarre accusation again (after previous attempts were made to discover from Ken what it actually means in reality) of someone being a "proponent of AGW" ! It was a ridiculous concept previously and it's still ridiculous. There is cerainly a lot of bafflement from most people over the use of such a term, but I doubt whether anyone would be so obsessive as to demand front-row seats - unless they're totally consumed by some sort of imaginary ideological battle against...who knows what. (By the way, for the sensitive so-called skepics who may be reading - this is not against anyone in particular)
    0 0
  35. 84, JMurphy, Talk about evidence of ideological blinders... he starts with
    I have not studied the very long paper in great detail, but...
    and yet he is able to leap to
    ...this startling statement cannot be ignored.
    What on earth does this mean?
    It might not exist but we can put a number on it?
    This is bizarre reasoning.
    Further, what are we to make of this?
    Funny how I never heard this argument highlighted on SKS before.
    Was not the CO2GHG effect plus ... supposed to...?
    ...Hansen seems to ignore in the text as well, choosing only the highest number...
    This is an extraordinary paper from the leading proponent of AGW.
    and finally
    There will be a lot of bafflement flowing from this one, and I will have tickets for a front row seat.
    Every one of those statements is dripping with disdain and disbelief and his post is riddled with accusatory questions... on a paper he hasn't bothered to read.
    0 0
  36. I'm not convinced why Lindzen is 'wrong'. "Internal variability means that heat is just being moved around from one part of the Earth's climate system from another, i.e. in Lindzen's example, from the deep ocean layers to the surface." "Clearly this warming of the entire global climate system must be caused by an external forcing, and the radiative forcings over the past century have been dominated by greenhouse gases. " Why is an 'internal' forcing ruled out? Internal variability as a change in heat distribution around the globe also implies effects on snowcover, clouds en water vapour. This in turn changes the radiation balance and an internal forcing is born. There is obviously some long term warming trend due to increased GHG's but does this mean that, besides the known external forcings (solar cycle, aërosols), no other forcings exists? Climatologists widely believe that the initial forced GHG-warming will be amplified by a factor 2 to 4, the positieve feedbacks. Don't forget that these feedbacks, like changing ice-albedo and watervapour, disturb earth radiation budget as well and thus act like forcings. It seems to me rather odd that only and only temperature can change these parameters. Satellite measurements of reduced cloudiness (ERBE, ISCCP-clouds) implies that such internal forcings do exist.
    0 0
  37. 86, Victor,
    Internal variability as a change in heat distribution around the globe also implies effects on snowcover, clouds en water vapour.
    The forcing must be maintained. Clouds, water vapor, and even snow cover all react to temperature as well as affecting them. Without a continuous forcing, each of those feedbacks will drop back down.
    ...no other forcings exists?
    Beyond those we know of, no. Of course, there's a crowd of people trying to come up with new ones (GCR, for example), but so far these are only unproven theories, and to date evidence contradicts rather than supports these theories.
    Don't forget that these feedbacks, like changing ice-albedo and watervapour, disturb earth radiation budget as well and thus act like forcings.
    True, but as already stated, they respond to temperature, as well as affecting temperature. Without a non-temperature influenced, continuous forcing, they will eventually swing back (and generally fairly quickly, based on the climate's known reactions to volcanic eruptions and changes in solar radiance). The factors that are long lived enough to swing the climate are few:
    • Anthropogenic CO2 (non-anthro, in almost all of the rest of history, has been a very powerful, long lived feedback, rather than a forcing)
    • Changes in solar radiance
    • Changes in insolation due to orbital changes
    • Changes in insolation due to aerosols from dramatic and constant volcanic activity
    Note that the last three of those really amount to changes in insolation in different ways. Only changes in CO2 can force things without changing insolation, and in the past, that has only happened on geologic timescales through geologic mechanisms.
    Satellite measurements of reduced cloudiness (ERBE, ISCCP-clouds) implies that such internal forcings do exist.
    I don't know what this means. Can you clarify?
    0 0
  38. Victor - we addressed the hypothesis of an internal forcing in Christy Crock #3, I believe. But that wasn't Lindzen's argument, so I didn't address it here.
    0 0
  39. Sphaerica #80 #81 The resolution is poor, but if you look at Fig 22(f) of Hansen's paper, the Pinitubo (1991) 'rebound' forcing could does not scale to than +0.1-0.2W/sq.m, and it has all dissipated by 2000. Prior to that has negligible effect to the net energy uptake of the planet, because the net area under the spike and rebound roughly cancel out. To add a negligible 'decline' in the already exhausted 'Pinitubo rebound effect' to the Solar minimum for the decade 2000-2010 is just a furphy. There are several other more important things in this paper which I shal; touch on in my response to Chris #83
    0 0
  40. Chris #83 If this were a trivia night, you would win a point. Willis is mentioned once in the text on page 28 of this 52 page paper - Willis et al 2007 re Argo ie: "Even this well-planned program had early instrumental problems causing data biases (Willis et al., 2007), but it was possible to identify and eliminate problematic data." Willis is a co-author with Lyman and he is indirectly mentioned in the 5 pages of references at the end of the paper. I said a 'couple' - so you have 2 points. There is no mention of any of Dr Willis' recent 'prelim' OHC analysis and quoted by Dr Pielke. You know Chris, I have been raving on about +0.9W/sq.m net forcings from Dr Trenberth's Aug09 paper based on Hansen's 2005 estimate etc - for a long time. In the 'missing heat' discussions, Climategate - the predication of the AGW position is that 'its there but we can't measure it adequately'. We know its about 0.9W/sq.m but we can only measure about 0.5-0.6W/sq.m is a theme of Dr Trenberth's papers. This very long paper by Hansen is a game changer. He accepts that von Schukmann's measurement of the global energy imbalance is about 0.5W/sq.m, holds fast to the theoretical CO2 GHG forcing, and then proceeds to explain the reduced positive balance - chiefly by picking Aerosols as the main culprit. He argues that aerosols have a forcing of -1.6W/sq.m (negative), when prior models used around -0.4-1.1W/sq.m. Quote (pp45): "We also must quantify the causes of changes of Earth's energy imbalance. The two dominant causes are changes of greenhouse gases, which are measured very precisely, and changes of atmospheric aerosols. It is remarkable and untenable that the second largest forcing that drives global climate change remains unmeasured. We refer to the direct and indirect effects of human-made aerosols. We have inferred indirectly, from the planet's energy imbalance and global temperature change, that aerosols are probably causing a forcing of about ‒1.6 W/m2 in 2010. Our estimated uncertainty, necessarily partly subjective, is ± 0.3 W/m2, thus a range of aerosol forcing from ‒1.3 to ‒1.9 W/m2." endquote Well, I should have applied for a job with Prof Hansen, because I have been banging away with a similar argument for some time - highlighting the wide error bars on the IPCC AR4 estimate of Aerosol forcing and also the unknown amounts being added by rapid industrialization by developing countries. There are several other bafflements in this paper (eg. the flatline von Schukmann OHC figure 2005-10) - but the jaw dropper for me is that Hansen has killed the 'missing heat' hypothesis and accepted that the OHC measurement **is** the imbalance and fitted the known unknown forcings to that observation. If Dr Willis OHC analysis turns out to be 0.25W/sq.m and overrides von Schukmann - then another revision down of the warming imbalance will be necessary - and more bafflements could follow.
    0 0
  41. Ken Lambert at 00:17 AM on 15 May, 2011 Don't really understand your point about Willis, KL! His work is abundantly described in Hansen's paper, and his Lyman et al (2010) analysis forms the basis of Hansens 1993-2008 OHC estimate of radiative imbalance. Willis's data is shown in two of the Figures and 5 of Willis' papers are cited. I hope you're not suggesting that since Hansen doesn't mention Willis by name (much), Willis's contribution is being downplayed. That's just silly, and seems a trifle obsessive! After all Willis contributed to the analysis of the Lyman et al data (as you can see by reading the author conttribution in the paper in Nature). So Willis clearly endorses that data. You should realize that in papers a scientists work is pretty much always discussed without mentioning the author by name (other than perhaps "Blogs et al determined that"...or "this is consistent with recent independent analyses (e.g. Blogs et al (2007)). I have to admit to doing a partly vanity inspection of the Web of Science update that appears on a Saturday morning to see who might have cited my own work - this morning a paper in a very similar research are to mine cited 6 of my papers. My name wasn't mention once in the text. Why should it have been? I'm not going to plough through your points since they really seem an attempt to over-fixate on uncertainties within sub-levels of the thermodynamic analysis of Earth's energy budget. A fascinating and important subject - when/if the uncertainties are resolved we'll have a much better handle on the Earth response to enhanced greenhouse gas levels, both in terms of nett equilibrium response and time evolution. For now, I'm comfortable with the evidence from Willis's analysis that the 1993-2008 ocean heat uptake is consistent with a radiative of around 0.65 W/m2. A tumble of recent papers on deep ocean heat uptake that I believe was not considered in the Lyman et al analysis (you'll tell me if I'm wrong I hope) suggest perhaps another 0.1 W/m2 "worth" has gone there. There's clearly been a bit of a slow-down in heat uptake in the last few years. Hansen's paper that you are enjoying suggests the radiative imbalance is around 0.75 W/m2 averaged over the solar cycle for this period. That also seems to be a supportable analysis. Note that Hansen hasn’t referred to any more recent work by Willis since Willis hasn’t published this (not in print yet or even in press apparently). Dr. Willis was rather “burned” by an earlier episode arising from artifacts in ARGO data. I expect when he’s confident in any new publishable data he’ll publish this and no doubt Dr. Hansen will subsequently cite it and then everyone will be happy! Note, btw that Dr. Willis is very clear that he considers that full understanding of the Earth energy budget will require further information on deep ocean heat content. He says so here. I don’t think anyone would disagree with that. No?
    0 0
  42. chris #91 I am aware of the story of how Willis 'discovered' his error with early Argo analysis. Well the reason I find Hansen's emphasis on von Schukmann interesting is that the earlier VS result of 0.77W/sq.m (0-2000m) from late 2009 was heavily criticised on this blog (BP had a big go at the bumps in the chart and the uniform error bars), and the impossible rates of heat transfer. Dr Trenberth later started quoting it on Dr Pielke's website. "For now, I'm comfortable with the evidence from Willis's analysis that the 1993-2008 ocean heat uptake is consistent with a radiative of around 0.65 W/m2." I am not comfortable with that at all as it splices XBT with Argo and produces the step jump of 2001-03 which we have argued extensively elsewhere. Recently there was heavy action on this blog re; the Knox & Douglass paper which called the VS result an 'outlier' here: http://www.pas.rochester.edu/~douglass/papers/KD_InPress_final.pdf The K&D paper uses Willis Argo data from 2009 from private correspondence with Willis. It found no 0-700m warming 2003-08 - in fact cooling. I agree that Willis should be publishing rather than others using his data from private correspondence to produce papers. Maybe he is worried about getting burned again. It he came to the same conclusion as K & D and as quoted by Dr Pielke, then it would contradict von Schukmann in no small way. BTW the Purkey & Johnson deep ocean 0.1W/sq.m was added into Dr Pielke's number of about 0.26W/sq.m globally.
    0 0
  43. Ken @92, "I am not comfortable with that at all as it splices XBT with Argo and produces the step jump of 2001-03 which we have argued extensively elsewhere." Please check your ego at the door. Do you really believe that the scientists practicing in this field give a hoot what you or BP are "not comfortable with" or what you might think? There is a term for that. Some great minds are seriously looking at these relatively new data, it is complex. Now with that said, if you or BP honestly think that you are on to something, then please do submit a paper to a journal. I am quite serious. Because this persistent/perpetual nitpicking, talking-through your hats, and claiming that the AGW theory is in trouble by looking at < 10 years of OHC data (which happens to include a prolonged solar minimum) in the upper levels of the oceans and pontificating from the sidelines is getting incredibly annoying and is not at all constructive. But being perhaps to be constructive is not your goal/objective, but obfuscating is and exaggerating uncertainty is. I highly recommend that you read a recent post by Chris here. And please remind me what this has to do with Lindzen claiming that the observed warming is because of internal climate variability?
    0 0
  44. 93, Albatross, Amen.
    0 0
  45. Albatross #93 and Sphaerica #94 Why don't you leave Chris to respond to my arguments? He is more than capable and civil in demeanour. A great mind I do not have - a reasonably experienced and servicable one perhaps. There are a few great minds who don't subscribe to the AGW theory - Freeman Dyson for one. Sphaerica - we could move to the Flanner thread for more instruction on elementary planetary geometry if you like.
    0 0
  46. Ken @95, "There are a few great minds who don't subscribe to the AGW theory." A moot point, but wrong anyhow. Dyson does accept the theory of AGW: "One of the main causes of warming is the increase of carbon dioxide in the atmosphere resulting from our burning of fossil fuels such as oil and coal and natural gas." [Source] Also, there are probably some great physicists you do not believe the Americans landed men on the moon. And thanks, but I and other scientists do not 'subscribe' to the theory of AGW. You see Ken, your innuendo and rhetoric and attempts at using pejorative text belie your intentions and undermine your credibility. And you avoided answering my question @93. So when can we expect the manuscript by you and BP available online? And no, I am not being facetious.
    0 0
  47. Ken Lambert at 23:41 PM on 15 May, 2011 “Recently there was heavy action on this blog re: the Knox & Douglass paper which called the VS result an 'outlier' here: Jeesh KL, that’s pretty desperate – can’t you summon up just a teeny bit of skepticism? The only reason Knox and Douglass (K/D) found the “VS result an “outlier”, is that they compared it with (a) a truly dismal “analysis” by Loehle in a non-science magazine that used Willis ARGO data that was known to be compromised by artefacts, and (b) an opinion piece by Pielke in a house magazine that used what looks like a very similar data set. And why didn’t K/D cite Willis’s data in Lyman 2010? The VS result wouldn’t have been an outlier anymore. If K/D had sent their paper to a proper journal it would have been soundly rejected for that nonsense. However Int. J. Geophysics isn’t really a proper journal (there is some discussion about whether “Scientific Research” publishing is a scam or merely a truly low grade vanity publishing enterprise). K/D’s paper was received, “peer-reviewed”, revised and accepted in the space of around 10 days. Doesn’t that tickle your sceptical buds just a little? Unfortunately, Emeritus Profs Knox and Douglass get it repeatedly wrong (not surprisingly since they researched respectively in physics aspects of photosynthesis and superconduction until their normal retirement age before embarking on late second careers in climate change). Knox and Douglass have previously butchered an analysis of climate forcing effects of Mt. Pinatubo eruption, an analysis of geothermal contributions to Iceland surface temperatures, and an analysis of comparison of model and empirical tropical tropospheric temperature data (AGU site down this evening so can’t link to the respective messes). Unfortunately, they don’t seem to be very good at climate science. Or maybe that's the point. Apart from that, there is a problem with your unskeptical embracing of Douglas and Knox. During the last decade (2000 through 2010), the sea level rise has continued relentlessly (with some wiggles) at a rate of 3.1 mm.yr-1. This has happened during a period of slightly downward drifting solar output since the mid-late 1980’s, the transition of the sun from the maximum to minimum in the solar cycle, and an anomalously protracted solar minimum. There is some good evidence that the mass component of sea level rise has increased somewhat in proportion to the thermal component during part of this period. But all analyses of the latter indicate that thermal component of sea level rise has continued to be positive. Why hasn't Willis published on very recent ARGO 700 m data? I expect because he recognises that there are still some problems and there's not much point in publishing on the ARGO data per se until these are better resolved. As Willis has stated recently (Willis et al 2009): "Nevertheless, some discrepancy remains in the globally averaged sea level budget, and observations of the rate of ocean mass increase and upper-ocean warming are still too small to fully account for recent rates of sea level rise (Willis et al. 2008). Temperature changes in the deep ocean (e.g., Johnson et al. 2007) may account for some of that discrepancy, at least over multidecadal time scales (Domingues et al. 2008)." So there are some significant uncertainties in these data. We know surface temperatures and sea levels are continuing to rise despite the solar downturn. At some point the uncertainties will likely resolve. I'm comfortable with waiting til we know what's going on a bit better. You prefer to place your bets on the some atrocious scholarship that supports a non-scientific approach to uncertainty. I hope that's fair. Not sure there's much point in continuing debating this since (a) we're really reliant on the science to inform us, and we can't easily be properly informed if the discrete elements of science dn't yet exist to answer the specific question...and (b) you seem to have fixed on a point of view that has some raher non-scientific inputs. So we're simply not going to agree ...yes?
    0 0
  48. Albatross #96 Perhaps a quote from Dyson might clarify his position: "When I listen to the public debates about climate change, I am impressed by the enormous gaps in our knowledge, the sparseness of our observations and the superficiality of our theories. Many of the basic processes of planetary ecology are poorly understood. They must be better understood before we can reach an accurate diagnosis of the present condition of our planet. When we are trying to take care of a planet, just as when we are taking care of a human patient, diseases must be diagnosed before they can be cured. We need to observe and measure what is going on in the biosphere, rather than relying on computer models." Hear hear!
    0 0
  49. Ken, perhaps some quotations which actually states his position on the issue, rather than a side concern: "One of the main causes of warming is the increase of carbon dioxide in the atmosphere resulting from our burning of fossil fuels such as oil and coal and natural gas." "I begin this review with a prologue, describing the measurements that transformed global warming from a vague theoretical speculation into a precise observational science." Your claim that Dyson does not agree with AGW theory is false. Your quotation of his concerns about climate models does not change that.
    0 0
  50. Here's another quote that Ken Lambert can cheer and agree with : "If you want to tell (students) there are not weaknesses to evolution and it's as sure as the Earth going around the sun, it's not," he said. "You've got to be honest. You ask why I'm so passionate about this? I don't want America to lose its scientific soul. I feel I am the defender of science." It's a dentist giving his views on Evolution but it has the same relationship and worth as a Theoretical Physicist giving his views on AGW, as Dyson himself might admit : I don’t claim to be an expert. I never did. I simply find that a lot of these claims that experts are making are absurd. Not that I know better, but I know a few things. My objections to the global warming propaganda are not so much over the technical facts, about which I do not know much, but it’s rather against the way those people behave and the kind of intolerance to criticism that a lot of them have. I think that’s what upsets me.
    0 0

Prev  1  2  3  Next

You need to be logged in to post a comment. Login via the left margin or if you're new, register here.


The Consensus Project Website

THE ESCALATOR

(free to republish)


© Copyright 2024 John Cook
Home | Translations | About Us | Privacy | Contact Us