Climate Science Glossary

Term Lookup

Enter a term in the search box to find its definition.

Settings

Use the controls in the far right panel to increase or decrease the number of terms automatically displayed (or to completely turn that feature off).

Term Lookup

Settings


All IPCC definitions taken from Climate Change 2007: The Physical Science Basis. Working Group I Contribution to the Fourth Assessment Report of the Intergovernmental Panel on Climate Change, Annex I, Glossary, pp. 941-954. Cambridge University Press.

Home Arguments Software Resources Comments The Consensus Project Translations About Support

Twitter Facebook YouTube Mastodon MeWe

RSS Posts RSS Comments Email Subscribe


Climate's changed before
It's the sun
It's not bad
There is no consensus
It's cooling
Models are unreliable
Temp record is unreliable
Animals and plants can adapt
It hasn't warmed since 1998
Antarctica is gaining ice
View All Arguments...


Username
Password
New? Register here
Forgot your password?

Latest Posts

Archives

The Physical Chemistry of Carbon Dioxide Absorption

Posted on 23 December 2010 by hfranzen

Guest post by Hugo Franzen

Perhaps because I have been a Physical Chemist for more years than I care to mention, I have the idea that Physical Chemists have something important to contribute to just about any discussion about physical phenomena.  I hope that I can convince you that this is in fact true in the case of global climate change. One reason I feel it important to be a spokesman for Physical Chemistry in this arena is because, for the most part, we P. Chemists feel it important to develop math based arguments that catch the essence of what is occurring. Of course we then leave the hard part of dealing with the ramifications to someone else.  What I mean by this in the current discussion is that the problem of global warming can be broken down into two parts – the “forcing” part that deals with the difference between the energy input and output at the earth’s surface and the consequences of that forcing. The latter is the huge problem of the feedbacks and their consequences on the distribution of that energy over the globe.

The second part is the tough, ongoing job of the Climatological community while the first part is basically P. Chem. (even though it was in many cases done by folks in other disciplines). In this essay it is my purpose to discuss the easier, forcing part.  When it comes to communication, the considerations in this realm have a distinct advantage in that the results follow directly from the solution of an elementary differential equation using specroscopic data that have been known since the 1960's.  I have benefited greatly from others in coming to an understanding of the P. Chem. of Global Warming (GW). I feel myself qualified, on the basis of what I have learned,  to say, from the point of view of Physical Chemistry, i.e. rigorous science of the if A then B type, that global warming as the result of carbon dioxide in the atmosphere is totally undeniable and that the extent of the forcing is beyond doubt close to what the climatologists are saying it is. These conclusions are not based on the earth’s temperature history or upon complex computer programs (which I certainly believe to be of great importance – it’s just that they are difficult to communicate about) but upon the type of calculation that is done in P. Chem. courses around the world.  The calculation on which this essay is based can be found in the presentation (GWPPT6) linked at the bottom of this post.

Interactions between molecules and electromagnetic radiation have been an important part of Physical Chemistry since its inception.  The first scientist to attempt a calculation of the GW (a term he introduced) was Svante Arrhenius, the great Swedish Physical  Chemist. He did his climate change work in the mid 1890’s. The understanding of the interactions of molecules with radiation progressed enormously with the advent of Quantum Mechanics, and can easily be called a very mature science at this time.  The science involves, among many other things, the observation and interpretation of spectra. 

Carbon dioxide is a molecule that has been extensively studied in this way and there is available today an incredible depth of knowledge about the interaction of carbon dioxide with electromagnetic radiation. Among a number of interactions about which a great deal is known there are those involved in taking a carbon dioxide molecule (basically linear oxygen to carbon to oxygen) from its ground bending vibrational state to its first excited bending vibrational state. However in both the initial and the final vibrational states the molecule can be in any one of a very large number of rotational states which are separated by energies very much smaller than the energy difference between the vibrational states. Thus there are many transitions between the various rotational states associated with the ground and first excited vibrational states. Transitions between many pairs of these states can be brought about by absorption of infrared radiation of the correct wave length for each pair, and thus such radiation is absorbed over a range of energies (Fig. 1)

These transitions were studied by both theory[i] and experiment[ii]  in the 1960’s and the results are highly relevant to global warming, for they provide experimental and calculated data for the linear transmittance of carbon dioxide gas in the infrared region. Transmittance is the fraction of the intensity of a beam that makes it through an absorbing sample. Absorbance is one minus transmittance. Although the data of  Fig.1 are for a particular product of path length and carbon dioxide concentration, i.e. a given NL/V, where N/V is the concentration and L is the path length, it should be mentioned that Stull et. al. calculated results for a wide variety of NL/V values and wave lengths. The fit obtained between the calculated and observed spectra for one of the NL/V values (Fig. 1) provides assurance that the absorption coefficients, i.e. the proportionality constants relating the logarithms of the transmittance at the various absorbing wave lengths to the concentration of carbon dioxide in the gas phase,  form a reliable basis for calculating the transmittance (or absorbance since they sum to 1) of carbon dioxide in the atmosphere.

The absorption coefficients reported by Stull, et. al. are linear absorption coefficients appropriate to the absorption that results in a decrease in intensity  when the radiation is traveling in a single straight line. But the radiation, when the source is the earth, travels in all directions away from the earth. When the radiation is in a single direction, the relevant transmittance is the linear transmittance and the absorption coefficients for linear transmittances  were reported by Stull, et. al. The transmittances required when the source is the earth are called the diffuse transmittances and these are calculated by integrating (summing) the intensity equation over all the angles. What results is a diffuse transmittance equation for flux rather than the corresponding equation  for decrease in intensity.  But this is just what we want to determine the energy audit for the earth, because the flux is the rate at which energy is radiated through a unit area of a surface. 

The first task in applying Physical Chemistry to the Global Warming problem is probably to determine the flux of radiation at the earth’s surface.  Fortunately in 1900, in his celebrated determination that radiation is quantized, Max Planck solved this problem for equilibrium radiation.  It turns out that at equilibrium all matter emits radiation the distribution of which is determined only by its temperature.  This distribution, which describes the rate at which energy is emitted at a given wavelength, is given by the Planck equation.  But is the earth’s surface at thermal equilibrium?  The answer to a very good approximation is yes, provided you restrict your attention to a small enough area and a short enough time.  This can be seen immediately when you realize that to say that something is “at thermal equilibrium” means that it has a temperature  and vice versa.  So the very fact that we can report a temperature for a given place at a given day, and we routinely do that at any place on any day, means that the earth at that time and place is close enough to being in thermal equilibrium that we are justified in talking about its temperature. It then follows that the Planck distribution is a very good approximation to the distribution of the infrared energy radiated by the earth at that place and time. 

There remains the problem that the earth then has many different temperatures. In the Earth Sciences it is common practice to use average temperatures as though they were ‘the temperature”.  What we believe, and it has been borne out by many studies, is that in general we can do two different things: we can make a number of measurements, reach conclusions based upon those measurements and then average the conclusions, or we can average the measurements and reach conclusions based upon that average measurement.  For example we could measure the temperatures at a very large number of places on the earth and 1. Use Planck’s law to calculate the energy radiated at each point and then average or, 2. Average the temperature and use that temperature with Planck’s law to calculate the radiated energy.  What has been found is that the final results are essentially the same.  In fact temperatures have been measured at a wide range of spots over the earth’s surface and Physicists have looked at the earth’s radiation using satellites. The observed distribution of radiant energy is nicely given by Planck’s Law and the earth’s average temperature. The earth’s spatially averaged temperature, when averaged over a year, comes out to be 288K. The balance: energy in = energy out  for the earth for a year  results because  if the energy in from the sun (corrected for albedo)  during a year were greater than the energy radiating  out from the earth then the earth’s average temperature would rise and, according to Planck’s  Law, the earth would radiate more energy and reestablish the balance.  A similar argument holds for antithesis.

So we know the quantity and distribution of the average energy emitted from the earth’s surface from measurement, spectral observation and Planck’s Law.  We also know, this time from the data of Stull. et. al. and generalization to the diffuse case, the diffuse transmittances of carbon dioxide for wave length intervals in the energy range of the earth’s Planck radiation.  In order to get a “broadband” transmittance, i.e. the transmittance for the energy range over which the carbon dioxide absorbs, the diffuse absorbance for each wave length interval is multiplied by the fraction of the Planck radiation that is emitted in that interval and the product is summed to yield the Planck averaged, broad-band, diffuse transmittances (PABBDT’s) at the various NL/V values for which the linear transmittances were reported by Stull, et. al. These were fit to a curve (PABBDT vs. NL/V) in order to find the dependence of PABBDT  for  carbon dioxide on NL/V  from which we can find the PABBDT of the atmosphere if we know NL/V  for the atmosphere.

Thus the one piece of information that is lacking at this point is NL/V  of carbon dioxide in the atmosphere.  As I am sure everyone reading this essay knows, in 1958, a scientist, Charles David Keeling at the Mauna Loa observatory, initiated a program of measurement of carbon dioxide in the earth’s atmosphere and it has been in operation ever since.  The current concentration is somewhere between 385 and 390 ppm. This concentration has been shown to be essentially the same everywhere in the atmosphere. Hence we know, in each case to a very good approximation, the average flux of infrared radiation emitted by the earth as a function of wave length,  the PABBDT of carbon dioxide as a function of NL/V and  NL/V for the atmosphere.

Therefore we can determine the amount of energy absorbed and reemitted by carbon dioxide in the atmosphere. Because one half of the reemitted radiation comes back to the earth (is the carbon dioxide greenhouse gas flux), this flux is equal to one half the Planck flux in the absorbing interval multiplied by one minus the diffuse, broadband transmittance. Knowing the earth’s average temperature at some initial time and the expected increase in atmospheric carbon dioxide (the Keeling curve) we can calculate the earth’s average temperature difference for these two times as follows. The energy leaving at the final time equals the energy entering at that time (for the reason discussed previously) and, because we know by how much that energy is increased by the carbon dioxide greenhouse effect, we know by how much the earth’s temperature is increased by that effect. When the calculation is done, as in GWPPT6, the conclusion is that the earth’s temperature is currently rising by 0.014 degrees per year because of the greenhouse gas effect of the additional carbon dioxide entering the earth’s atmosphere

In this essay I have restricted myself to words.  What I concluded above was accomplished by the solution of equations, and these equations and their solutions are presented in my website. As I see it there are four possibilities 1. Someone could understand the methodology of GWPPT6 on hfranzen.org and agree with the conclusions, or, 2 they might understand and  not agree, or, 3 it could be that they do not understand but agree for other reasons,or, 4. they might not understand and  not agree.  The folks in category 1 need to get the message out.  I hope that those in category 2 will contact me with their criticisms. Those in category 3 deserve credit for sound intuitive thinking. Those in the last category are most troublesome.  In my view they should either do the hard work of learning the basic science needed for understanding or find someone they trust who understands it to interpret the power point for them.  The people of the world need to move on to some very serious changes in our consumption of fossil fuels and there is absolutely no place for obstruction by people who do not understand the nature of the problem.


[i] Stull,Wyatt, and Plass, Applied Optics, V.3,No.2, p.250 (1964)

[ii] Burch, Gryvnak, and Williams, Applied Optics, V.9, p750 (1962)

0 0

Printable Version  |  Link to this page

Comments

Prev  1  2  3  Next

Comments 51 to 100 out of 118:

  1. RW1 - As has been said here, repeatedly, the 3.7 TOA number means that ~7.4 W/m^2 is being absorbed and radiated isotropically from CO2. I know this - because I'm one of the people who has told you this more than once. Halving that number again is completely incorrect. Until you recognize that you will be starting from some very inaccurate premises. The additional energy not radiated to space from the Earth / atmosphere from a doubling of CO2 is therefore 3.7 W/m^2. That number comes from detailed, line-by-line calculations of IR emission across the full spectrum and through the entire atmosphere. hfranzen has done an excellent job of presenting the basic ideas.
    0 0
  2. KR, "As has been said here, repeatedly, the 3.7 TOA number means that ~7.4 W/m^2 is being absorbed and radiated isotropically from CO2." Wonderful. Point me to source and/or documentation that says the total absorbed power is 7.4 W/m^2 and that only 3.7 W/m^2 affects the surface because only half of the 7.4 W/m^2 absorbed is re-radiated downward.
    0 0
  3. RW1 - The most up to date calculations appear to be from Myhre et al (1998); these results are discussed a bit over at Real Climate - The CO2 problem in 6 easy steps. RC has some excellent references and links in that article. The total radiative forcing, the difference in energy leaving the atmosphere, per doubling of CO2 is about 3.7 W/m^2. Note that this is based on piece-by-piece integrations of atmospheric effects (it's more than a bit too complex to calculate by hand), and includes both CO2 absorption widening as well as the increasing altitude of final CO2 emission (where the atmosphere thins enough that the CO2/volume allows radiation to space); given the lapse rate, a rise in CO2 emission altitude means that the emitting CO2 will be colder, and hence emit less energy. If you disagree with these numbers, then do the work, and submit your results to Geophysical Research Letters as a reply to Myhre.
    0 0
  4. RW1 - The link I gave you was behind a paywall; here's an accessible link to Myhre et al 1998. Long live Google Scholar!
    0 0
  5. I've added Myhre et al 1998 to the Links section under "CO2 is weak", "CO2 is saturated", and "CO2 is just a trace gas". That's a very important paper for baseline CO2 forcing calculations, and includes simplified formulas for CH4, H2O, and other greenhouse gases.
    0 0
  6. KR, There is nothing in any of the sources you cite that answers the question.
    0 0
  7. RW1 - Looking through Myhre, I see that the total radiative change is really both the effects I mentioned here; band widening and the rise in effective emission of IR to higher (colder) altitudes. So some additional absorption, some less effective emission. The simplified formula Myhre comes up with for CO2 is: ΔF (W/m^2) = α * ln( C/C[initial] ); α = 5.35 For a doubling of CO2 from preindustrial 280 to 560, α * ln(2) = 3.708 W/m^2. Again, coming up with this equation is not a back-of-the-envelope calculation; I can't give you that, because it wouldn't be accurate.
    0 0
  8. Response to #49. With regard to the water vapor absorption, I am not trying to calculate the total effect - just that of the CO2. Therefore the only circumstance in which the result would be in error is when many water vapor absorption lines and CO2 absorption lines overlap. The slide in GWPPT6 that shows a detailed spectrum from Ohio State University with numerous single lines that do not overlap. The detailed calculations take account of any overlaps. So you might well ask, "why bother with GWPPT6?". First of all because the results of GWPPT6 agree with observation (see #25 above). Second of all because they also agree with the detailed calculations, and finally because the GWPPT6 calculation is readily accessible to anyone with a background in P. Chem and it shows the essence of what is occurring. In particular the often cited idea that comes from applying the linear Beer's Law for intensity, namely that more CO2 will not result in more GHG effect, is demolished. I have presented the details of a simple calculation that takes account of the absorption of radiation by CO2 and the geometry of the effect. The result agrees with observation and detaled calculation. You say, "you can't make these assumptions". You don't say to what assumtions you refer. I would say my only assumption is the the overlap of water vapor and CO2 lines is not sufficient to throw the calculation off. My basis for this assumption starts with the basic quantum mechanical result that the spectra are line spectra. If they had zero width overlap would be essentially impossible. If they have width it arises from life-time and/or pressure broadening effects. What about the assuption that you are making that these broadening effects are sufficient to cast doubt on the result of GWPPT6 (or I should say, "to cast doubt on the appilicability of the result to a system containg water vapor")? If you think the assumption that the result has applicability to the earth system is wrong show your reasoning quantitively, i.e. show some data or calculated effects that demonstrate that water vapor absorption interferes with that of CO2 substantially. That would be a great contribution! Because the calculation of GWPPT6 is for an earth-year average the issue of clouds is irrelevant to the calculation. I.e. a known average flux of energy is entering the aarth's surface. The earth's average surface temperature increases until the average flux radiated at the top of the atmosphere equals the average flux entering On the way out the flux has to interact with the CO2 in the atmosphere because the wave lengths are at the excitation for the rotational-vibrational transitions of CO2. This is all necessary and occurs whether there are clouds or no clouds.
    0 0
  9. Reponse to #50: I do not undertstand why our numbers differ so greatly- I calculate that the increase in temperature over 100 years for the Keeling curve ppm is 1.4 K and that this corresponds to an increased GHG effect of 7.4 w/sq.m. (this comes from taking the ratio of the fluxes to be the fourth power of the ratio of the temperatures). The number I get for a doubling of ppm CO2 is an increase of 9.5 W/sq. m. That is, using the 100 years hence number: (1+1.4/288) is 1.0049 and the fourth power of this is 1.02 i.e. the outgoing Planck flux when the temperature increases from 288 to 289.4 will increase by 2%.The current outgoing flux is 390 w/sq.m. and 2% of 390 is 7.4 w/sq.m. Do you see anything wrong with this? Why do our numbers differ so greatly?
    0 0
  10. It's a simple question. How much total additional surface power is absorbed from a doubling of CO2?
    0 0
  11. The Ohio State university slide is black and white, so I cannot determine from it any overlap. H20 absorbs to some degree throughout the entire spectrum of the Planck distribution, and has very strong absorption in the main CO2 absorbing bands around 15u.
    0 0
  12. RW1 - the calcuations of radiative forcings at TOA (actually at tropopause if you look at precise definition in TAR) is so that you can do simple arithmetic on forcings like GHG, land use change, aerosols, solar etc to determine net forcing. So a 3.7W/m2 of forcing is calculated so it is equivalent to say 3.7W/m2 of solar forcing. To convert roughly to surface energy, then I believe you simply make geometric conversion for surface area of earth surface cf surface area of sphere at tropopause. (ie it will larger than 3.7 at surface).
    0 0
  13. #60 I don't understand - I gave a simple answer namely 9.5 W/sq.m. I also describe, using the 100 year ppm increase as an example, where I get this answer and ask, basically, if you can see some reason why is so different from the numbers you give. What more can do?
    0 0
  14. #61: As regards the Ohio state spectrum, the point is that there are, in the vicinity of the bending transition, a host of single spikes that have the earmarks of single transitions standing alone. It seems quite clear to me that the CO2 absorptions are not buried in a sea of water vapor transitions. Maybe there is some overlap, but even then the CO2 would contribute to the absorption. If the overlap is a serious problem it is a mystery to me how there could be agreement between what GWPPT6 calculates and what is observed, as there is. I most confess I don't see where you are trying to go. If it is your wish to cast doubt on the conclusion that the GHG effect of CO2 is the major cause of the observed increases in the earth's temperature you are barking up the wrong tree. That is proven by the detailed computer calculations of the climate scientists. If it is your wish to show for some reason that the GWPPT6 calculaton is without merit you will have to point to something more fundamental than the assumption that water vapor-CO2 overlap is not significant becuse the whole point of GWPPT6 is to show the essential features of diffuse broad-band absorption, and to undermiine that requires a definitive statement such as, "the use of this equation is wrong because" or "these data do not apply" or some such. I have worked as a scintiist for over fity years and it is clear to me that when it comes to appying them to processes all scientific calculations are approximations. For example, we leave out perturbations by masses other than the earth for terrestrial trajectory calculations. Someone wishing to cast doubt upon a calculation could always say, "you can't make that approximation" and, if one were foolish enough, they could go on forever including smaller and smaller perturbations (the sun, the moon, Mars, Jupiter, and on and on). It is my belief that when someone produces a calculation the gives a result that is botn observed and confirmed by a more inclusive theory and someone else wishes to doubt the result it is up to the doubter to produce evidence why the calculation should be challenged. That is what I am asking you to do. And if you can successfully do it I will withdraw totally. That is how science works (at least so I hope). So I sincerely offer you best wishes in your search for a definitive argument. But please do not believe that all you have to do is say, without a number to back you up, that someone cannot make approximations. Without approximations science would be useless.
    0 0
    Moderator Response: [muoncounter] Word to the wise: This 'casting doubt' has happened before.
  15. KR, Here are the results from 5 atmospheric simulations runs. Four atmospheric zones are considered where the vertical profile is interpolated between the zone means and integrated from the surface to 50km. GHG's, except H2O and O3, are considered uniformly mixed, while H2O and O3 follow a profile with a specific average concentration per zone. The zones are defined as follows: Zone range Frac Pressure Temp @nominal surface temp 0: 0km to 3km, 30.54%, 0.84328, 278.855K (42.27F) 1: 3km to 6km, 52.65%, 0.58097, 256.050K ( 1.22F) 2: 6km to 15km, 88.11%, 0.28280, 226.323K (-52.29F) 3: 15km to 50km, 99.93%, 0.04252, 243.075K (-22.13F) When 2 or more gases are absorbing the same wavelength, both are counted, but the total is accounted for as being contributed by only one gas. The gas selected will be the one absorbing the largest fraction of the total. Absorbed power is relative to the emitted surface spectrum at it's average temperature. The first result is the average clear sky absorption with nominal GHG concentrations. The clear sky absorption is 56.6%, while the average cloudy sky absorption is about 85.7%. For 66.6% clouds and 33.3% clear, the total absorption is .566*.333 + .857*.666 = 0.760, for a net 76% absorption and an average transparent window of about 24% and yes, I rounded this up to 24.1% in my energy budget calculations. The second is at 280 ppm CO2 with all else set to nominal. The third is at 560 ppm CO2 with all else set to nominal. The delta absorption from the second case is 3.6 W/m^2, and while CO2 increases by more than this, the water vapor component decreases. The fourth is CO2 at 280 ppm and everything else set to zero. The last is CO2 at 560 ppm and everything else set to zero. Here, the delta is 4.79 W/m^2. With the water vapor missing and not otherwise absorbing in overlapping bands, the effect of CO2 by itself will be larger. 1) *************************************************************************************** model type = 'Monthly T', res=0.100 nm @ 1u, 23026 samp/decade, Ascale=1 Water Content: 1000:1300:144:1 ppm, Cloud Coverage: NOM, Surface Ice: NOM Absorption: CO2: 383 ppm, CH4: 1745 ppb, O3: 30:80:150:300 ppb, N2O: 300 ppb, CO: 100 ppb absorption component breakdown: H20 = 116.7797 W/m^2, fraction = 0.354451 CO2 = 57.5560 W/m^2, fraction = 0.174695 O3 = 5.2293 W/m^2, fraction = 0.0158721 CH4 = 3.5440 W/m^2, fraction = 0.0107568 N2O = 3.3771 W/m^2, fraction = 0.0102503 CO = 0.0558 W/m^2, fraction = 0.000169222 O2 = 0.0053 W/m^2, fraction = 1.62356e-05 total = 186.5472 W/m^2, fraction = 0.56621 force = 93.2736 W/m^2, fraction = 0.283105 50% up, 50% down 2) *************************************************************************************** model type = 'Monthly T', res=0.100 nm @ 1u, 23026 samp/decade, Ascale=1 Water Content: 1000:1300:144:1 ppm, Cloud Coverage: NOM, Surface Ice: NOM Absorption: CO2: 280 ppm, CH4: 1745 ppb, O3: 30:80:150:300 ppb, N2O: 300 ppb, CO: 100 ppb absorption component breakdown: H20 = 117.0733 W/m^2, fraction = 0.355343 CO2 = 55.5709 W/m^2, fraction = 0.168669 O3 = 5.2355 W/m^2, fraction = 0.0158908 CH4 = 3.5426 W/m^2, fraction = 0.0107524 N2O = 3.4168 W/m^2, fraction = 0.0103707 CO = 0.0551 W/m^2, fraction = 0.000167238 O2 = 0.0053 W/m^2, fraction = 1.62356e-05 total = 184.8995 W/m^2, fraction = 0.561209 force = 92.4498 W/m^2, fraction = 0.280605 50% up, 50% down 3) *************************************************************************************** model type = 'Monthly T', res=0.100 nm @ 1u, 23026 samp/decade, Ascale=1 Water Content: 1000:1300:144:1 ppm, Cloud Coverage: NOM, Surface Ice: NOM Absorption: CO2: 560 ppm, CH4: 1745 ppb, O3: 30:80:150:300 ppb, N2O: 300 ppb, CO: 100 ppb absorption component breakdown: H20 = 116.4037 W/m^2, fraction = 0.35331 CO2 = 59.9992 W/m^2, fraction = 0.18211 O3 = 5.2580 W/m^2, fraction = 0.0159591 CH4 = 3.5451 W/m^2, fraction = 0.0107602 N2O = 3.2633 W/m^2, fraction = 0.00990468 CO = 0.0543 W/m^2, fraction = 0.000164875 O2 = 0.0053 W/m^2, fraction = 1.62356e-05 total = 188.5290 W/m^2, fraction = 0.572226 force = 94.2645 W/m^2, fraction = 0.286113 50% up, 50% down 4) *************************************************************************************** model type = 'Monthly T', res=0.100 nm @ 1u, 23026 samp/decade, Ascale=1 Water Content: 0:0:0:0 ppm, Cloud Coverage: NOM, Surface Ice: NOM Absorption: CO2: 280 ppm, CH4: 0 ppb, O3: 0:0:0:0 ppb, N2O: 0 ppb, CO: 0 ppb absorption component breakdown: H20 = 0.0000 W/m^2, fraction = 0 CO2 = 57.9766 W/m^2, fraction = 0.175971 O3 = 0.0000 W/m^2, fraction = 0 CH4 = 0.0000 W/m^2, fraction = 0 N2O = 0.0000 W/m^2, fraction = 0 CO = 0.0000 W/m^2, fraction = 0 O2 = 0.3406 W/m^2, fraction = 0.00103377 total = 58.3172 W/m^2, fraction = 0.177005 force = 29.1586 W/m^2, fraction = 0.0885026 50% up, 50% down 5) *************************************************************************************** model type = 'Monthly T', res=0.100 nm @ 1u, 23026 samp/decade, Ascale=1 Water Content: 0:0:0:0 ppm, Cloud Coverage: NOM, Surface Ice: NOM Absorption: CO2: 560 ppm, CH4: 0 ppb, O3: 0:0:0:0 ppb, N2O: 0 ppb, CO: 0 ppb absorption component breakdown: H20 = 0.0000 W/m^2, fraction = 0 CO2 = 62.7645 W/m^2, fraction = 0.190504 O3 = 0.0000 W/m^2, fraction = 0 CH4 = 0.0000 W/m^2, fraction = 0 N2O = 0.0000 W/m^2, fraction = 0 CO = 0.0000 W/m^2, fraction = 0 O2 = 0.3406 W/m^2, fraction = 0.00103376 total = 63.1051 W/m^2, fraction = 0.191537 force = 31.5526 W/m^2, fraction = 0.0957687 50% up, 50% down
    0 0
  16. Response to #65. Thank you! If I am reading these numbers correctly I conclude that the absorption of IR by CO2 is almost independent of the presence of H2O and that there is, therefore, at the level of accuracy of GWPPT6, a negligible amount of line overlap of H2O and CO2 absorption lines. I hope I am reading these numbers correctly for, if I am, this means that GWPPT6 is better than I have any right to expect.
    0 0
  17. @RW1: "Point me to source and/or documentation that says the total absorbed power is 7.4 W/m^2 and that only 3.7 W/m^2 affects the surface because only half of the 7.4 W/m^2 absorbed is re-radiated downward." Please prove these numbers are inaccurate. People have been very patient with you, but now it's time to present actual evidence that supports you case. Thanks. @co2isnotevil: When in doubt, just throw a bunch of numbers around. Oops - doesn't work when actual scientists are there to double-check, it seems!
    0 0
  18. hfranzen (RE: 66), "If I am reading these numbers correctly I conclude that the absorption of IR by CO2 is almost independent of the presence of H2O and that there is, therefore, at the level of accuracy of GWPPT6, a negligible amount of line overlap of H2O and CO2 absorption lines." How do you figure? With the inclusion of H2O, the total absorbed power from 2xCO2 is nearly 3 W/m^2 less (62.7645 - 59.9992 = 2.7653 W/m^2). The total increase is about 3.6 W/m^2 (188.5290 - 184.8995 = 3.6295 W/m^2). If only half of the increase affects the surface, the net perturbation is about 1.85 W/m^2 from 2xCO2.
    0 0
  19. hfranzen, re 66 Not exactly, but close. I also misstated something. I went back and looked at the code and the amount attributed to each gas is accurate when lines overlap. What I said before represented an earlier version of the code. What this does say is that under nominal conditions, there's little overlap of saturated water vapor lines and saturated CO2 lines and that there's not a lot of overlap where the resulting sum becomes or remains saturated. If you examine the spectral response, the saturated CO2 lines around 15u overlap nominally weak water vapor lines, although when passing through clouds, these weak lines become much stronger. So while the lesser overlap is true for the nominally clear sky, the overlap for cloudy sky conditions is larger.
    0 0
  20. co2isnotevil, "So while the lesser overlap is true for the nominally clear sky, the overlap for cloudy sky conditions is larger." About how much larger for the cloudy sky?
    0 0
  21. archiesteel, Go ahead. Check this. You must have a 3-d atmospheric simulator you can use, don't you? If not, I suggest you get or build one so you can see this for yourself. BTW, make sure you understand the differences between Planck distributions in the wavelength, frequency and wavenumber domain. There are some subtleties here that I've seen many people trip over. For example, I've seen attempts to convert the emitted power per unit solid angle per unit frequency of a Planck distribution of frequency into the emitted power per unit solid angle per unit wavelength of a Planck distribution of wavelength by scaling by the speed of light. Look up Planck's Law in a wiki or somewhere to see why this won't work.
    0 0
  22. RW1, The absorption overlap is a little more than twice as much, however, additional overlap occurs as condensed water vapor in the cloud is a broad band, nearly saturated, absorber of IR energy.
    0 0
  23. @co2isnotevil: heh. I can see I struck a nerve. I'm not a climate scientist, however I know enough to see when someone is trying to obfuscate their questionable theories behind a wall of barely understandable arguments. It is clear what you and RW1 are trying to do here, i.e. keep pushing the same flimsy theory over and over again, while complaining that the peer-reviewed system prevents your "brillant" insight from getting the recognition it deserves. Good scientists can make clear arguments and don't to regurgitate walls of numbers and convoluted logic in order to make their point. There are many here who excel at communicating the science. Then, there are those who believe that they merely need to *sound* smart in order to convince others - or at least trap them into endless looping arguments where the same erroneous reasoning is endlessly recycled. Seriously, state your case clearly and concisely, or keep it to yourself. A comments section is not the place to spam the output of your prized atmospheric simulator.
    0 0
  24. @co2isnotevil: for an example of a clearly-made, compelling case, check out the link to hfranzen's website at the end of the main article.
    0 0
  25. Response to #68.Compare 3 and 4. If water vapor were interfereing seriously with CO2 absrption the removal of water vapor would have a greater effect than 2 parts in 60. I am very happy accepting a 3% error in my transmittance as I know this will translate into a much smaller error in the change in transmittance with increasing ppm and thus to a quite accurate calculation of the increase in flux
    0 0
  26. Response to #71. If your interest is in weather rather than climate the effect of clouds in the area for which the weather is considered is highly important, But for climate change calculations it is the earth-year average that matters - in fact for what we are discussing it is the change in the earth-year average that is relevant. Even if water aborptions within clouds interfere significantly with CO2 absorptions the clouds occupy only a fraction of volume in which IR interacts with CO2. What is required is a demonstration that on the earth-year average such interferences significantly effects not just the transmittance of the atmosphere but the change in that quantity. Finally, once again, it seems to me highly relevant that the earth-year average increase in GHG flux calculated in GWPPT6 matches what is observed.
    0 0
  27. Response to #65. I have yet to receive from any quarter any criticism of the generalization of Beer's Law to the case of diffuse broad-band scattering in GWPPT6, nor given, the acceptance of the physics used by the top experts in atmospheric radiation (e.g. Nuo-Nan Liou in "An Intro. to Atmospheric Physics) am I likely to. Therefore I conclude that my calculation of the GHG effect of CO2 in the absence of any possible interference from water vapor should be the same as anyone elses. I am therefore at a loss to explain why I get from the equations of GWPPT6 from CO2 at 560 ppm a GHG flux of 53.8 W/sq. m. (an absorbance of 107.6 W/sq. m.) whereas #65 reports 31.55 w/sq.m. and 63.1 w/sq. m. for the same fluxes both in the absence of water vapor. Please explain.
    0 0
  28. hfranzen, In your paper, you claim the non GHG temperature is 255K. However, without GHG,s also infers that there are no clouds and no ice. If the oceans were not water, but something else with a similar reflectivity, the non GHG albedo would be closer to 0.1 than to 0.3. This puts the no GHG surface temperature at 271K and not 255K. Clouds and ice are part of the climates control system and in addition to warming the surface, they also reduce incident power which cools the surface. The net effect of GHG's, including water, is to increase the surface temperature from 271K to 287K not from 255K to 287K. re 76 What's important about clouds is not the volume, but the area covered between the surface and space, which on average is 66%. Absorption by the atmosphere between the surface and clouds is irrelevant if the clouds would be absorbing it anyway. re 77 Where is the peak of the average surface radiated power? From Wien's displacement Law, at 287K, it should be close to 10u. If the frequency form of Plank radiation is incorrectly converted to wavelength by scaling by c, the peak of the surface radiation will be closer to the center of the 15u CO2 line. I have seen this error in other papers which makes it appear that CO2 absorbs more than it actually does.
    0 0
  29. co2isnotevil - "Non GHG temperature" is a Gedankenexperiment; sufficient to show that conditions would be different if something changed. Arguing about details of the hypothetical does nothing to invalidate the issue of changing the reality.
    0 0
  30. hfranzen (RE: 75), "Compare 3 and 4. If water vapor were interfereing seriously with CO2 absrption the removal of water vapor would have a greater effect than 2 parts in 60. I am very happy accepting a 3% error in my transmittance as I know this will translate into a much smaller error in the change in transmittance with increasing ppm and thus to a quite accurate calculation of the increase in flux" What matters is the amount of reduction in total increase of 2xCO2 as a result of H2O overlap. According to the numbers presented above in # 65, 2xCO2 is about 25% less with water vapor overlap (about 3.6 W/m^2 instead of about 4.8 W/m^2). That's pretty significant.
    0 0
  31. Response to #80. Two points: 1. What matters to me is that the calculation (for what its worth) shows that there is neglibible decrease in the absorption as a result of adding H2O. 2. On the other hand I doubt the correctness of the calculation ca;cu;ation on which you base your numbers- see my comments above, esp. the numbers in # 77. If you have a response to my query about the numbers cited I will listen. A repeat of the same numbers (as in your #80) convinces me only that you are unable to respond to my question.
    0 0
  32. Response to #78 in regard to #77. My use of the Planck distribution is spelled out in detail in GWPPT6. If you have read it you will have the answer to you question, which is not phrased in a way that can understand. Of course i think i used the law correctly - if I did not show me my error.
    0 0
  33. Response to #78. I am sorry, but I cannot understand the point of your first paragraph. It seems to me you are confusing albedo and absorption. In GWPPT6, when I introduce the idea of a 255 K earth, I clearly state in the absence of other sources of energy at the surface. Then, a slide or two later, I erroneously attribute the difference between the average temperature (288K) and 255 K to GHG's alone. I thank you for pointing it out this error. However I make no use of the difference except to say that the goal of my effort is to find the contribution that CO2 makes to the difference, so the error has no impact on the result. As to the question about the volume of the clouds - the point we were discussing has to do with the importance of the interaction between water and CO2 and it is your caim, apparently, that water vapor interferes with the CO2 absorption in the clouds. The quantity of CO2 so effected certainly would depend upon the volume of the clouds. The overall question we are discussing is, "what is the impact of water vapor upon the absorption of infrered energy by CO2?" If there were many overlapping spectral lines from the two vapor species (What is the evidence that there are? Why would one expect there to be?) then those overlapping wavelengths would be reduced in intensity by the water vapor absorptions and the CO2 would be less of an absorber than it is on the absence of the water vapor. But that is what the calculation of #65 shows to not be the case. Of course, as I stated above, I think there is something wrong with the calculation of #65 because the numbers are completely different from what is calculated in GWPPT6. I have no way of knowing what went into the calculation of #65 - on the other hand the data and equations used in GWPPT6 are there in the open for all to see. So if you think the physics of GWPPt6 is wrong in some way show me the error and I will retire in defeat.
    0 0
  34. hfranzen, Your energy balance on page 19 is relatively close to mine as discussed here. Your 302 W/m^2 of total absorption is close to my 292 W/m^2 and it is generally assumed that CO2 is about 1/3 (I calculate it as about 31%), which is why your 107.6 W/m^2 for CO2 alone may seem reasonable. However, my CO2 only absorption is for the clear sky, while the composite absorption (your 300 and my 292) is the cloud percentage weighted clear sky and cloudy sky absorption. One other point is the run I did for the earlier data was not at the average surface temperature, but the percentages are all correct, so the actual power absorbed is the percentage times your emitted surface power. Reading more of your paper, on page 24, you don't acknowledge that most of the power emitted by the atmosphere is not by greenhouse gas emissions, but is the BB radiation emitted by the rest of the atmosphere which has been warmed by GHG's. If you have any doubt that a heated gas emits BB radiation, consider that the photons from the Sun are BB radiation of the heated Hydrogen in the upper layers of it's atmosphere. Consider that we can measure the temperature of interstellar gas clouds by observing them in the IR. The picture on page 32 makes no sense. Is it CO2 absorption for Venus or something? The composite absorption of the Earth looks more like this. 
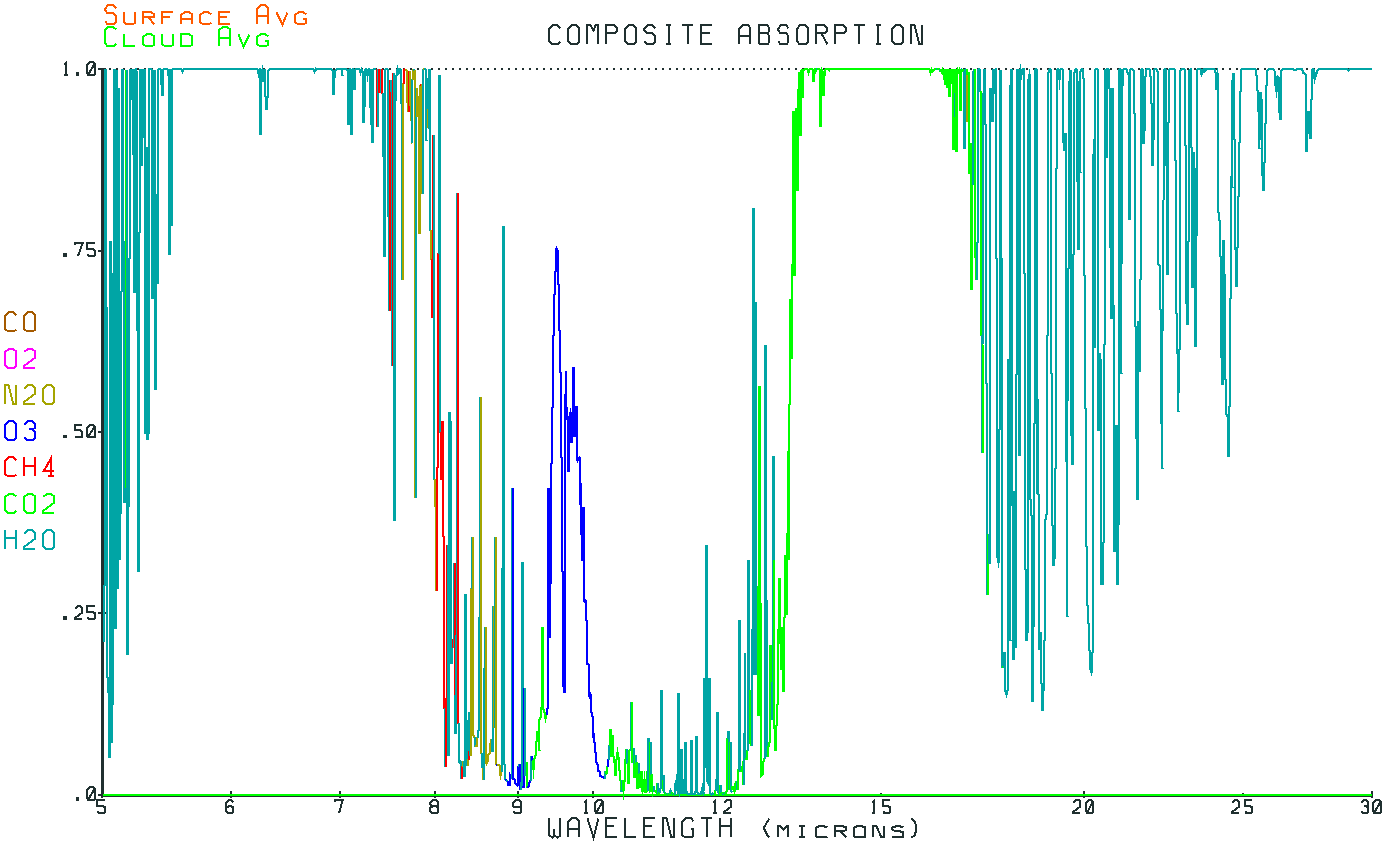
The colors indicate which gas is most responsible for each wavelength bucket. The image is shrunk a lot, so open it for a high resolution view. The wave;ength resolution I've used is a logarithmic scale of about 26K buckets per decade with calculations performed over 4 decades from .1u to 1000u which is orders of magnitude finer than the spectral resolution you are using. I've also found that large wavelength buckets are not very accurate. At this point it seems that you have 11 wavelength buckets spread between 9 and 19 microns, while my analysis covers over 100K logarithmic wavelength buckets between .1u and 1000u, moreover; my analysis with HITRAN data is far more accurate than yours using the Burch et all CO2 data. Whether or not your math is correct, which as far as I can tell looks OK, I know that the limited data you are starting from is insufficient to establish what you're trying to show.
    0 0
  35. co2isnotevil - Um, N2 and O2 do not emit in the IR; their emissivity is extremely low at surface and atmospheric temperatures, and they are essentially not factors in infrared blackbody (BB) radiation in the climate system. That's a red herring. The radiation seen at top of atmosphere is the surface radiation (BB spectra near 1.0 emissivity), clouds, and greenhouse gases. Not N2 or O2. If you disagree, please show the N2 and O2 emissive spectra in the IR. What I've seen shows no such IR emission from diatomic gases.
    0 0
  36. KR, I never said N2 or O2 absorbs or emits narrow band IR. However, O2 gas and N2 gas emit a broad band Planck spectrum of energy dependent on it's temperature. Are you trying to tell me that a gravitationally bound ball of N2 and O2 gas at some temperature T will remain at that temperature forever? Just because there's a ball of rock in the center doesn't change anything.
    0 0
  37. KR, When the spectral characteristics of the Earth's emitted power spectrum are examined from space, there are spectral gaps at all of the absorption/emission wavelengths. We can explain this as the power passing through the transparent regions of the atmosphere. Based on the atmospheric transmittance, not enough power passes through from the surface and cloud tops into space, in fact, only about 40% of the required power passes through and into space through this window. Now the question for you is if the 60% of the missing power was emitted from GHG's in the absorption bands, which are the only places in the spectrum they emit, why are there absorption gaps in the measured spectrum? You must agree that the missing power is still passing through the transparent regions, just not originating from the surface or cloud tops. Where else can it originate from but the atmosphere itself?
    0 0
  38. co2isnotevil - O2 and N2 will emit at characteristic line spectra based upon their molecular properties. They do not emit significant amounts in the thermal IR region, and hence do not factor into energy loss to space at Earth climate temperatures. Their emissivity at surface and atmospheric temps is essentially zero. In a hypothetic world without greenhouse gases the radiative energy going to space would be emitted from the surface, ground and ocean, emissivity ~90-95%, very close to a blackbody curve. Your question here is unclear to me - regarding the observed gaps in the emission spectra of the Earth, those are the GHG bands where IR is being re-radiated to the surface rather than space, and where the final emission to space (upper troposphere for H2O, stratosphere for CO2) is from much colder gases with correspondingly lower emission values than the surface.
    0 0
  39. @RW1: "The IPCC says a doubling of CO2 results in an intrinsic increase in surface power of 3.7 W/m^2. I've said before on here that if only half of the absorbed power affects the surface, the actual is only 1.85 W/m^2." You have failed to provide evidence that supports this assertion, even though you keep repeating it thread after thread. The simple fact is that the 3.7 W/m² figure is already halved. This represent the net forcing of 2xCO2. The burden of proof is on you to provide clear evidence it isn't.
    0 0
  40. @hfranzen: don't be discouraged by the onslaught of contrarians trying to cast doubt on your paper. The fact that they are so relentless in their critics (all without evidence) probably means you did a good job. I would recommend against trying to convince people like RW1 and co2isnotevil, though. I don't think *any* amount of evidence would convince them, as they have already decided they were right, and everybody else was wrong. They are not interested in a rational debate, but rather in pushing their beliefs. I guess it depends on how much time you have to waste on such fruitless pursuits...
    0 0
  41. archiesteel, "The simple fact is that the 3.7 W/m² figure is already halved. This represent the net forcing of 2xCO2. The burden of proof is on you to provide clear evidence it isn't." I've simply asked (on numerous occasions) for a source documenting that the total increase in absorbed power for 2xCO2 is actually 7.4 W/m^2, which is then halved to get a net of 3.7 W/m^2. I've looked all over and haven't found one and no one here has pointed me to one.
    0 0
  42. KR, Let's start with Trenberth's 70 W/m^2 passing through the transparent window from clouds and the surface and out into space. For an earth at 255K, it must radiate 240 W/m^2, leaving a shortfall of 170 W/m^2. We know this power must be leaving the planet, so where in the outgoing spectrum is this power and what is it's origin? I think you are confused between the narrow band emissions from an excited gas and the broadband emissions of a heated, ground state gas. If you don't think that a heated gas emits a Planck spectrum of power, why does the Sun emit a Planck spectrum of power whose temperature from Wien's law is presumed to be it's surface temperature? It's certainly well known that a high pressure gas is a BB, but what this really means is that a high pressure gas is a better BB, relative to absorbing energy. If heated by other means, for example, via GHG's, even a low pressure gas radiates a Planck spectrum, for example, gas clouds in deep space. So, when someone says that O2 or N2 is not a good black body, they mean that without help, it will not absorb radiation from the environment and thus will not emit this absorbed energy. In a strict sense, an ideal BB absorbs 100% of the incident radiation and then emits this as a Planck distribution. O2 and N2 can still emit a Planck distribution when heated by other means, even though in a strict sense, these gases are very poor black bodies.
    0 0
  43. co2isnotevil - The emissivity of O2 and N2 at Earth climate temperatures is close to zero, and is inconsequential in terms of radiative energy flow to space. You are discussing a strawman, a red herring. Radiative emissions from the atmosphere come from greenhouse gases and from clouds. Not bulk O2 or N2 - which is why they are not called 'greenhouse gases'.
    0 0
  44. KR, The earth must emit 240 W/m^2 at 255K The power from the surface, clouds and indirectly the surface beneath clouds that passes through the transparent window in the atmosphere is at least 100 W/m^2 too low. What is the origin of this extra radiation, if not the surface or the clouds? This isn't a strawman or red herring, but a question that you can't seem to answer. I've answered this question, but you don't like my answer because it implies there's something horribly wrong with your 'consensus' science. You tried to say it comes from GHG's, but this would be in the emission spectrum of those gases, which when observed from space, are dark. To help you answer the question, consider the following: The average surface temperature of 287K corresponds to 285 W/m^2. Clouds have an average temperature of about 261K, corresponding to 263 W/m^2. The clear sky atmospheric window is about 45% and the window between clouds and space is larger, at about 55% (far less water vapor). Clouds cover 2/3 of the planet. You would claim the windows are even smaller, but that only makes things worse for you. The energy passing through the transparent window is, 1/3 * 285 * 45% + 2/3 * 263 * 55% = 139 W/m^2 Where is the other 101 W/m^2 of radiative power coming from?
    0 0
    Moderator Response: [muoncounter] Much of this was worked over in excruciating detail on a prior thread. Questions specific to Hfranzen's post, which stands on its own, are the topic here.
  45. Response to #90 Good advice - I feel like I've stepped through the looking glass and am trying to discuss science with the Red Queen. I did initially feel gratified by a number of responses from some participants who were interested in learning something.
    0 0
  46. co2isnotevil - I'm going to go with the moderator on this. 450 posts, most of which repeatedly pointed to errors in your framing of the problem, is several hundred too many. Been there, done with that.
    0 0
  47. hfranzen - For my part, I wish to thank you for putting in the not-inconsiderable work on your guest post, and for presenting the information for people who do not have your physical chemistry background.
    0 0
  48. This is directly related to Hfranzen's post. He claims the same same exact thing that I do which is that half of what is absorbed by the atmosphere by GHG's is radiated out into space. Look at the GWPPT presentation he references. If this is the case, which I believe it is, the same thing applies. Why is it so hard to admit that the clear sky atmosphere radiates power into space? Look at the Trenberth paper. He claims that the atmosphere radiates 169 W/m^2. His number is so much higher because he assumes a much narrower transparent window. Examining the emission spectrum of the Earth, the emission lines of the GHG's in the atmosphere are mostly dark, so the only place in the spectrum where this power can be emitted is in the transparent window. KR can't answer this, so how about hfranzen? What is the origin of this power? He must be able to answer this to explain his own work.
    0 0
  49. Regarding my criticism of the GWPPT presentation, it was at the request of rfranzen and I spent at least an hour of my valuable time pouring through it to see what he was doing wrong. Upon review, as I said, the math seemed OK. In fact, it's virtually the same math I've used. The problem was the data going in to the analysis. Much better data is available now and will produce far superior results, just probably not the expected results.
    0 0
  50. co2isnotevil - I would recommend you read Petty 2006; there is a summary of some of the more important spectral data here in The greenhouse effect and 2nd law of thermodynamics, intermediate.
    0 0

Prev  1  2  3  Next

You need to be logged in to post a comment. Login via the left margin or if you're new, register here.


The Consensus Project Website

THE ESCALATOR

(free to republish)


© Copyright 2024 John Cook
Home | Translations | About Us | Privacy | Contact Us