Climate Science Glossary

Term Lookup

Enter a term in the search box to find its definition.

Settings

Use the controls in the far right panel to increase or decrease the number of terms automatically displayed (or to completely turn that feature off).

Term Lookup

Settings


All IPCC definitions taken from Climate Change 2007: The Physical Science Basis. Working Group I Contribution to the Fourth Assessment Report of the Intergovernmental Panel on Climate Change, Annex I, Glossary, pp. 941-954. Cambridge University Press.

Home Arguments Software Resources Comments The Consensus Project Translations About Support

Twitter Facebook YouTube Mastodon MeWe

RSS Posts RSS Comments Email Subscribe


Climate's changed before
It's the sun
It's not bad
There is no consensus
It's cooling
Models are unreliable
Temp record is unreliable
Animals and plants can adapt
It hasn't warmed since 1998
Antarctica is gaining ice
View All Arguments...


Username
Password
New? Register here
Forgot your password?

Latest Posts

Archives

Was there a Medieval Warm Period?

Posted on 28 November 2009 by John Cook

The Medieval Warm Period spanned 950 to 1250 AD and corresponded with warmer temperatures in certain regions. During this time, ice-free seas allowed the Vikings to colonize Greenland. North America experienced prolonged droughts. So just how hot was the Medieval Warm Period? Was it warmer than now? A new paper Global Signatures and Dynamical Origins of the Little Ice Age and Medieval Climate Anomaly (Mann et al 2009) (see here for press release) addresses this question, focusing on regional temperature change during the Medieval Warm Period and Little Ice Age.

Prior temperature reconstructions tend to focus on the global average (or sometimes hemisphere averages). In this study, more than 1000 tree-ring, ice core, coral, sediment and other assorted proxy records spanning both hemispheres were used to construct regional temperature change over the past 1500 years. The paper discusses many interesting topics, including some interesting consequences of prolonged La Nina conditions during the Medieval Warm Period. I'm still digesting this info and will return to it in a future post. But the central result of the paper is the regional temperature pattern during the Medieval Warm Period.


Figure 1: Reconstructed surface temperature anomaly for Medieval Warm Period (950 to 1250 A.D.). Temperature anomalies are defined relative to the 1961– 1990 reference period mean. Gray areas indicates regions where adequate temperature data are unavailable.

The Medieval Warm Period found warm conditions over a large part of the North Atlantic, Southern Greenland, the Eurasian Arctic, and parts of North America. In these regions, temperature appears to be warmer than the 1961–1990 baseline. In some areas, temperatures even even as warm as today. However, certain regions, such as central Eurasia, northwestern North America, and the tropical Pacific are substantially cooler.

So the Medieval Warm Period was not a global phenomen. Warmer conditions were concentrated in certain regions. Some regions were even colder than during the Little Ice Age. For this reason, the paper's authors refer to the Medieval Warm Period as the more technical sounding 'Medieval Climate Anomaly' (the MCA in Figure 1). Personally, I don't see the term becoming ubiquitious. 

There is also an examination of temperature patterns during the Little Ice Age. There is pronounced cooling over the Northern Hemisphere continents. However, some regions such as parts of the Middle East, central North Atlantic, isolated parts of the United States and tropical Eurasia displaying warmth comparable to present day.


Figure 2: Reconstructed surface temperature anomaly for Little Ice Age (1400 to 1700 A.D.). Temperature anomalies are defined relative to the 1961– 1990 reference period mean. Gray areas indicates regions where adequate temperature data are unavailable.

What does this all mean? To claim the Medieval Warm Period was warmer than today is to narrowly focus on a few regions that showed unusual warmth. However, when we look at the broader picture, we see that the Medieval Warm Period was a regional phenomenon with other regions showing strong cooling. Globally, temperatures during the Medieval Period were less than today.

UPDATE 29 Nov 2009: NewYorkJ makes the suggestion of comparing the Medieval Warm Period temperature pattern to modern times. Here is the temperature anomaly for the last decade (1999 to 2008). As the color scale from the NASA map covers a broader range from -4C to 4C, I've edited the colours so they more closely match the MWP colour range.


Figure 3: Surface temperature anomaly for period 1999 to 2008. Temperature anomalies are defined relative to the 1961– 1990 reference period mean. Gray areas indicates regions where adequate temperature data are unavailable (NASA GISS)

UPDATE 1 Dec 2009: gp2 has also created a temperature pattern for the last decade using NOAA data. This time, the colour scale matches exactly the colour scale used in the Medieval Warm Period figure.


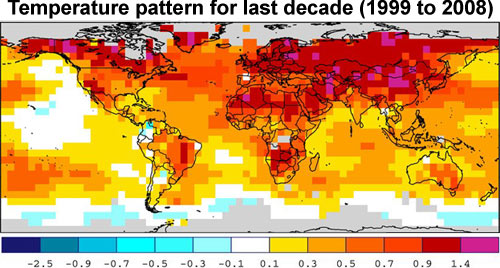
Figure 4: Surface temperature anomaly for period 1999 to 2008. Temperature anomalies are defined relative to the 1961– 1990 reference period mean. Gray areas indicates regions where adequate temperature data are unavailable (NOAA)

0 0

Printable Version  |  Link to this page

Comments

Prev  1  2  

Comments 51 to 66 out of 66:

  1. Those of you interested in temperature reconstructions might want to take a look at this recent review I happened to notice.
    0 0
  2. I think I read the whole story. My understanding is that the paper challenged the Mann's work, Mann and Phil coordinated on a response / rejoinder (completely acceptable). They weren't satisfied, and felt the need to coerce and the publication into firing their editorial staff by threatening to coordinate a mass with holding of publications by them and their buddies. The publication fired their editorial staff. did I miss anything?
    0 0
  3. You missed the truth "Truth"seeker. Your "understanding" is something other than "understanding". If you "read the whole story" you didn't comprehend it...or perhaps you read the wrong story??? The editorial staff weren't fired; they resigned. The publisher issued a statement that that the paper shouldn't have been published in the form that it was. http://www.sgr.org.uk/climate/StormyTimes_NL28.htm The paper was rubbish. The conclusions weren't supported by the data presented (there was no significant evidence for spatially-distributed contemporaneous warming on a worldwide scale in the hodge-podge of data presented, let alone that this constituted a global scale warming that was as significant as late 20th century and contemporary global warming). It's not a big deal. If we want to understand the science we don't "create" our "understanding" from one obviously dodgy analysis. That flawed paper (like all obviously flawed analysis) simply doesn't impact the insight of informed science, even if it is used for propaganda/misinformation purposes. There are dozens of papers that address paleoclimate/paleotemperature over the past millenium or two, and that body of work is what informs our understanding. It really depends whether one is or isn't interested in the truth....
    0 0
  4. Today's Nature has an insightful editorial on the CRU nonsense (apols for posting this on the wrong thread): http://www.nature.com/nature/journal/v462/n7273/full/462545a.html (not sure if this is freely accessible)...
    0 0
  5. Here's the EOS article that helped further convince the Climate Research editors that publishing Soon/Baliunas was a failure of the peer review process of that journal. http://www.geo.umass.edu/faculty/bradley/mann2003a.pdf It was also a clear attempt from Soon/Baliunas to game the peer review system by sending political junk to an editor they knew wouldn't give it critical evaluation. All of this context is lost when viewing only stolen personal emails on the topic. Mann and colleagues should be applauded for standing up for science.
    0 0
  6. @TruthSeeker: If you are really seeking the truth, how come you over and over again present judgments and 'facts' that are clearly contradicted by lots of information many consider as facts? "Firing their editorial staff"? Could you please check out better? It _is_ a big problem in science when flawed papers get through, and journals with too bad quality control _should_ be questioned. It is not about whether someone is factually correct, it is the quality of data, data processing, reporting and discussion. Soon/Baliunas may well be right, but that does not make the paper more worthy of publishing. One particularly important point, is to discuss alternative hypotheses, conflicting results and possible interpretation issues. In this regard, I think a lot of work should be improved. This is one of the reasons why the 'skeptics' often experience problems with the peer review process: They very often fail to discuss evidence contradicting their own views, and it does not help them that the mainstream guys also do a lot of the same. When you represent consensus, you normally don't have to discuss everything yourself, because so much of the stuff under discussion has already been handled by others. And the weight of consensus is mainly the weight of the evidence, not the weight of the 'authorities'. If we have 7 studies indicating no MWP in an area, and 2 indicating it, all studies equally reliable, the best estimate would probably be that there wasn't any, but we can't say for sure. It is always a mistake to neglect conflicting evidence, but it is a greater mistake to neglect 7 studies than to neglect 2. Such things must be kept in mind, otherwise it's too easy to become a conspiration theorist instead of a truth seeker. Remember, too, that shortcomings don't necessarily render a work worthless, nor do errors by themselves 'prove' fraud.
    0 0
  7. In Mann's graphs, why are there cells with a grey X and others without it? What does the grey X mean? (I don't have access to the full document, so I cannot look it up). Thanks.
    0 0
  8. This is more or less n topic, thanks mostly to TruthSeeker going off topic. TS, please read the detailed expose made by deepclimate.org. They have shown that it was Chris de Freitas (and others) who were in fact manipulating and subverting the peer-review process, not the other way round! The papers in question are all pseudo-science and should have never made it through peer review. The same culprits now often publish at Energy and Environment with other "sceptics" because contrarians have allegedly infiltrated that peer review and editorial process. PeterPan, in figures such as those shown above, the hatching is typically used to indicate statistical significance. Maybe John Cook could change the captions to specify exactly what the hatching means?
    0 0
  9. I am a bit perplexed when i look at Fig1 and Fig2 for MWP and LIA. Why do we have this remarkable anomaly over GreenLand?
    0 0
  10. I am even more perplexed now. Fig 3 and Fig 4 span 10 years of data. Fig 1 and Fig 2 span 300 years of data How can you compare 300 years of data to 10 years of data (what's more the hottest). I hope you realise that some of your detractors are accusing your side of cherry picking the data. Please don't do it on the site intended for the general public.
    0 0
  11. Anyone know if there has ever been a search through the monastic enclaves of europe/middle east, etc. for any kind of climate/temperature data from before instrument period?
    0 0
  12. This brouhaha has similarities to issues sweeping science generally. A hundred years ago peer reviewed journals made sense, and rarely did anyone need to read a lab notebook. Frauds (or incompetence) happened but we were satisfied with the pace at which failure to replicate an experiment would eventually clear out the false reports. As this was a great improvement over the amateur "gentleman scientist" or even pre-science era, it was a good thing. But time moves on. Two big changes are occuring. One is the decay of the peer reviewed publishing industry. It is affecting some branches of science faster than others, but it will eventually decimate all. As the newspaper business is collapsing under the internet, so are journals. The second change is the availability of technology which has redefined both possibilities and expectations of how results are reported. It is that same medium. The clear expectations are: - all data for published results is itself published - all procedures for manipulating the data are also published The mechanisms for this are the same kind of thing that Open Source software uses. Use modern statistics/math packages like R or IronPython or Mathematica or MatLab and database languages like SQL. It is not that hard and it makes mistakes less likely and process more easiliy inspected and shared. Climate science is an area screaming out for this. No wonder the critics are having a field day, most climate science is still in the last century paradigm on a new century key issue. At least one guy gets it, Hansen has open sourced his code, clearly explained his approach on the NOAA website, and ensured all the data is available. This resulted in two independent reimplementations of equivalent code that largely validated his results (one error was found which made only a slight correction). The climate investigation is not going to finish this year, or next, or in the next decade. And the critics are not going to stop. The way to deal with this situation is not to get defensive, it is to get open. Rethink the whole process and step into the 21st century.
    0 0
  13. Given normal climate cycles, how valid is it to compare an estimted (proxie) global average for a three hundred year period to a recent ten year period. There must have been a good number of 10 year periods during the 300 years that varied well outside the average.
    0 0
  14. Griffon1, some of the proxy records have decadal resolution or better for the MWP. Of course the MWP is long ago and our proxies cannot be as accurate as direct measurements we can make today, so some warmer periods might have existed. All we can say is the observations of the MWP do not give evidence to believe it was as warm as today.
    0 0
  15. The Wikipedia item gives a link to a pdf of the Science article: http://www.meteo.psu.edu/~mann/shared/articles/MannetalScience09.pdf . The Supplementary Information can be obtained from the Science website for those who want to read the full details and methodology.
    0 0
    Response: Thanks for the link to the full PDF of the paper - I've updated the link in this blog post as well as in the page addressing the skeptic argument: "Medieval Warm Period was warmer".
  16. I´d like to know more about data infilling in this kind of reconstruction. Mann´s paper (at least this one) does not say much about it. Can someone give me some research tip?
    0 0
  17. Would it be possible to display a graph of the direct difference between MWP and modern temperatures, as opposed to two graphs, each relative to some other base period? For example, that would make it much easier to spot locations that were warmer/cooler during the MWP than during the past decade, thus making it easier to point out the extent to which focusing on southern Greenland is cherry-picking. I think showing the MWP relative to the past decade would be the most useful, since it would address the oft-repeated claim that the MWP was warmer than today, by directly showing the extent to which that was true (or not) in each location.
    0 0
  18. 67, JimCA, Part of the problem is that the MCA spans a good 400 years. Some areas are warmer in 950, some in 1150, and so on. So what you really need is an animation demonstrating the anomalies over time. Someone could do so, but it would be a lot of work. I actually did start such a project, but it quickly stalled when life caught up with me. It is a lot of work, and it's really not worth that much. In the long run, temps are going to keep climbing and leave the MCA so far behind in the dust that it becomes a complete non-issue to anyone but the most hardcore deniers. Honestly, temps now are already well above any MCA peaks. You'll note that most graphs of the MCA with current temps end in 2000.
    0 0
  19. 67, JimCA, I did quickly use Photoshop to overlay the MCA temps onto the current temps using the NOAA data. In this image, purple areas will have been cold in one period and hot in the other (red + blue = purple). Greenish areas (cyan + yellow) will have been cool in one and warm in the other. Yellow, orange and red areas are in agreement between the two. As you can see, the main areas of "warming" overlap here are Greenland, the North Atlantic, and the North Sea, the USA contiguous-48, parts of the Amazon and the Congo and Southeast Asia, the Mediterranean Sea, northernmost Asia, and the western Pacific ocean. Canada, Eurasia, Europe (away from England), the Sahara, South Africa, the South Atlantic, the Indian Ocean, Australia and the equatorial Pacific were all cooler in the MCA and warmer today. Interestingly, in both cases the north central Pacific ocean and western South America are cool.
    0 0

Prev  1  2  

You need to be logged in to post a comment. Login via the left margin or if you're new, register here.


The Consensus Project Website

THE ESCALATOR

(free to republish)


© Copyright 2024 John Cook
Home | Translations | About Us | Privacy | Contact Us