Climate Science Glossary

Term Lookup

Enter a term in the search box to find its definition.

Settings

Use the controls in the far right panel to increase or decrease the number of terms automatically displayed (or to completely turn that feature off).

Term Lookup

Settings


All IPCC definitions taken from Climate Change 2007: The Physical Science Basis. Working Group I Contribution to the Fourth Assessment Report of the Intergovernmental Panel on Climate Change, Annex I, Glossary, pp. 941-954. Cambridge University Press.

Home Arguments Software Resources Comments The Consensus Project Translations About Support

Twitter Facebook YouTube Mastodon MeWe

RSS Posts RSS Comments Email Subscribe


Climate's changed before
It's the sun
It's not bad
There is no consensus
It's cooling
Models are unreliable
Temp record is unreliable
Animals and plants can adapt
It hasn't warmed since 1998
Antarctica is gaining ice
View All Arguments...


Username
Password
New? Register here
Forgot your password?

Latest Posts

Archives

The albedo effect

Posted on 5 November 2009 by John Cook

Change to the Earth's albedo is a powerful driver of climate. When the planet's albedo or reflectivity increases, more incoming sunlight is reflected back into space. This has a cooling effect on global temperatures. Conversely, a drop in albedo warms the planet. A change of just 1% to the Earth's albedo has a radiative effect of 3.4 Wm-2, comparable to the forcing from a doubling of CO2. So is it unreasonable to wonder if albedo might have something to do with this global warming caper?

Albedo trends before 2000

There are various factors that affect the Earth's albedo. Snow and ice are highly reflective so when they melt, albedo drops. Forests have a lower albedo than open land so deforestation increases albedo (but for the record, no, chopping down all our forests is not the solution to global warming). Aerosols have a direct and indirect effect on albedo. The direct effect is by reflecting sunlight back into space, cooling the Earth. The indirect effect is when aerosol particles act as a cloud condensation nucleus, affecting the formation and lifetime of clouds. Clouds in turn influence global temperatures in various ways. They cool the climate by reflecting incoming sunlight but can also warm the climate by trapping outgoing infrared radiation from the surface.

All these factors are considered when adding up the various radiative forcings that drive climate. Changes in land use are calculated from historical reconstructions of cropland and pastureland changes. Combinations of satellite and surface-based observations allow us to determine trends in aerosol levels as well as cloud albedo effect.


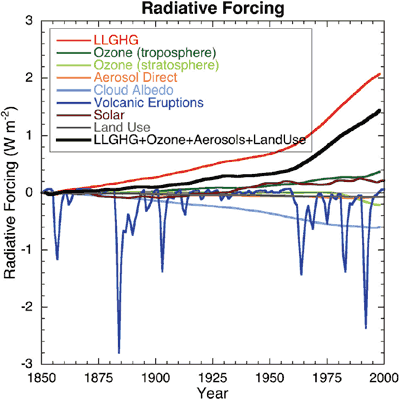
Figure 1: Globally and annually averaged radiative forcing (Chapter 2 of the IPCC AR4).

What we observe is that of the various albedo forcings, cloud albedo is the most dominant effect. The long term trend is that of cooling with a radiative forcing from 1850 to 2000 of -0.7 Wm-2.

Albedo trends since 2000

One method to determine the Earth's albedo is to measure earthshine. This is sunlight reflected from the Earth and then reflected from the Moon back to the nighttime Earth. Earthshine has been measured at the Big Bear Solar Observatory since November 1998 (with some measurements in 1994 and 1995). Figure 2 shows changes in albedo calculated in Palle 2004 from reconstructed satellite data (black line) and Earthshine measurements (blue line).


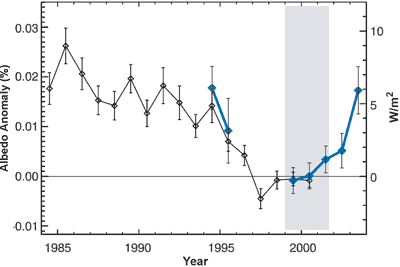
Figure 2: Albedo anomalies reconstructed from ISCCP satellite data (black) and Earthshine-observed albedo anomalies (blue). The right hand vertical scale shows negative radiative forcing (eg - cooling) (Palle 2004).

The data in Figure 2 is problematic. The black line, reconstructed from ISCCP satellite data, "is a purely statistical parameter that has little physical meaning as it does not account for the non-linear relations between cloud and surface properties and planetary albedo and does not include aerosol related albedo changes such as associated with Mt. Pinatubo, or human emissions of sulfates for instance" (Real Climate).

Even more problematic is the spike in albedo around 2003, shown by the blue earthshine line. This is in sharp contrast to satellite measurements which showed little to no trend over the same period. To put this in perspective, consider the Pinutabo volcanic eruption in 1991 which spewed aerosols into the atmosphere. These aerosols reflected incoming sunlight, causing a negative radiative forcing of 2.5 Wm-2. This led to a dramatic drop in global temperatures. The earthshine data indicated a radiative forcing of nearly -6 Wm-2 which should've caused a precipitous drop in global temperatures. No such drop occured (Wielicki 2007).

In 2008, the reason for the discrepancy was discovered. The Big Bear Solar Observatory installed a new telescope in 2004 to measure earthshine. With the new and improved data, they recalibrated their old data and updated their earthshine albedo results (Palle 2008). Figure 3 shows the old albedo data (black) and the updated albedo (blue). The anomalous 2003 spike disappears. Nevertheless, a trend of increasing albedo remains from 1999 to 2003.


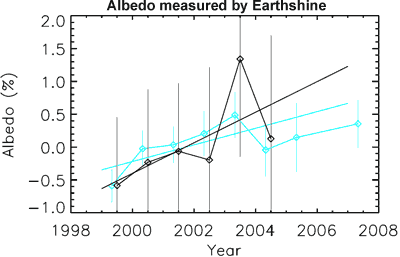
Figure 3: Earth albedo anomalies as measured by earthshine. In black are the albedo anomalies published in 2004 (Palle 2004). In blue are the updated albedo anomalies after improved data analysis, which also include more years of data (Palle 2008).

How accurate is the earthshine method in determining global albedo? For starters, the method doesn't give a global albedo estimate. It covers about one third of the Earth at each observation occasion and certain areas can never be ‘‘seen’’ from the measurement site. Furthermore the measurements are sparsely sampled in time, and only made in a narrow wavelength band of 0.4 to 0.7 µm (Bender 2006).

In contrast, satellite data such as CERES is a truly global measure of the Earth’s reflected shortwave radiation, including the effects of all atmospheric and surface properties. It covers a broader spectrum than earthshine (0.3–5.0 µm). Loeb 2007a compares 4 independent sets of satellite data: CERES, MODIS, MISR and SeaWiFS. Albedo as measured by CERES shows no long term trend from March 2000 to June 2005. They also find "remarkable consistency" between the 4 satellite results.


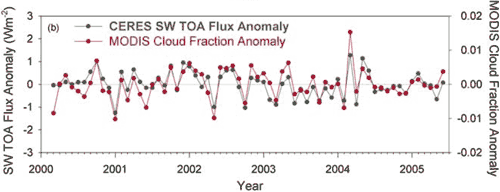
Figure 4: Monthly anomalies in global mean CERES SW TOA flux and MODIS cloud fraction (Loeb 2007b).

So albedo has had an effect on global temperatures - mostly a cooling effect on long term trends. As for recent albedo trends, earthshine data shows increasing albedo from 1999 to 2003 but little to no trend from 2003. Satellites show little to no trend since 2000. The radiative forcing from albedo changes in recent years appears to be minimal.

For more info, see Papers on the albedo of the Earth by AGW Observer.

0 0

Printable Version  |  Link to this page

Comments

Prev  1  2  

Comments 51 to 81 out of 81:

  1. Riccardo, you have fallen in my trap. If you know the answers coming from my experiment, and if you say that the earth is a greenhouse then......what is my conclusion????
    0 0
  2. Henry Pool, given that you think that absorption is a confusing word and that the missing intensity at some wavelgths at the earth surface are an indication of higher reflectivity, belive me, i can't anticipate what your conclusions might be.
    0 0
  3. To make it even more interesting you could do a third experiment at the CO2 concentration as it was 50 years ago, i.e. 280 ppm. But let's face it. I don't expect either the odd 280 nor the current 350 ppm's CO2 to make any difference on the heat retention inside that vessel. Maybe if you filled the vessel up to 50 or 100% CO2 would you see some influence on the heat retention. But that has been my point from the beginning: you must do your testing in the relevant concentration range. So what is my conclusion? I have clearly proven to you with my experiment no.1 that global warming is most probably caused by the increase in energy released in the atmosphere due to human activties. Think of all the warfare in the past,explosions of atomic boms in the Indian ocean, oil and gas fields burning, etc. Also, living in Africa, I would say that people living without electricity do not necessarily cause less energy to be released. To cook and to stay warm they just burn anything that they can find, and you cannot blame them. If global warming is indeed not caused by carbon dioxide you may feel a little less guilty about driving your car. But don’t open the champagne bottles just yet. The fight against global warming might in fact get more difficult. If global warming = us, we would have to reduce the total energy output per person. We have to steal energy from nature. (Wind, gravity, tides, solar etc.). Carbon emissions would not be green. Nuclear energy would not be green. Hydrogen and oxygen combustion (rocket fuel) would also not be green. In fact, in that case we will have to re-visit the whole global warming debate, for example in the case of sending rockets out to space: will the burden of all that energy released in the atmosphere by placing that satellite in orbit, result in similar savings in energy on earth?
    0 0
  4. Henry Pool, i don't see any proof of whatever but just what you immagine would happen. It's offtpic in this post on albedo talking on attribution of global warming, but anyways, whenever you immagine a possible cause you should quantify it to confirm that you get reasonable numbers. Anyone could say to not have a swim because the ocean would warm ...
    0 0
  5. Henry Pool, your prediction about the outcome of your proposed experiments--that the amount of CO2 in the vessel will make no difference--is not a result of your experiment. Science requires actual measurement, not merely thought experiments. Your prediction is incorrect, as has been measured (not merely imagined) since the 1800s. As Riccardo informed you already, Tyndall did it in the 1800s, and it has been repeated thousands of times since, with the same result, though with increasing precision and accuracy. It's even done by students 11 to 14 years old! Here is one set of instructions with photos and a graph of results. Here is another. And here is a worksheet from a different country, with better diagrams to help students set up and run the experiment. You can easily do this experiment in your kitchen so you have empirical results instead of your guesses. The Physics Forum thread "Need Help: Can You Model CO2 as a Greenhouse Gas?" has descriptions, and links to other descriptions, of several versions that use plastic soda bottles or bags instead of glass flasks. That same discussion thread discusses solutions to problems you might encounter in running your experiment. That thread addresses this topic only until page 4, then drifts away for a while, but comes back to the topic on page 9 but no further than page 9. Of course, scientists have not done such crude versions of the experiment since the 1800s. Instead they have done far more sophisticated experiments. Those are done by college students and graduate students hundreds of times every year, always with the same result of CO2 slowing the escape of infrared radiation. The most recent experiments done by professional scientists rather than students are published in the peer-reviewed scientific literature. Some of the most recent examples of those are listed in the AGW Observer's site: Measurements in laboratories are listed in one section, and measurements in the atmosphere are listed in another section.
    0 0
  6. Henry, here is a quick quantification of direct anthropogenic heat production: http://www.realclimate.org/index.php/archives/2009/10/an-open-letter-to-steve-levitt/ Direct anthropogenic heating, even under assumptions favorable to it as an hypothesis, explains very little of the observed energy content increase of the Earth. The Arctic (and other low human density and activity places like mountain tops) is warming much faster than other places, nighttime is warming faster than daytime despite less energy burning at night.... What does this tell you?
    0 0
  7. Henry Pool wrote "I have clearly proven to you with my experiment no.1 that global warming is most probably caused by the increase in energy released in the atmosphere due to human activties." Henry, if you demand more detailed evidence than the quick quantification that Steve L quickly provided you, you can look for free at the presentation by Flanner, et al. (2009), "Integrating Anthropogenic Heat Flux With Global Climate Models." Even more detail is in the companion journal article: Flanner, M. G. (2009), Integrating anthropogenic heat flux with global climate models, Geophys. Res. Lett., 36, L02801, doi:10.1029/2008GL036465. Averaged over the entire globe's surface, anthropogenic heat flux contributed only 0.028 watts/meter^2 in 2005. That's a tiny fraction of the forcing from CO2, which is 2.66 watts/meter^2.
    0 0
  8. Henry, if you want to see the raw data used by Flanner so you can do the calculations yourself (see my previous comment on 22 November), you can get them from this web site he put up. He wrote there, "Globally, in 2005, this anthropogenic heat flux (AHF) was +0.028 W/m2, or only about 1% of the energy flux being added to Earth because of anthropogenic greenhouse gases." That page also has some other references, if you don't want to pay to see his journal article.
    0 0
  9. Henry, there is even a video of an actual child explaining his actual experiment of the sort I previously pointed you to.
    0 0
  10. Ok, I will go through all of your comments in more detail later. Are you people saying that in my experiment 2, there will actually be something of an increase in heat retention to obeserve? if yes, how much in the concentration range of 0.01 to 0.05 % CO2. I don't think a child can do this. I think I made a mistake by putting in air (Experiment 2), I think we must leave the water vapor out of it, just stick with the 80/20 N2/O2 and then add the 270, 350 and 500 ppm CO2 (we need to know exactly where we are going) These are the results I was hoping to find somehwere and never got it. even so, I think there will never be as much heat retention by CO2 as in experiment 1, between A and B.
    0 0
  11. on 52&54 yes we have strayed from the subject (although I still have good hopes that mostly the noted increase in ozone will bring us global cooling due to an increase in earth's albedo and a closing of the ozone hole) but I think this straying is and was necessary. We have touched on a new subject now: AHF. Maybe another post? Anyway, Tyndal proved that it was mostly water keeping our planet warm, and he was right about that. Don't forget that at about 70% RH you have about 1-1.5% water vapor in the air, compared to CO2 of 0.038% (which really is next to nothing compared to the H2O) the point that you, Riccardo, seem to forget is that you think that the "absorption" process is limitless. It is not.Every molecule can only absorb that much photons. After that the light must keep on moving, so where it it wanted to move (because the molecule is now full) it cannot. It cannot move through either (like it does through N2). so it has to scatter. At least 50% is scattered to out of space. I( did not provide prove for my experiment, because I donot have the equipment. But I can easily guess the outcome!
    0 0
  12. @Tom on 55 The tests you refer to all compare air with 100% CO2. That was exactly not the idea of my experiment. I am a chemist. I know that if you change concentrations (in a solution) you might get different properties (as a whole). In my experiment, I wanted to know what difference 350 ppm's CO2 makes on heat retention. Just admit it: at that concentration it is probably not even measureable in my experiment.... However, a doubling of a release of energy (to simulate the doubling of the earth's population) in our (earth)vessel was easily measurable. Or do you also doubt the outcome of my experiment 1?
    0 0
  13. @ Steve and Tom on 56 I note that there are some unbelievably big variations in the AHF measured. Like in my country of birth (Holland) they measured 4.2 W/m2. However, globally, it is reportedly only 0.03 W/m2. How can that be? I think there are some missing data, mostly from the underdeveloped countries?> On the subject of where to easily note global warming: Note that nuclear facilities are all placed near oceans or seas because they need tons and tons of water to cool. The AHF warming goes mostly into the oceans.... In many places, AHF takes place mostly near mountains or mountain ranges. (constant water supply for human activities)
    0 0
  14. Henry Pool, still off topic here, but for you knowledge a reasonable aproximation for the differenze in forcing of CO2 alone in the atmosphere is deltaF=5.35*ln(C2/C1) in W/m2 with C1 and C2 two CO2 concentrations. You can play around with those numers if you like. You idea of limited absorption is absurd and this is once more missing basic physics. It would require each molecule to stay in an exited state forwever which is simply impossible in any real world. Saturation experiments has indeed been done, but they require ultrafast high power lasers As for the future closure of the ozone hole, yes, it will be a negative forcing localised in the stratosphere which is expected to cool somewhat less; not due to reflection, though, but absorption of some UV.
    0 0
  15. Hi Riccardo: where did you get this formula? The concentrations measured in what units? Quote from Wikipedia (on the interpretation of the greenhouse effect); "The Earth's surface and the clouds absorb visible and invisible radiation from the sun and re-emit much of the energy as infrared back to the atmosphere. Certain substances in the atmosphere, chiefly cloud droplets and water vapor, but also carbon dioxide, methane, nitrous oxide, sulfur hexafluoride, and chlorofluorocarbons, absorb this infrared, and re-radiate it in all directions including back to Earth." The way I understand this process is as follows: Water and carbon dioxide behave similarly when exposed to infra red radiation. Each molecule accepts one or more photons. Once this transaction is completed the molecule becomes sort of like a little mirror to infra red radiation (at those wavelenth bands where absorption takes place) and the molecules start reflecting the infra red. Because of the random position of the molecules we may assume that at least 50% of that radition from earth is radiated back to earth. The process repeats itself. Obviously when the sun's radiation hits the water vapor and the carbon dioxide the same thing occurs, but now 50% is reflected out to space. I assume/ would think that if the radiation stops, the photons in the molecule are converted to kinetic energy to any of the molecules in the immediate vicinity How do you understand the definition? Consequently I also disagree with you on your last point. The ozone is very little. How much UV do you think can be absorbed? Once the molecules are saturated the UV is blocked - like a mirror - and light being what is does best, it has to move, so it moves.....out!! The thicker the layer of ozone, the more UV light is reflected, hence the increase in earth's albedo.
    0 0
  16. Henry, the Wikipedia entry you quoted says "...re-emit much of the energy." Your interpretation of "re-emit" meaning "the molecule becomes sort of like a little mirror...and the molecules start reflecting" is completely wrong. RKM.com.au provides an excellent animation (at the top right of the page), an accompanying static diagram (at the lower left of the page) and a step-by-step textual explanation of it all (at the right side of the page). Please don't merely skim all those as you seem to usually do. Study carefully. Notice that there is no second infrared photon hitting the molecule and being reflected. Instead, the molecule "re-emits" the same energy it just absorbed. "Re-emit" means "emit the same energy it just got." The molecule stores the energy it absorbed by putting it into vibration of the bonds among the atoms in the molecule, as is explained in the text accompanying that picture. The energy in those vibrations then is emitted as infrared radiation, with the result that those vibrations cease. The energy is neither destroyed nor created. It merely changes location and form from photon to bond vibration and back to photon. Molecules have several modes of vibration; animations of those are provided by the Journal of Chemical Education site (see Figure 2 there). Each of those modes can contain energy independently of the other modes, and several amounts of energy can be contained by each of the modes. So even if a molecule has absorbed one photon's energy, it has enough storage capacity to absorb more. The re-emission happens almost instantaneously after the absorption that triggered it, which means the molecule's storage is freed up almost instantly after it is filled. But if occasionally a photon does hit the molecule while the molecule cannot absorb any more, the photon does not get reflected because of that; it does indeed just pass through/around. (Remember, a photon is actually/also a wave packet.) Reflection is a completely different phenomenon that is governed by oompletely different laws, as we have explained to you before. An excellent explanation of greenhouse gas bonds, vibrations, energy storage, and energy re-emission is in David Archer's free "Lecture 6: What Makes a Greenhouse Gas". (It's in Chapter 4--the sixth lecture in the overall list of lectures.)
    0 0
  17. Henry Pool, apart from the erroneous interpretation of the Wikipedia article (by the way, better study these topics from a textbook or a specialized site like Tom Dayton suggested), your idea point to a constant albedo of 0.5 for any plane with an atmosphere, which is definetely wrong. You should always contrast your undesrtandings with numbers and with other situations. The formula of the inrreased forcing is one of the many that can be used; it's of the most used and is found many aproximate calculations and in the IPCC reports. Sometimes the coefficient is slightly different from the one i gave you.
    0 0
  18. I will look at your interpretations of the definitions later, but I think we are straying now from the the two experiments that I have suggested. 1) Are we agreed that in experiment 1 there will definitely be a measuruable difference between the surface areas of A and B, meaning that AHF must/may have some significant bearing on global warming. 2) Are we agreed that in experiment 2, if we do not use air but add 350 ppm CO2 to the 80/20 mixture, there will be no measureable heat retention, i.e. no difference in the surface areas between A and C and between B and D. My conclusion would be that the concentration of CO2 is too small to make any difference. In this experiment, it will not be possible to prove that the increase by 25% of CO2 since 1960 has any significant bearing on global warming. As it is in this experiment so it is probably also in practice. And that, in my opinion, means that the influence of CO2 on global warming is probably grossly overstated. Now if instead of CO2 we were to add 1 or 2 % water vapor in experiment 2, I am sure that there may well be some measurable influence on heat retention. And that brings me to some human activities that were probably never included in any measurements of AHF: namely those activities that produce water vapor a) nuclear plants b) burning of fossil fuels c) building of shallow water reservoirs and dams for consumption and irrigation - also swimming pools; the sun heats the water up and subsequently causes more water vapor. I am sure I have not covered all human activities causing more water vapor, for example, when we cook, or have a bath or shower. Washing dishes. The list is endless. We boil. We make water vapor. All the time. MY point is that the increase in water vapor caused by human activities is probably much larger than the increase in CO2 and the effect on heat retention much more pronounced. I think even Tyndal would have agreed with me on that?
    0 0
  19. Henry, water vapor added by humans merely falls out of the atmosphere within an average of 10 days. See my explanations on the water vapor thread both here and here.
    0 0
  20. Henry Pool @63: Are you saying you think the Anthropogenic heat flux is improperly estimated, and therefore calculations of its negligible impact give the wrong conclusion? As Ricardo points out, it would serve you well to do some calculations. Holland AHF = 4.2 W/sq m, Holland population = 6.1 million, Holland area = 5,500 sq km ... turn that into AHF per capita = 3,800 W. Now assume 7 billion people on Earth all have the same AHF and then divide by the surface area of the planet (510 million sq km) = 0.05 W/sq m. I imagine that Hollanders have AHF about twice the average human on Earth. As pointed out elsewhere, this is a very small amount relative to changes in radiative forcing owing to CO2. If you want to blame water vapour instead of CO2 you're wrong**, but you're less wrong because you're now saying that greenhouse gases are more important than AHF in contributing warming. And, just so you know, this contradicts your position that increasing greenhouse gases such as water vapour should cool the Earth. (**Read the stuff Tom links for you in 70 and elsewhere.)
    0 0
  21. @ Steve 71, I think AHF might be wrongly calculated, even in Hld. But can you answer me on 68? See also below. @ Tom on 70: yes I would assume that the water soon condenses back to water - but do you know what happens when water condenses? well the converse of that process - namely water turning into vapor is being used by everyone in industry who has a process or a place that needs to be cooled. You can see these cooling towers in almost every factory. I know a lot about that. It is exactly that heat when the water vapor from human activities condenses that nobody seems to be counting.
    0 0
  22. Henry #72: When the vapor condenses it releases the same energy that it absorbed in the process of becoming vapor in the first place. That energy that turned it into vapor in the first place is indeed counted in the anthropogenic heat flux (AHF) calculations I pointed you to. If you don't believe me you can simply look at the papers and even raw data that I pointed you to in #70.
    0 0
  23. You have another problem, Henry: you think about calculations without ever performing any. Now that you've moved the goalposts, show why you think AHF is wrongly calculated for Holland. Next calculation problem: you've already been shown that AHF is insignificant relative to changes in radiative forcing; do your own calculations and see how reduced transpiration owing to deforestation and desertification (not to mention changes in albedo) dwarf direct anthropogenic increases in water vapour. Or instead, actually read the stuff you've been pointed to. At http://www.realclimate.org/index.php/archives/2009/10/an-open-letter-to-steve-levitt/#more-1488 you should have read this: "For example, that 6 trillion Watts of waste heat from coal burning would amount to only 0.012 Watts per square meter of the Earth’s surface. Without even thinking very hard, you can realize that this is a tiny number compared to the heat-trapping effect of CO2. As a general point of reference, the extra heat trapped by CO2 at the point where you’ve burned enough coal to double the atmospheric CO2 concentration is about 4 Watts per square meter of the Earth’s surface — over 300 times the effect of the waste heat." Note: you shouldn't count the waste heat twice (once when it generates steam to turn the turbines and then again when the steam condenses, there IS a reason they're called "cooling towers" after all), but it doesn't make much of a difference if you do. Of course, by changing your argument to this, you should acknowledge the wrongness of your argument that AHF is mostly pumped into the oceans (which was a ridiculous claim given the small role of nuclear in power production and given the great distances between that power production and the Arctic). My last reply to you got scrubbed from the record. Let me just say (1) you don't have a coherent explanation for, well, anything and (2) you haven't demonstrated a grasp of the strongly substantiated explanation of AGW that you are trying to criticize. Do try and learn something, please, so that (in a couple of years when I've forgotten that I shouldn't reply to you) we won't cover the same ground.
    0 0
  24. I note that nobody answered me directly on 68! Steve, nobody has shown to me in an experiment what the influence is of 70 ppm's of CO2 that were added to the atmosphere since 1960. The formiula's and the values for the forcings for CO2 concentrations just fall out of the air somewhere (no pun intended). 1.7 has been mentioned. Tom talks about 2.6. Riccardo even has a formula. I just don't know where those vales come from. I want to see experiments and meaurements, not proportional blame that the IPCC has decided upon/ based on comparisons to concentrations back to as far the year 1750. If it is so easy for you, why not just explain to me how the experiments were done? I asked you to comment on 68 and you did not. I am saying: whatever is causing global warming (if it still happens) my conclusion from whatever "evidence" I have seen so far is that it is not caused by CO2. As Weart told me some time ago: you cannot see the evidence because the wise men have decided to hide it in papers that cannot be accessed. If it is so difficult to explain as to how the tests were done that proves that those 70 ppm's of CO2 added are significant, how can we expect non-scientists to make the right decisions in Copenhagen?
    0 0
  25. @Tom at 72 There is an important point that you forgot. As we have discussed much earlier in this subject, one of the reasons that the earth's albedo increased, is (probably) because of increased human activities concerning the creation of shallow waters (dams). This is water for human consumption and irrigation. This water heats up (easily, because it is shallow)), and water vapor is created. This traps the heat coming from earth. This is what is definitely not counted in AHF?
    0 0
  26. Henry (#74), I answered your #68 question already in my #55. But apparently you stopped reading before you got to my last paragraph, where I pointed you to a list of scientific papers reporting on experiments that systematically varied the concentration of CO2, and other parameters, and measured the effects. Those empirical results, and others, have been built into a graphical computer program by David and Jeremy Archer, that you can run to see the effects of varying concentrations of CO2, water vapor, and other factors, in the transmission of radiation through the Earth's atmosphere.
    0 0
  27. Henry, I already answered your #75 in my comment #69. Extra water vapor "added by humans" includes water evaporating from human-created pools.
    0 0
  28. Tom, here is the quote from your "list" "This is a list of papers on laboratory measurements of the absorption properties of carbon dioxide. In the context of these paperlists this is a difficult subject because none of the papers seems to be freely available online, so we have to settle on abstracts only. However, I don’t think that matters that much because the main point of this list really is to show that the basic research on the subject exists. The list is not complete, and will most likely be updated in the future in order to make it more thorough and more representative." Now go back to see what I wrote in 74: As Weart told me some time ago: you cannot see the evidence because the wise men have decided to hide it in papers that cannot be accessed. If it is so difficult to explain as to how the tests were done that proves that those 70 ppm's of CO2 added since 1960 are significant, how can we expect non-scientists to make the right decisions in Copenhagen? I am not interested in abstracts. I want to see the results and how the tests were done... how much heat retention is caused by 100, 200, 300, 400 ppm etc. and you will find that such results do not exist because you cannot measure anything relevant at those concentrations of CO2. To extraolate results from high concentrations back to lower concentrations is the wrong type of science. Properties change at different conc. levels. You must always measure at the relevant concentrations. In addition, no one seemed to have realised that CO2 causes cooling (reflection of sunlight) as well as trapping of earth's radiation. So you have to take that into account in your testing method as well.
    0 0
  29. Henry, those papers are not "hidden." They are published in journals. Publicly. That's the point of "publishing." That's what "published" means. That blurb about none of the articles being available on line is left over from when the list was first started. Now many of the articles are available on line, and some even for free. If you go to the trouble to actually click on the links that are the titles of the articles, you will be able to see for yourself whether the full articles are available on line. In fact, the very first one on the list (Toth et al. 2008) is in fact available on line for free--the full text, both in HTML and PDF. If the full article is not available for free on line, often you can still get it on line by spending just a little money. Or you can get any of those articles for free by getting out of your armchair and going to a library to look at the paper versions. If you don't have a university library nearby, your local public library can get copies of the articles for you.
    0 0
  30. Oh nice, "hidden in a published paper". It's called an oxymoron.
    0 0
  31. So in what paper specifically will I get the answer to my question: If carbon dioxide traps infra red radiation from earth (keeping us warm) then it must follow that carbon dioxide also shields us from the sun (similar to ozone blocking UV and water vapor blocking IR). So what is the nett effect, especially at the relevant levels of carbon dioxide of 0.02% – 0.05%? If you think it is so easy to get an asnwer to my question, why not just give it to me? I have been searching for months, and I did not get it.
    0 0
  32. There is a growing body of evidence that in equatorial latitudes trees induce symbiotic bacteria and certain chemicals into their transpiration streams which increase reflective cloud cover over tropical forests during the day which is the best time to promote cooling. Please see www.weforest.com and read the white papers and watch the videos on our pages there.
    0 0
  33. NASA showed that even with a radiometer on the Moon, you could not come close to measuring the Earths global climate due to lack of coverage. Earthshine (science et al) is a globally discredited paper and should not be used by any climatologist trying to detect 0.3%/decade albedo and 0.5%/decade cloud climate feedback effects. On the other hand review 2009 G. Matthews, “In-flight Spectral Characterization and Calibration Stability Estimates for the Clouds and the Earth’s Radiant Energy System” Journal of Atmospheric and Oceanic Technology. Vol 26, Issue 9, pp 1685-1716. This explains how existing CERES data has significant calibration drifts (also which are correctable). Initial analysis shows corrected CERES data would show a slightly reducing albedo from 2000-2007 and a slightly increasing outgoing long wave. Read the paper and assess it yourself.
    0 0

  34. The doubts about CO2 warming effects have never so far been answered by useful dialogue describing in compelling ways how CO2 warming actually happens. Let me offer the following:
    The sun warms the earth but about 30% of the sun's energy is reflected back into space by snow and ice, which perfectly reflect the wavelengths of energy coming from the sun. The atmosphere is transparent to the sun's energy so all that reflected energy escapes to space. The other 70% is absorbed by the earth and then re-radiated at longer wavelengths. Most of those wavelengths pass on through to space but a cluster around 15 nanometers is absorbed by CO2 and then re-radiated, half toward space half toward earth. That incoming 15 nanometer energy is not reflected by snow and ice. Instead they absorb it completely and it causes them to melt. That's why glaciers all over the world are melting (not because the air is warmer). That also explains why the sea ice in the Arctic has been disappearing in the summer. Now that the ice is gone the energy of the summer sun beams down on open Arctic water instead of ice and is absorbed instead of being reflected. That changes the energy balance of the earth. The effective albedo around the North Pole has changed enormously. I submit that this is probably the largest contributor to global warming and find it more than strange that nobody seems to have commented on this as a compelling explanation of global warming.

    0 0
  35. cMike... Your description is okay, but it's really only one piece of the puzzle, and is something that's been well understood for many decades. There's quite a lot more science involved to explain how CO2 operates in the atmosphere to warm the planet. We have lots of articles here at SkS that you can read. A good place to start is the SkS welcome page.

    0 0
  36. cMike @84, first many people have produced good, sucinct explanations of the greenhouse effect.  Here at Skeptical Science you have two such explanations by Chris Colose (The Planatery Greenhouse Engine Revisited; and Joseph Postma and the Greenhouse Effect Pts 1 & 2).  Pitched for easier comprehension, there is also my post on the subject (which, of course, I recommend).

    Beyond that, your explanation contains a number of small, and one larger error.  The larger error is that greenhouse gases do not simply reemitt the energy absorbed by radiation.  Instead that energy is typically transfered to other molecules by collisions as either kinetic energy or changes in excitation states.  In short it is thermalized, that is converted into kinetic heat energy.  At the same time, a certain percentage of greenhouse gas molecules will always be in an excited state because the temperature of a gas, with the percentage depending on the temperature of the gas.  That means the greenhouse gases will radiate at a rate dependent on their temperature, with the radiation going equally in all directions.

    With regard to minor points, Ice has an albedo around 0.9, but snow has an albedo that depends on its age, and varies from 0.5-0.9, with lower values to be found in older snow.  That is very important because typically sea ice is covered by snow.  Further, clouds alone add an albedo of about 0.2 to the Earth, but the total albedo is only 0.3 because of overlap.

    Finally, here are the relative strengths of various feedbacks as determined by the IPCC AR5:

    P is the Planck feedback, which determines the temperature response to a forcing with no other feedbacks.  WV is the Water Vapour feedback.  LR is the Lapse rate feedback.  WV&LR is the Water Vapour plus Lapse Rate feedback.  They are shown coupled like that because they are related to each other, with the result that uncertainty is the combined feedback is much less than that in each seperately.  C is the cloud feedback, which is the most uncertain of all the major feedbacks.  Finally, A is the albedo feedback from changes in ice and snow.  It is 18.75% of the strength of the water vapour feedback, which is the strongest of the positive feedbacks.

    The figure is Figure 9.43 and the tabular data from which I calculated relative strength is from Table 9.5.

    0 0
  37. Thanks to all of you who read my post. It had been quite a while since the previous one. I was attracted to this site because I was looking for albedo related facts, especially related to the delta effect of the loss of arctic sea ice. I have read extensively about global warming and actually do know about the role of water vapor (i.e., the water cycle), clouds as contributors to the albedo effect and the thermal heating aspects of CO2 on the atmosphere. That said, assertions that things are more complicated than what I included, while true, kind of miss the point.

    Focusing on thermal warming of the atmosphere suggests that it is the atmosphere's warming that is the problem.  Yet the truth about global warming is that it is ultimately about warming of the oceans and the temperature of the air is almost irrelevant compared to the solar energy impinging on the oceans and the evaporative cooling that offsets it. In other words the heat transfer from air to water is negligible. So what would warm the oceans?  My first post posits a mechanism: solar warming of arctic seas no longer hidden under sea ice. What I had hoped to find was some analysis that computed the area of lost ice and calculated the difference in reflectance between ice (ok 90% isn't perfect) and water to estimate the added energy absorbed.  I keep hearing comments about how much greater the effects of "global warming" are in the arctic but never a why. I'm describing the why here and hope somebody can help quantify it. 

    0 0

Prev  1  2  

You need to be logged in to post a comment. Login via the left margin or if you're new, register here.


The Consensus Project Website

THE ESCALATOR

(free to republish)


© Copyright 2024 John Cook
Home | Translations | About Us | Privacy | Contact Us