


 Arguments


Human activity continues to warm the planet over the past 16 years
What the science says...
| Select a level... |
 Intermediate
|
 Advanced
| |||
|
Once natural influences, in particular the impact of El Niño and La Niña, are removed from the recent termperature record, there is no evidence of a significant change in the human contribution to climate change. |
|||||
Climate Myth...
No warming in 16 years
"...there has been no increase in the global average surface temperature for the past 16 years" (Judith Curry and David Rose)
Update 26/05/2013: The '16 years' video, originally linked from this article, is not representative of the scientific consensus. In fact the short term trends are rather more complicated. The problem is explained in more detail in this article.
Humans have continued to contribute to the greenhouse warming of the planet over the past 16 years. The myth arises from two misconceptions. Firstly, it ignores the fact that short term temperature trends are strongly influenced by a variety of natural factors and observational limitations which must be analyzed to isolate the human contribution. Secondly it focuses on one small part of the climate system (the atmosphere) while ignoring the largest part (the oceans). We will address each of these errors in turn.
What factors influence the 16 year trend?
Climate scientists have traditionally looked at climate over long periods - 30 years or more. However the media obsession with short term trends has focussed attention on the past 15-16 years. Short term trends are much more complex because they can be affected by many factors which cancel out over longer periods. In a recent interview James Hansen noted "If you look over a 30-40 year period the expected warming is two-tenths of a degree per decade, but that doesn't mean each decade is going to warm two-tenths of a degree: there is too much natural variability".
The list of factors which can affect short term temperature trends is extensive, and some of them can rival the global warming signal in magnitude over short periods. The following table identifies a range of influences on the recent temperature trend:
| Influence | Effect | Notes |
| Human GHG emissions | Warming | |
| Human sulphate emissions | Cooling | Recent emissions from China |
| Coverage bias | Cooling | HadCRUT4 and NOAA only |
| Sea surface temperature bias | Cooling | GISTEMP and NOAA only |
| The El Niño oscillation | Cooling | The recent run of La Niñas |
| Volcanic erruptions | Warming | Recovery from Pinatubo erruption |
| Solar cycle | Cooling | Recent solar minimum |
| Longer term oscillations | Unknown | AMO and PDO |
| Change in ocean heat uptake | Cooling | Balmaseda et al (2013), Guemas et al (2013) |
Most of the short term influences, with the exception of greenhouse gas emissions and probably volcanoes (but see Neely et al 2013), have had a cooling influence. As a result it is unsurprising that we have seen a reduced rate of warming over the past 16 years. The fact that there has been any warming at all is strongly supportive of the warming effect of greenhouse gas emissions.
The fundamental mechanism of global warming is a change in the top-of-atmosphere energy balance, and as a result the energy content of the climate system provides a more direct measure of global warming which avoids many of these problems, although the observational record is shorter and less complete (e.g. Church et al 2011).
The rest of the climate system
Focusing on surface air temperatures also misses more than 90% of the overall warming of the planet (Figure 2).
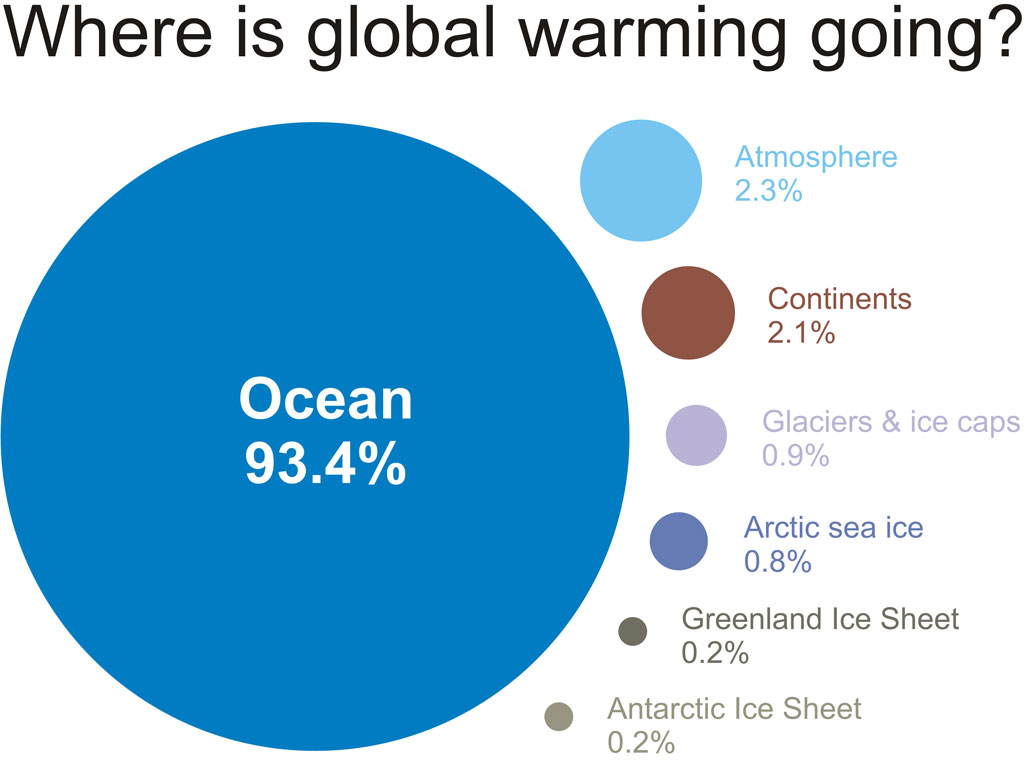
Figure 2: Components of global warming for the period 1993 to 2003 calculated from IPCC AR4 5.2.2.3.
Nuccitelli et al. (2012) considered the warming of the oceans (both shallow and deep), land, atmosphere, and ice, and showed that global warming has not slowed in recent years (Figure 3).
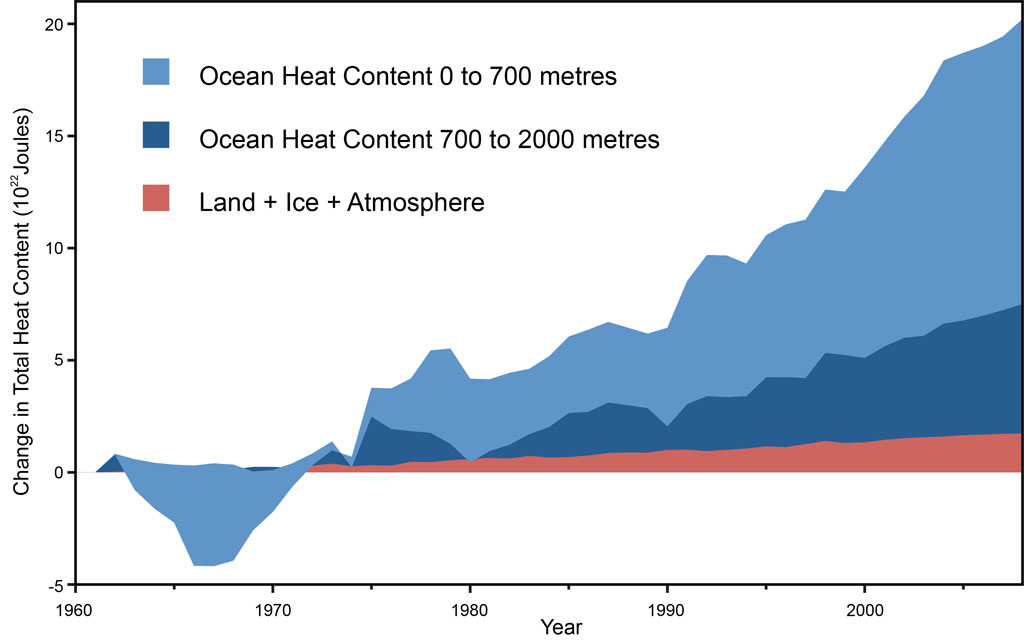 Figure 3: Land, atmosphere, and ice heating (red), 0-700 meter OHC increase (light blue), 700-2,000 meter OHC increase (dark blue). From Nuccitelli et al. (2012).
References
- Foster and Rahmstorf (2011), Global temperature evolution 1979–2010 doi:10.1088/1748-9326/6/4/044022
- Nuccitelli et al. (2012) Comment on Ocean heat content and Earth's radiation imbalance. II. Relation to climate shifts doi:10.1016/j.physleta.2012.10.010
Credits: Calculations and video: Kevin C. Voiceover: Daniel Bailey. Advice: The SkS team.
Intermediate rebuttal written by Kevin C
Update July 2015:
Here is a related lecture-video from Denial101x - Making Sense of Climate Science Denial
Last updated on 9 July 2015 by pattimer. View Archives


While limited to annual data and finishing at 2010, the model shows the same slowdown post 1998, and for the same reason as in the video - the trend in ENSO. In fact the ENSO term is almost identical (marginally larger) to the value used in the video. This very simple model (20-30 lines of R or python) gives a very good fit of temperature from forcing and ENSO without invoking any multidecadal oscillations with an R2 or 92%. On the basis of this analysis at least there is no justification for invoking longer term climate cycles. That would seem to settle the issue, however the case isn't completely closed. The result does depend on the choice of forcings. If instead you use the Potsdam forcings, the ENSO term is the same so the conclusions of the video are unaffected, but there is room for a small contribution from a multidecadal oscillation. I've been looking into the differences in forcings and understand some of the issues, but there are others I need to track down. One other slight complication - there was a slight reduction in the forcing trend in the early '90s, I believe related to the phaseout of CFCs. That should also produce a slight change in temperature trend. But it's probably too small to detect over a 20 year period.
As I understand it, aerosols include particulate matter. Over the past couple of weeks we have seen news about air pollution in China as they close down factories and limit automobiles in the capital. Today, Japan is complaining about the air pollution coming over from China. How much of the aerosol load which is wafted up into the atmosphere is from this source and do we have any information on whether the load of aerosols in the upper atmosphere has been increasing along with China's increased manufacturing. I have heard an estimate that if we stoped the production of all aerosols, we might have as much as a 20C rise in temperature. A sobering thought if China (and the rest of us) cleaned up our act. Was the temporary flattening of the temperature record following the 40's due to American air pollution which they then cleaned up,
http://www.aip.org/history/climate/aerosol.htm
Yes, it seems probably that the aerosol cooling effect has been increasing. Unfortunately the effect is geographically dependent and not well measured.
The point of the video is that at this point I don't think we can detect that effect in the instrumental temperature record with any confidence. (There's an update coming which will show a small change, but still in the noise range.)
Another factor, or maybe a subset of the ocean heat uptake, is the meting of the Arctic Ice. It is noteworthy that the ice melt has speeddecades once 2001. I have calculated that some 10^21 Joules have gone into melting the ice since 1997. http://greenerblog.blogspot.co.uk/2013/07/how-much-heat-has-gone-into-melting.html
Richard, your estimate looks good.
Skeptical Science have used 0.5 W/m^2 as the energy imbalance for Earth... this is the energy going into heating the planet. At 5.1e14 m^2 for Earth's surface, and 3.15e7 sec per year. and for a 16 year period of time, you have about 1.3e23 J of energy heating the Earth. Using 0.8% of this into Arctic Sea ice (from the diagram above) this corresponds to 10^21 J. Same as you have calculated.
Thanks Sylas. So is it possible and/or justifiable to calculate the surface heating that would have taken place had that 10^21 J gone into warming the atmosphere instead of into melting Arctic ice?
Richard... yes, sort of... though it doesn't mean much. The Earth is heating up, and most of the absorbed energy goes into heating the ocean. According to the figures; 93.4% of it. Of the rest, 2.1% is taken up as heating of continents, and 0.8% is taken up as melting Arctic sea ice. So you can divy up those numbers in various ways. I don't recommend it; it muddles much more than it reveals.
If the sea ice wasn't there to be melted, then everything changes; because it's a complex interacting system we are considering. For example, the loss of sea ice in summer is a significant feedback that contributes to the magnitude of all changes. You could consider a conterfactual in which melting ice isn't particularly endothermic, so that no energy was taken up, any excess energy would be taken up mostly in the ocean; meaning very little difference in land temperatures. We already know that when there's excess energy around, it goes mostly into the ocean.
The other issue is that temperature is not heat.
The temperature we get to is not determined by heat capcities; but simply by what temperatures will bring radiation emitted into balance with radiation absorbed. Heat capacities -- and the absorbing of excess energy -- is part of the process of getting back into balance.. and this is about how long it will take for temperature to stablize for a given atmosphere or forcing.
The energy figures are not really about temperature, but about the imbalance and the time it will take to get to balance again.... whatever temperature that happens to be. Getting rid of the capacity of melting ice to absorb heat would mean only we get to equilibrium temperature a tiny little bit faster. It makes no difference to the temperature we actually reach.
[JH] I deleted your duplicate post of the above.
But it may affect the *rate* at which we increase global surface temperatures.
It is clear that energy is taken up by melting Arctic ice. I am not quite clear as to whether this is already accounted for in calculations of ocean heat content, or is it additional to OHC?
If it is additional, what proportion of the forcing has gone into melting Arctic ice? Could it be a significant co-factor in the slowed rate of increase in land surface temperatures over the last decade?
There now follows my attempt to answer this question. It comes with health warnings, as I am not a physicist, and am not even very confident with exponentials, so my conclusions may be way out.
Over 10 years 2002-2912, 10 e21 Joules have been absorbed into the Arctic ice melt.
So each year, 10e20 Joules were absorbed.
Since there are 3.15 x 10 e7 seconds in a year, that is equivalent to 3 x 10 e13 Joules per second, in other words, 3 x 10 e13 watts go to melt the ice.
The earth's surface is 5.1 e 14 square metres. Therefore the quantity of watts per square metre relating to Arctic ice melt is about 6 e-2, or 0.06 w/m2
The current level of radiative forcing due to GHGs, according to the IPCC AR4, is 1.6 watts per square meter (with a range of uncertainty from 0.6 to 2.4).
Therefore the effect of the Arctic ice melt is to reduce the effectiveness of the radiative forcing due to enhanced greenhouse gases by 3.75% (range 2.5 - 10%).
If this calculation is correct, it would seem therefore that the Arctic ice melt, if it is indeed not already accounted for in the OHC figure, is a significant component of the reduction in the rate of surface warming, and very significant al lower estimates of GHG forcing.
If all planetary ice losses (from glaciers, Greenland, and the Antarctic) were included, the contribution would be even more significant.
Richard Lawson @11, by my calculation you misplaced a decimal point when converting from Joules per annum to Joules per second (Watts). The correct value for the full caculation is 0.006 W/m^2 of energy used in ice melt given your initial values. That is approximatly 1% of the TOA energy imbalance.
Thanks Tom. And, having now read Church et al 2011, I see that they included all ice melting energy in their calculations, so it seems I was on a wild goose chase. Apologies.
The article claims that the temperature of this blue planet has not increased for the past 16 years. Also they came up with some evidences to shows what has influenced the recent temperature trend like less solar energy and the El Niño oscillation. All evidence looks to flow in the same direction......good claims and perfect evidence, but it is opposite with what I have learned to be so far. I thought human activities should be the primary causes that have led this world to what we are experincing nowadays?
(p.s. I'm just a high school student so, sorry for my doubt XD)
Thank you for your respond!
Pacharaporn K @ post 15 , the article indicates that our planet continued to warm during the "16 years" (16 years up to May 2013).
Please note that the article is now nearly 5 years old. The SkepticalScience website is managed by a small group of volunteers (and is not supported by money from governments or even the Oil Industry). So the large numbers of articles here are often not kept up-to-date. However, you will keep up-to-date about climate news, if you frequently view the Home Page, where new articles and news links are mentioned daily or weekly.
The evidence for the continued warming of our planet (even during the "16 years") is :-
(A) measurements show that the ocean continues to warm, as shown by the continued increase in OHC [Ocean Heat Content],
(B) the continued presence of excessive CO2 gas in the atmosphere, is showing that there is no reduction in the Greenhouse Effect (and so there cannot be a real pause in short-term and long-term warming),
(C) the continued melting of planetary ice [glaciers and ice-sheets on land],
(D) the continued rising of sea-level (from melted land ice, and from thermal expansion of sea water),
(E) the important "surface temperature" (where we humans and animals and plants are living) shows continued warming during every 30-year period [climate changes are measured over a 30-year minimum period]. Therefore any short-term period (such as 8 or 16 years) with a pause or decline in surface temperature . . . is not important and does not show any significance — unless a real cause is found for reduced warming (for example: a very large volcano eruption, or a sudden very large rise in industrial aerosols which reflect sunlight).
You will notice that after 2013 came the much hotter years 2014, 2015, 2016, and 2017 . . . where global land and ocean surface temperatures were very evident (as measured by the American NASA and NOAA [U.S. National Oceanic and Atmospheric Administration] and by the Japan Meteorological Agency and by many other national agencies around the world).
The planetary surface temperature has reduced very slowly over the last 5,000 years. But it has not reduced as fast as expected, because humans have caused a small amount of warming force by clearing forests for cereals agriculture and also by (methane gas production from) rice paddies. And now for the past 100 - 200 years, the burning of coal and petroleum oil has produced a strong and rapid reversal of the long-term natural cooling cycle. Big changes are coming — and most of them will be bad for the world and human societies.