


 Arguments


NOAA State of the Climate report: Which seven records were broken in 2014?
Posted on 21 July 2015 by Guest Author
This is a re-post from Carbon Brief by Robert McSweeney
From greenhouse gas levels to ocean heat content, 2014 was a record-breaking year for the Earth system in many different ways. That's the finding of the latest State of the Climate report from the US National Oceanic and Atmospheric Administration's (NOAA) published today.
Now in its 25th year, the report provides a checkup of global climate using data collected from land, sea, ice and space. We take a look at seven of the records that tumbled last year.
Greenhouse gases
All the major greenhouse gases in the atmosphere, including carbon dioxide, methane and nitrous oxide, hit record high average concentrations last year.
After briefly passing 400ppm in May 2013, carbon dioxide levels at Mauna Loa in Hawaii stayed above this mark for the whole of April, May and June in 2014, the report says. Globally, 1.9ppm of carbon dioxide was added to the atmosphere in 2014, taking the average for the year to 397.2ppm.
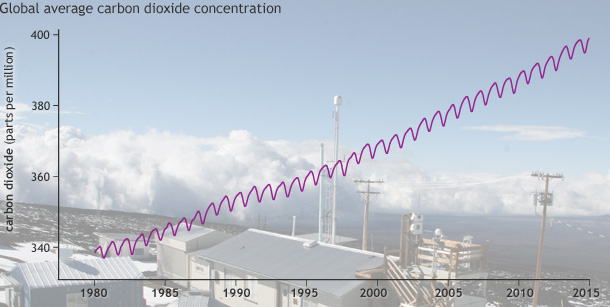
Global average carbon dioxide concentrations since 1980, with photo of Mauna Loa Observatory in background. Adapted from Figure 2.36 in State of the Climate in 2014
Concentrations of methane in the Earth's atmosphere reached 1822.9 parts per billion (ppb) in 2014. This increase of 9.2ppb from 2013 is larger than in recent years, the report says. The average levels of nitrous oxide in 2014 was 326.9ppb, an increase of 1.0ppb from 2013. This is faster than the average year-on-year increase over the decade (0.75ppb per year).
Hottest year
As was widely covered in the media, 2014 saw the highest annual average global surface temperature since records began, the report says:
"The year 2014 was forecast to be a warm year, and it was by all accounts a very warm year, in fact record warm according to four independent observational datasets."
Three of the four datasets put 2014 as the hottest year, while the UK Met Office put it joint top with 2010. The four estimates put 2014 at 0.27-0.29C above the 1981-2010 average.
The map below shows how this warmth differed regionally. Europe saw its warmest year on record, as did Mexico, while 2014 was second-warmest in Argentina and Uruguay, and third warmest in Australia. Much of Asia and Africa also saw above-average temperatures, the report says. Eastern North America was the only major region to observe a below-average annual temperature.
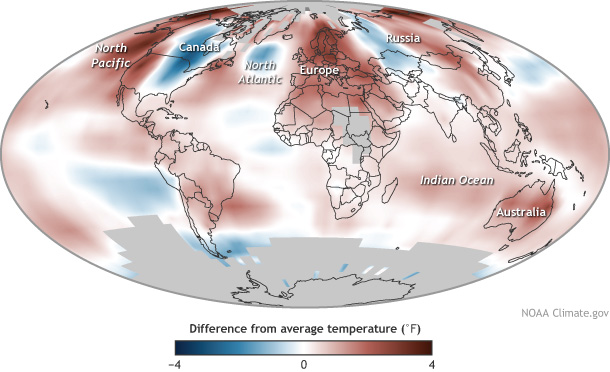
Average temperature in 2014 compared to the 1981-2010 average. Adapted from Plate 2.1c inState of the Climate in 2014
Record sea surface temperatures
The report summarises the year for the Earth's oceans in an unconventional manner - with a haiku:
"Not quite El Niño,
North Oceans' fluxes, warmth shift,
dance with weird weather."
The "not quite" El Niño refers to the global climatic phenomenon that kept scientists on their toes throughout 2014. While conditions in the Pacific Ocean looked ripe for an event to develop, they stayed on the cusp for much of the year, before an event started to emerge at the end of the year. Scientists now expect this El Niño will develop into a significant event in 2015.
But despite a faltering El Niño, the average global sea surface temperature was still the highest on record, the NOAA report says. As you can see in the map below, very warm temperatures were recorded in the central and northeast Pacific, and the western Atlantic.
"The Blob" of warm water in the northwest Pacific has been connected by some scientists to the extended drought in California and the cold temperatures in the eastern US.
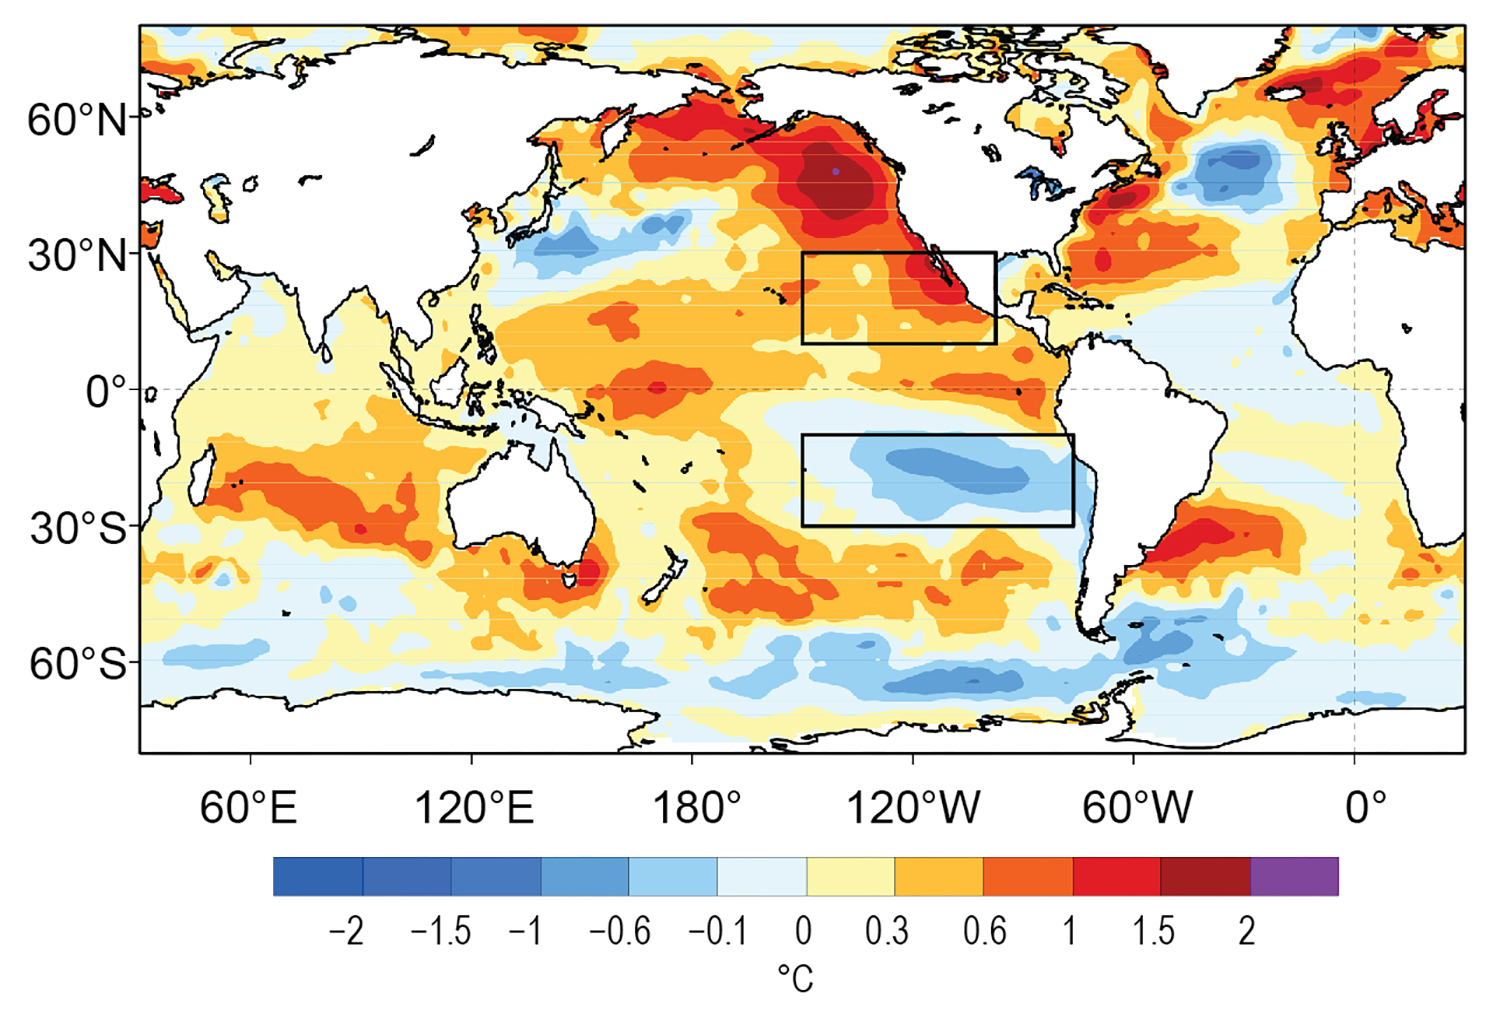
2014 average sea surface temperature, relative to the 1981-2010 average. Image courtesy: American Meteorological Society.
Record ocean heat content
It wasn't just the surface of the oceans that had a warm year, the report finds. Measurements over the top 700m of the ocean show that 2014 was also a record year for the amount of heat stored in the ocean.
This reflects the continued increase of energy in the oceans, which absorb over 90% of the heat trapped in the atmosphere by greenhouse gases, the report says.
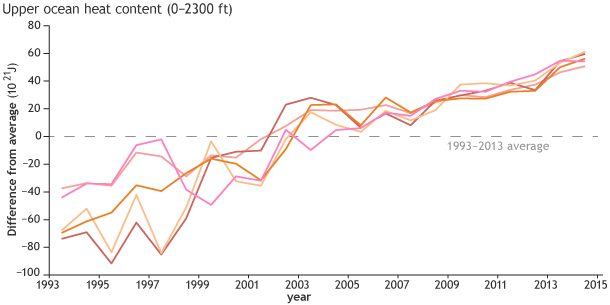
Ocean heat content each year since 1993 compared to the 1993-2013 average (dashed line) from a variety of data sources. Graph adapted from Figure 3.7 in State of the Climate in 2014
Record sea levels
With the oceans warming up, it's no surprise that 2014 was also a record year for global sea levels. Several different components contribute to rising sea levels rise, including water expanding as it warms, melting glaciers and ice sheets, and changes to how much water is stored on land.
Global average sea levels have risen by around 3.2mm per year since satellite measurements began in 1993, the report says, with sea levels around 67mm higher in 2014 than they were in 1993. You can see this in the graph below.
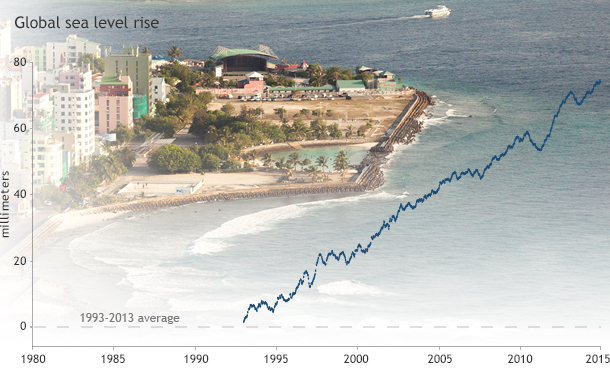
Global sea level each year since 1993 compared to the 1993-2013 average (dashed line). Graph adapted from Plate 1.1x in State of the Climate in 2014
Greenland ice sheet albedo
The warm year saw the Greenland ice sheet experience above average melting for 90% of the "melt season", the report says.
This contributed to Greenland setting a new August record for low albedo - a measure of how much of the sun's energy that is reflected by a surface. A bright white sheet of ice generally has a high albedo, but melting makes the surface darker and less able to reflect away the Sun's energy.
Scientists began taking records of albedo on Greenland in 2000, and 2014 saw the record low for August and the second lowest average albedo for the summer, which you can see in the graphs below.
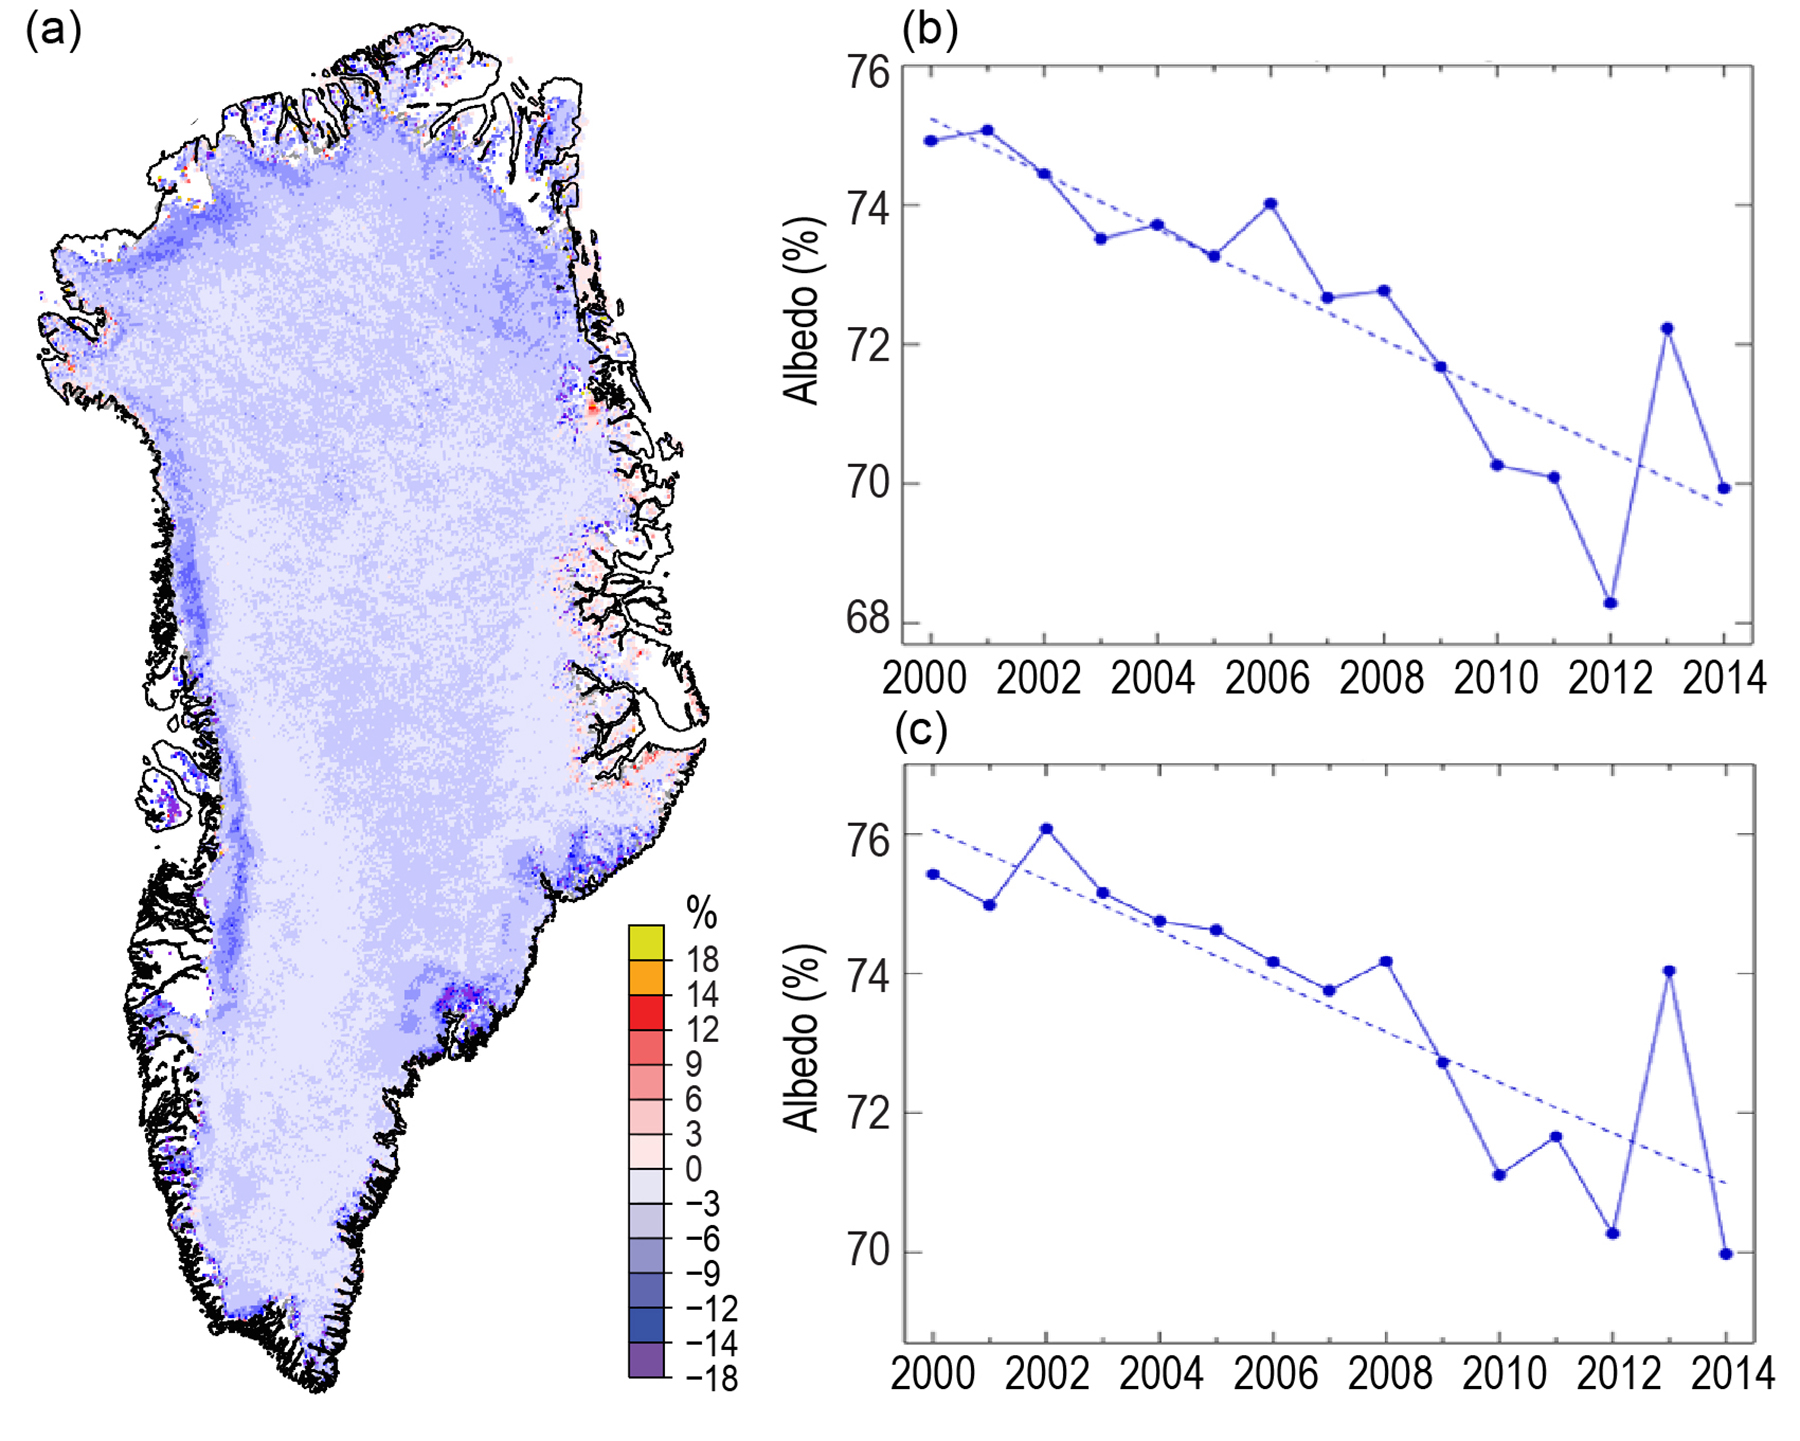
a) Map of Greenland Ice Sheet surface albedo for summer (June to August) 2014, relative to the summer average 2000-2011, b) Average surface albedo of the whole ice sheet each summer since 2000, and c) Average surface albedo of the ice sheet each August since 2000. Image courtesy: American Meteorological Society.
Antarctic sea ice
While Greenland was setting records linked to melting, another was being set around the chilly mass of Antarctica, which saw a new highest daily sea ice extent. On 20 September, sea ice hit 20.1m square kilometers, as the image below shows. This topped the previous record set in 2013 and all other years since satellite measurements began in 1979. Last year also saw a new record for highest average extent from April to September.
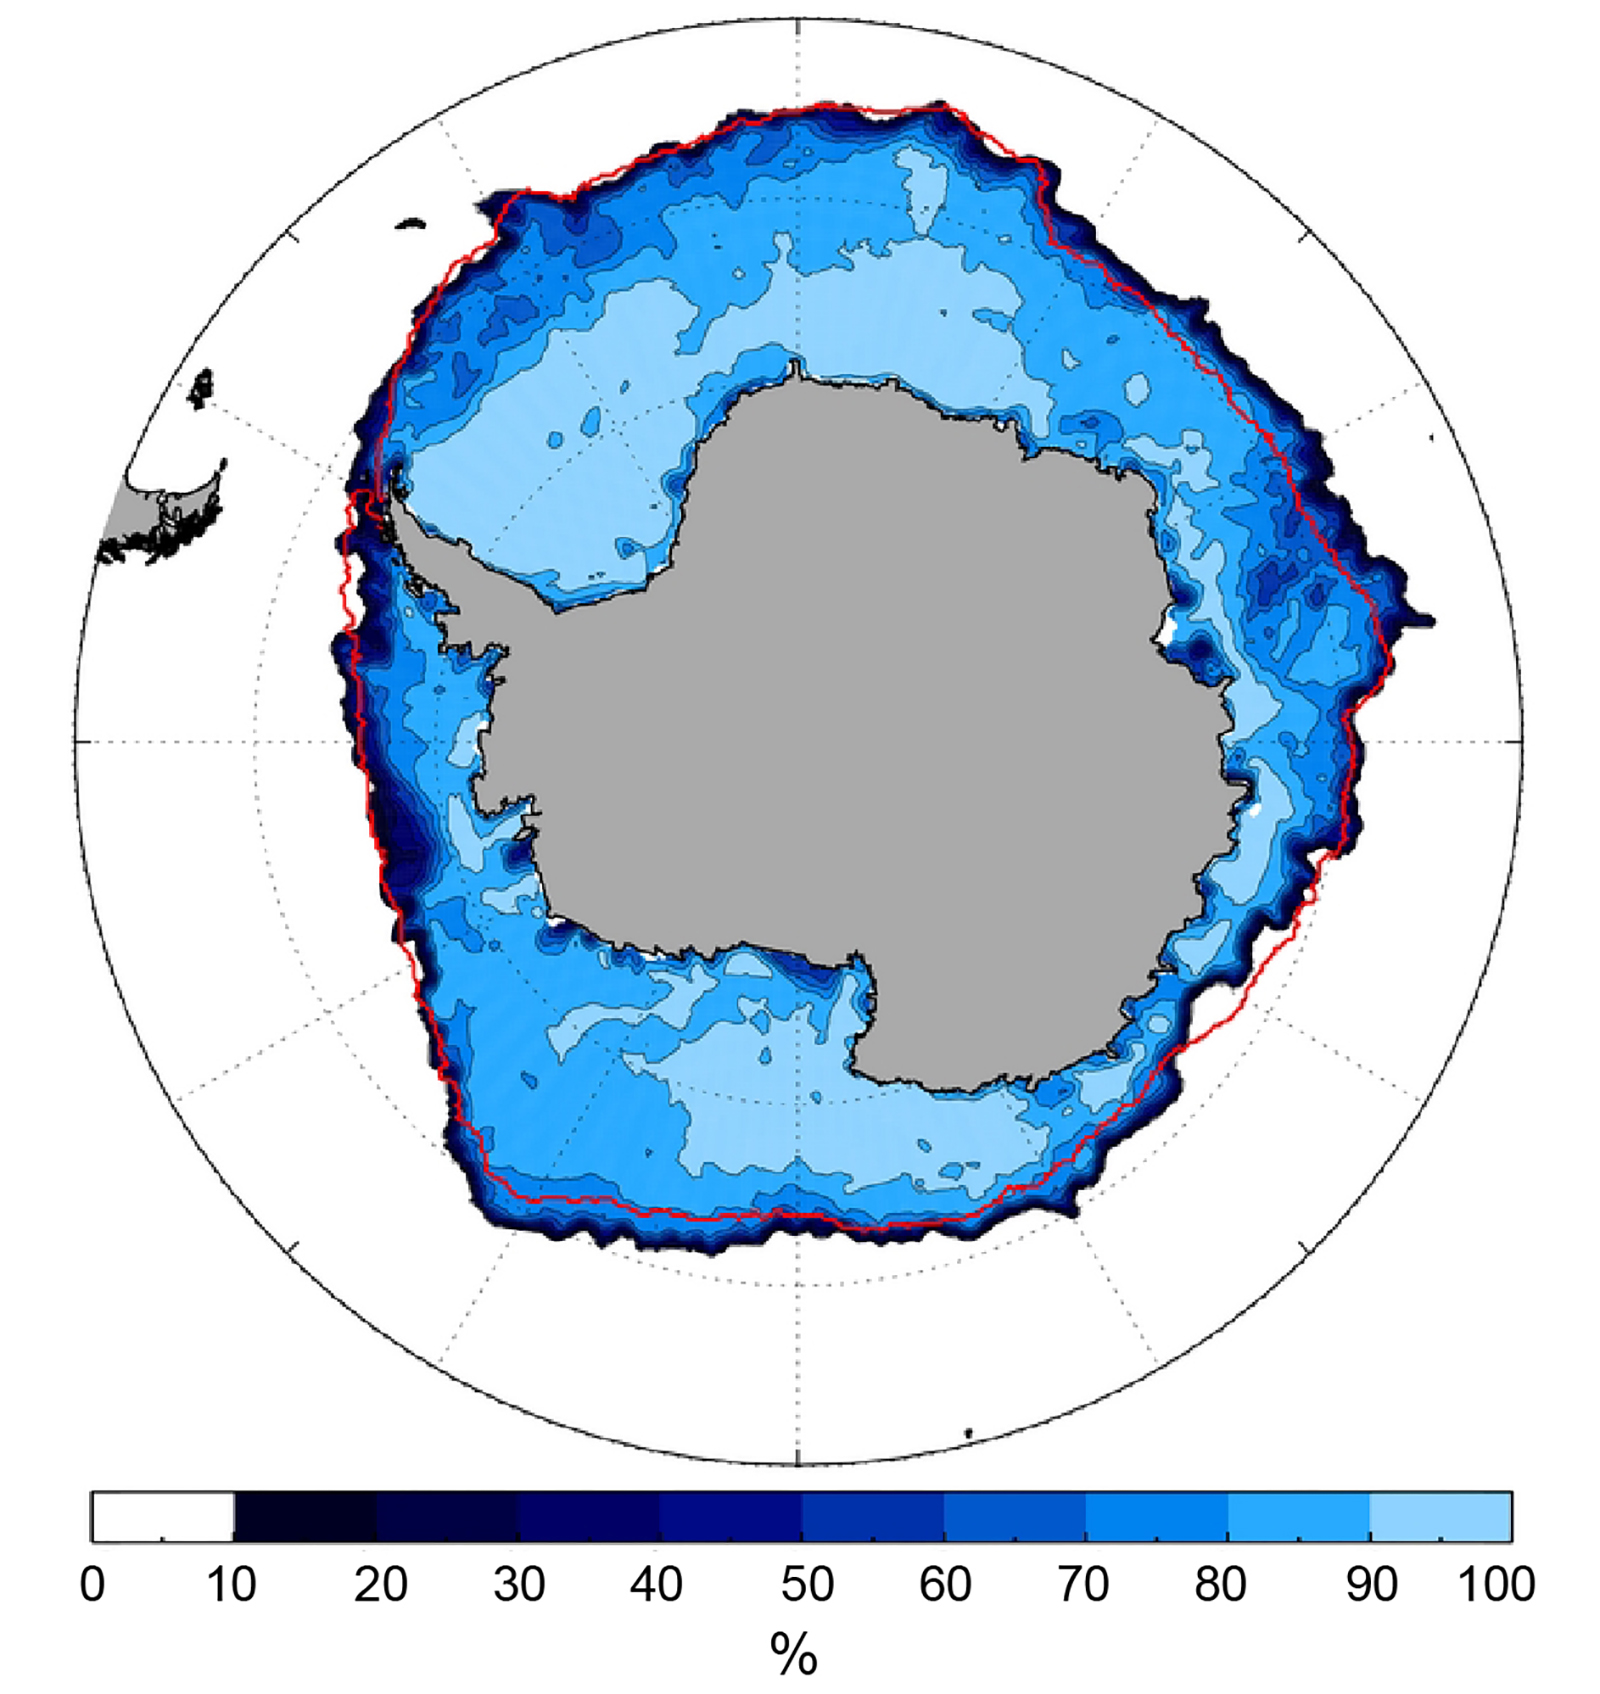
Antarctica sea ice extent on 20 September 2014. The red line shows the 1981-2010 daily average sea ice extent for that date. Image courtesy: American Meteorological Society.
The NOAA report dedicates a specific section of the report to discussing Antarctic sea ice extent, which has seen records of high extent broken for three years in a row.
The report says the high amounts of sea ice are predominantly a result of changing wind patterns. As Carbon Brief discussed in an article last year, Antarctic sea-ice isn't surrounded by land like the Arctic, so there's nothing to prevent winds blowing ice out to sea. As the sea-ice moves away from the land, it exposes open water, which then freezes, allowing the sea-ice to grow.
But working out the how the atmosphere, ocean, and ice interact to cause changes in Antarctic sea ice is complicated, the NOAA report says. And there's no one underlying reason that explains these records.
A closing haiku
As the report tops over 250 pages, this is just a snapshot of what it contains. But the report shows that 2014 was a standout year for many different aspects of our climate. As for how 2014 fits in with longer-term changes, the report turns to poetry again to sum up what the future has in store for the oceans:
"Seas warm, ice caps melt,
waters rise, sour, rains shift salt,
unceasing, worldwide."
Blunden, J. and Arndt, D. S. Eds. ( 2015) State of the Climate in 2014. Bulletin of the American Meteorological Society, 96 (7), S1- S267.


It looks like there's a problem with the sea-level graph. If I'm reading it right, then every year from 1993 on was above the 1993-2013 average? What did they use to calculate the average?
Looks to me as if the graphic placed here is mislabeled from Plate 1.1x (p. 53). The graphic there starts from 0. That is, it shows sea level rise starting with 1993 as the zero point. Baseline periods in other graphics are given in parentheses but for 1.1x the parentheses state "actual values".
Needs a labeling fix here, I think.
What you want is this:
[DB] Reduced image width that was breaking page formatting.
The graphic discussed @1 to 3 came from this NOAA web page and, as the caption there now reads, the graphic's datum should have read (and now does read) "1993 average" not the un-corrected "1993-2013 average" as in the post above.