


 Arguments


The oceans are warming faster than climate models predicted
Posted on 20 July 2015 by John Abraham
As I have said many times on this blog, if you want to know how much “global warming” is happening, you really have to be able to measure “ocean warming”. That is because more than 90% of the excess energy coming to the Earth from greenhouse gases goes into the ocean waters. My colleagues and I have a new publication, which better characterizes this heating and also compares climate model predictions with actual measurements. It turns out models have under-predicted ocean warming over the past few decades.
But how would you measure the ocean? How would you make consistent, long-term measurements that would allow people to compare ocean heat from decades ago to today? How would you make enough measurements throughout the ocean so that we have a true global picture?
This is one of the most challenging problems in climate science, and one that my colleagues and I are working hard on. We look throughout measurement history; first measurements were made with canvas buckets, then insulated buckets, and other more progressively complex devices. Many measurements were made along ocean passageways as ships transported goods across the planet.
As more ship travel occurred, and more measurements were made, the coverage of temperature measurements across the globe increased. So, over time, we say the temporal and spatial resolution increased. As these changes occurred, you have to be careful that any trend you see isn’t just an artifact of the resolution or the instrument accuracy.
We also pay attention on one particularly important measurement device called the eXpendable BathyThermograph (XBT). This device, originally designed to make crude measurements for navies, has been used for years by climate scientists. There is systematic bias in XBT data, which creates spurious “ocean warm decades” from 1970s to early 1980s as reported in the IPCC Fourth Assessment Report.
What my colleagues determined was that we could reduce past errors in the ocean heat content (OHC) record by correcting systematic measurement biases, filling in gaps where no information is available, and by choosing a proper comparison climate. This new paper doesn’t solve all of the OHC issues, but it makes a great stride in clearing up past questions.
Lead author, Dr. Lijing Cheng (who works for the International Center for Climate and Environment Sciences in China) applied four separate improvements to data. He focused his attention on the heating in the upper 700 meters of ocean waters because that depth has the best measurements and it also is the region where much of the global warming heat goes.
Going back to 1970, we find that the upper 700-meter water layer temperature has increased approximately 0.3°C (approximately 0.55°F). While that may not sound like a lot, we have to remember this is a huge amount of water and consequently it requires an enormous amount of energy.
We separated the world’s oceans into the Atlantic, Pacific, and Indian. All three of these oceans are warming with the Atlantic warming the most. We also calculated the ocean heating by using 40 state-of-the-art climate models. Over the period from 1970, the climate models have under-predicted the warming by 15%.
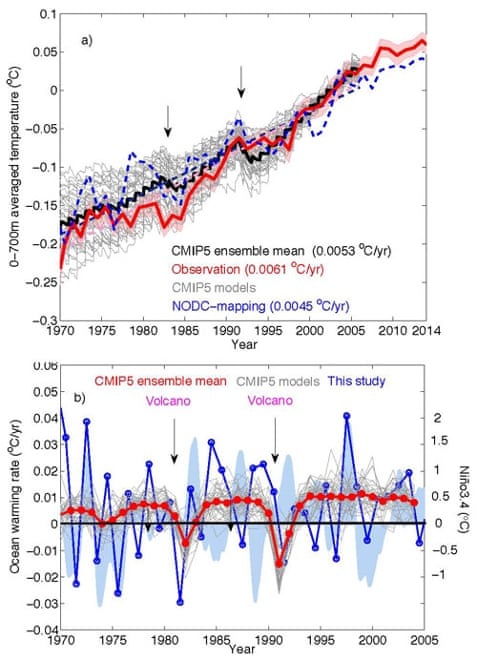
(a) Upper (0–700 m) OHC, calculated using 40 Coupled Model Intercomparison Project, Phase 5 (CMIP5) models (historical run) (gray lines; black line is the ensemble mean). The CMIP5 results are compared with the observation-based estimate using the strategies presented in this study (red line) and National Oceanographic Data Center (NODC) mapping (dashed blue line). Two major volcanic eruptions are marked by the black arrows. (b) Annual global-averaged upper ocean warming rates from the CMIP5 model results (gray lines; red line is the ensemble mean) and from observations (blue line), computed from the first differences of OHC at 700 m (units: °C yr−1). Source: Institute for Atmospheric Physics.
A remarkably close match that gives us a lot of confidence in the models. On the other hand, the models were not able to predict shorter-term fluctuations in ocean heating contained within the observed time period.
My colleague Dr. Cheng summarized the work by saying,


The warming of the Earth's ocean system is having multiple impacts on the planet's biosystem. For example...
Ocean acidification may cause dramatic changes to phytoplankton by Jennifer Chu, MIT News Office, July 20, 2015
John@1,
You took this from my mouth. While the isotherm migration e.g. shown nicely as PDF graph in this study, is overall about the same, even slightly slower over ocean, your study gives the examples of much bigger, in some cases dramatic changes in the entire food chain due to small crustations dying or migrating as the result of OA.
No surprises here. While ocean helps to cool down the surface temperature by absorbing signifficant amount of human CO2, the ocean ecosystems pay the double price of not only warming but also acidification. While some people, especially those who are fixated on "2 degree warming target" are happy because they can pollute a bit more because of CO2 invasion into ocean, the big picture might look even bleaker as the result of that phenomenon - dramatic distortions in the food chain.
I just watched a European public channel where they claimed that the current uptake of the oceans - and within the equalisation of the heating - could soon have an end and fire back. Are you aware of any studies that would be indicating this?
Sorry for being lazy now doing my own research. But nevertheless, I think this is an issue of importance concerning surface temperatures sky rocketing again (the 'hiatus' which has actually never happened).
Thanks, folks.