


 Arguments


Otto and Donat Weigh in on Human Contributions to Extreme Heat
Posted on 19 September 2012 by dana1981
In Hansen's New Climate Dice - Hot, Loaded, and Misunderstood, we examined Hansen et al. (2012), which investigated how human-caused global warming has shifted temperature distributions and made extreme heat events more likely to occur. In that post, we also briefly looked at two complementary papers, Donat and Alexander 2012 (DA12) and Otto et al. (2012). Like Hansen's paper, DA12 examined changing temperature distributions, while Otto et al. examined whether the 2010 extreme Russian heat wave could be attributed to human influences. In this post we will examine these two papers in greater depth.
Donat and Alexander on Shifting Temperature Distributions
DA12 used HadGHCND, a global gridded data set of observed near-surface daily minimum and maximum temperatures from weather stations, available from 1951 and updated to 2010. Using this dataset, DA12 calculated probability distribution functions using daily temperature anomalies for 1951–1980 and 1981–2010. They then calculated the frequency of temperature anomaly ranges by using bin widths of 0.5°C and binning counts of temperature anomalies between -25 and +25°C.
DA12 first investigated how the temperature distribution mean, variance, and skewness (asymmetry) have changed between the two 30-year periods geographically, for both minimum and maximum temperatures (Figure 1).
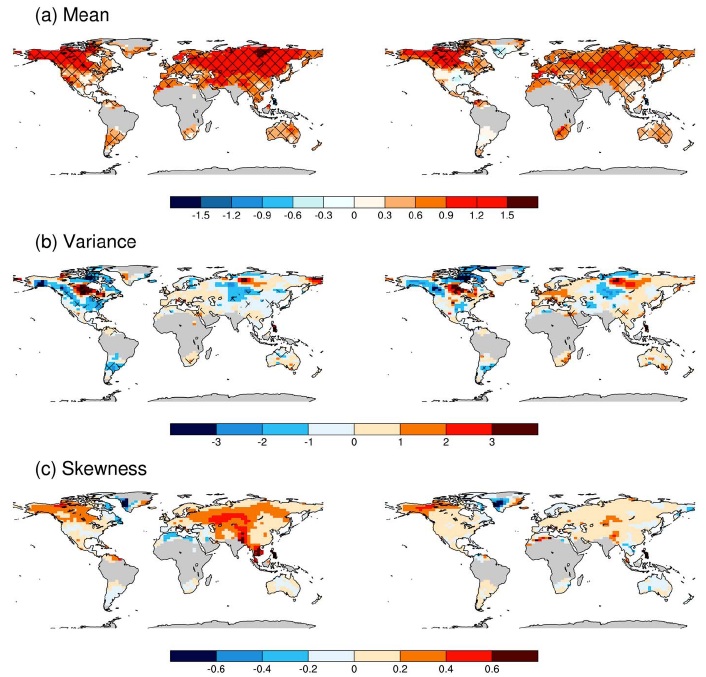
Figure 1: The differences in higher moment statistics of (a) mean, (b) variance, and (c) skewness for each grid box in HadGHCND for (left) daily minimum temperature anomalies and (right) daily maximum temperature anomalies for the two time periods shown. Hatching indicates changes between the two periods that are significant at the 10% level for the mean (using a Student’s t-test) and the variance (using an f-test) of the distribution. From Donat and Alexander 2012.
DA12 found that the distributions of both minimum and maximum temperatures have shifted towards warming temperatures almost everywhere on the planet. They also found that in most regions, the skewness of the distribution has shifted towards hotter temperatures (Figure 2). However, the change in variance in the data is less geographically consistent.
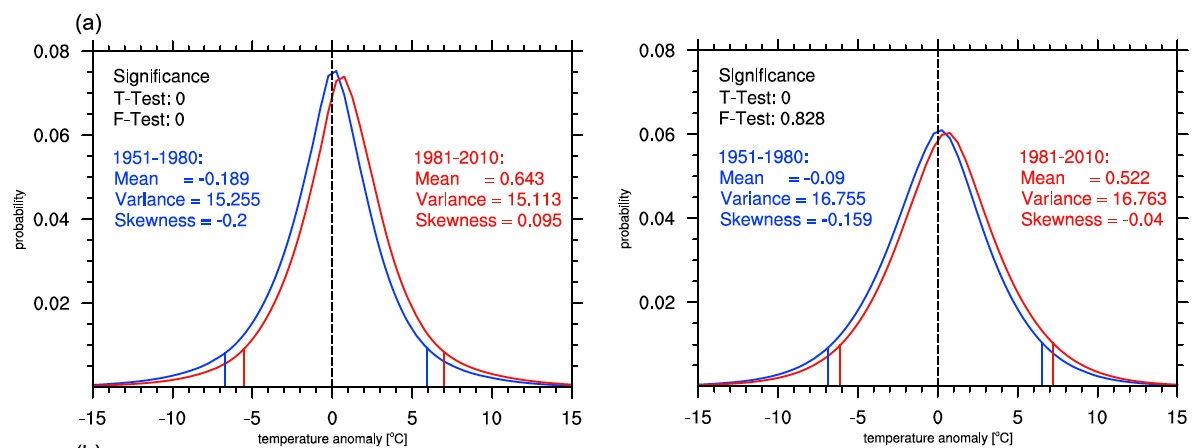
Figure 2: Probability density functions for two periods 1951–1980 (blue) and 1981–2010 (red) of anomalies of (left) daily minimum temperature and (right) daily maximum temperature. Statistics related to the shape, scale and location parameters are also shown. The distribution functions are presented for the globe. The vertical lines represent the 5th and 95th percentiles of the respective distribution. Figure 2a from Donat and Alexander 2012.
Like Hansen et al., the authors found that the shifting temperature distribution has made extreme heat waves much more likely to occur now than in the middle of the 20th Century (emphasis added):
"This increases extreme temperatures in such a way that the 95th percentile of the first period is the 92.7th percentile of the second period (i.e., there is a 40% increase in more recent decades in the number of extreme temperatures defined by the warmest 5% of the 1951–1980 distribution)."
As we discussed regarding Hansen's paper, it was not clear whether the increased frequency of extreme heat events is due more to increased tempeature variability, to the warmer shift in average temperatures, or to increased skewness in the temperature distribution. In any case, the change is human-caused, but the precise technical and statistical explanation for the change was unclear.
DA12 did not find strong evidence that temperatures have become more variable, but they did find that the distribution has become less symmetrical, because the extreme hot events are now more likely to occur than the extreme cold events.
"Using the data from this study we conclude that daily temperatures (both daytime and night-time) have indeed become 'more extreme' and that these changes are related to shifts in multiple aspects of the daily temperature distribution other than just changes in the mean. However evidence is less conclusive as to whether it has become 'more variable'."
Human Influence on the 2010 Russian Heat Wave
In his paper, Hansen touched on a few specific extreme heat events, one of them being the 2010 Russian heat wave:
"we can state, with a high degree of confidence, that extreme anomalies such as those in Texas and Oklahoma in 2011 and Moscow in 2010 were a consequence of global warming because their likelihood in the absence of global warming was exceedingly small."
The 2010 Russian heat wave was also previously investigated by Dole et al. (2011) and Rahmstorf and Coumou (2011). The conclusions of the two papers seemed contradictory - Dole et al. found:
"that the intense 2010 Russian heat wave was mainly due to natural internal atmospheric variability"
Whereas like Hansen et al., Rahmstorf and Coumou concluded that humans played a role in the Russian heat wave:
"For July temperature in Moscow, we estimate that the local warming trend has increased the number of records expected in the past decade fivefold, which implies an approximate 80% probability that the 2010 July heat record would not have occurred without climate warming."
However, Otto et al. note that these two conclusions are not necessarily contradictory, and can even be considered complementary.
First, Otto et al. examined the local temperature record in Western Russia and found from 1950 to 2009, it warmed 1.9 +/- 0.8 times the rate of global warming, with approximately 1°C local warming over that timeframe (Figure 3).
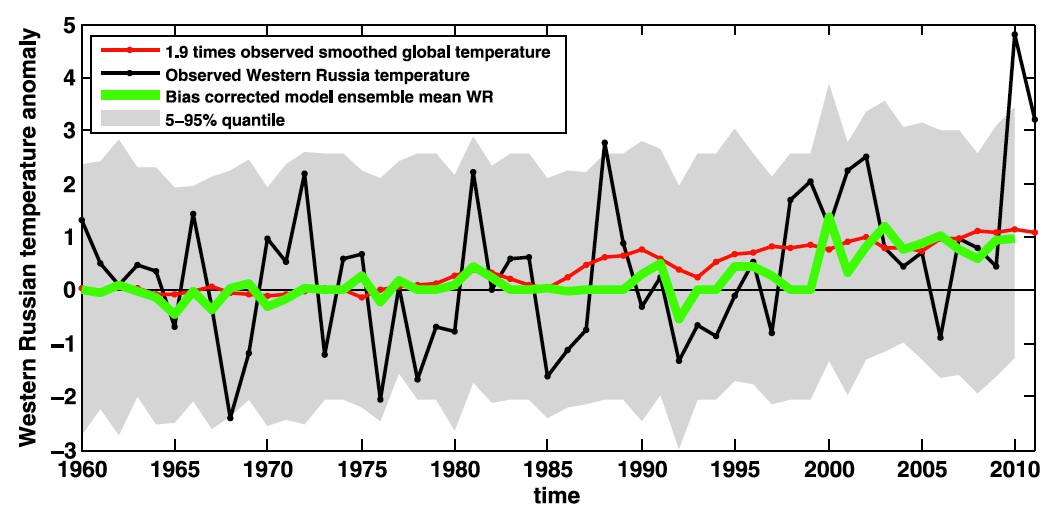
Figure 3: Modeled and observed temperature anomalies averaged over 50°–60°N, 35°–55°E. Also shown is the smoothed global mean temperature multiplied by the regression coefficient of Western Russian temperatures. The reference period is 1950–2009 for observed data and 1960–2009 for the model. Figure 1 in Otto et al. (2012).
Otto et al. then used use the global circulation model HadAM3P to simulate Russian temperature changes in order to determine how frequently extreme heat waves can be expected to occur during current hotter temperatures as opposed to the cooler 20th Century (Figure 4).
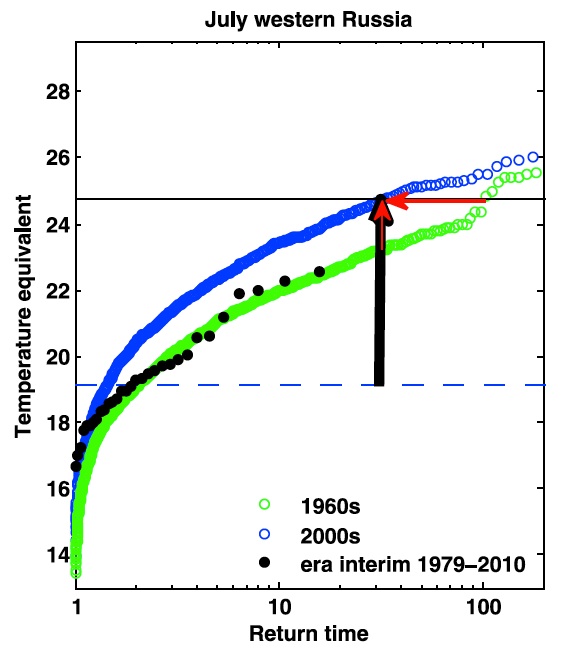
Figure 4: Return periods of temperature-geopotential height conditions in the model for the 1960s (green) and the 2000s (blue) and in ERA-Interim for 1979-2010 (black). The vertical black arrow shows the anomaly of the Russian heat wave 2010 (black horizontal line) compared to the July mean temperatures of the 1960s (dashed line). The vertical red arrow gives the increase in the magnitude of the heat wave due to the shift of the distribution whereas the horizontal red arrow shows the change in the return period. Figure 4 in Otto et al. (2012).
The "return time" on the Figure 4 x-axis tells us how frequently the model simulates that the temperatures on the y-axis will occur for 1960s Russian temperatures (green) and 2000s Russian temperatures (blue). So for example, in the 2000s a temperature equivalent of 24.5 occurs once every 33 years in the model.
The vertical black arrow shows the difference between the horizontal dashed blue line (average 1960s Russian temperature) and the horizontal black line (the 2010 Russian heat wave). The vertical red arrow shows the difference between modeled Russian temperature distributions in 1960 and 2010, the difference being primarily due to human-caused warming. And the horizontal red arrow shows the difference between the frequency that the 2010 Russian heat wave occurred during modeled 1960 and 2010 temperatures. Otto et al. draw two key conclusions about 2010 Russian heat wave from these data:
- The heat wave was not entirely or even mostly human-caused, because the vertical black arrow is much larger than the vertical red arrow. In this sense Dole et al. are right.
- The heat wave is now three times more likely to occur (now a 1-in-33 year event vs. a 1-in-99 year event in the 1960s). In this sense Hansen et al. and Rahmstorf and Coumou are correct.
So ultimately Otto et al. find that the conclusions of these papers are not contradictory, but complementary. While extreme heat events like the 2010 Russian event are by no means entirely human-caused, local and global warming have made them much more likely to occur. As Hansen et al. noted, due to the shifting temperature distributions also discussed by DA12, heat waves are now hotter and more frequent than they were last century.
While heat waves would of course naturally occur with or without human influences, we are adding to the heat, making them more likely to be record-breaking. This is also consistent with the results of Meehl (2009), who examined how the ratio of hot to cold records in the United States and found that more and more local heat records are being broken (Figure 5).

Figure 5: Ratio of record daily highs to record daily lows observed at about 1,800 weather stations in the 48 contiguous United States from January 1950 through September 2009. Each bar shows the proportion of record highs (red) to record lows (blue) for each decade. The 1960s and 1970s saw slightly more record daily lows than highs, but in the last 30 years record highs have increasingly predominated, with the ratio now about two-to-one for the 48 states as a whole.
What Does it All Mean?
Overall there is an increasing body of scientific literature finding that human-caused global warming is resulting in more and more extreme weather. The most intuitive consequence of global warming is the increase in extreme heat events. Hansen et al. (2012) and DA12 both found that temperature distributions have shifted towards hotter values, and DA12 shows that the increase in extreme heat events may be due to the distribution becoming less symmetrical rather than becoming more variable - in other words, not necessarily wider on both ends, but mostly wider on the hot end, meaning hot extremes are more likely to occur than cold extremes, as Meehl et al. (2009) found.
It is always a challenge to say whether any given extreme weather event is due to global warming, but Hansen et al., Rahmstorf and Coumou, and Otto et al. showed that the 2010 Russian heat wave was extremely unlikely to have been as blisteringly hot without human-caused global warming giving it a boost. There certainly would have been a 2010 Russian heat wave either way due to the weather patterns that year, but odds are it would not have been as extreme or record-breaking without human-caused global warming.
A similar argument can be made for many other extreme weather events, for example recent extreme heat in Texas and Oklahoma, as noted by Hansen et al. The bottom line is that human-caused global warming is giving the weather a warming boost, which means that we will continue to see more frequent and more intense, record-breaking heat waves and other extreme weather events all around the world as long as human-caused global warming continues unabated.
Extreme weather is coming to a theater near you. Be prepared.
Note: this post has been incorporated into the Intermediate rebuttal to Extreme weather isn't caused by global warming.


 0
0  0
0


Comments