


 Arguments


The Pacific Ocean fills in another piece of the global warming puzzle, and puzzles Curry
Posted on 3 September 2013 by dana1981
A new study published in the journal Nature incorporates temperature changes in the tropical Pacific Ocean into an advanced climate model, and finds that the model can reproduce observed global surface temperature changes remarkably well.
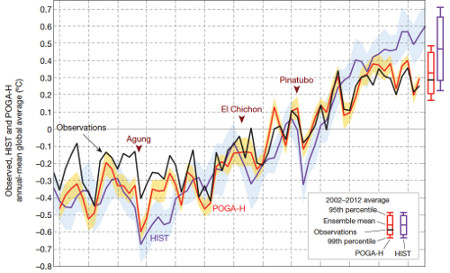
This graph shows the good match between temperatures in the Nature paper model (in red) and measured temperatures (in black). Just accounting for human and solar climate influences doesn't reproduce the recent surface warming slowdown (in purple).
Importantly, as authors Yu Kosaka and Shang-Ping Xie from the Scripps Institution of Oceanography explain, accounting for the changes in the Pacific Ocean allows the model to reproduce the slowed global surface warming over the past 15 years. It also accurately reproduces the regional and seasonal changes in surface temperatures, which adds confidence that their results are meaningful.
"Our results show that the current hiatus is part of natural climate variability, tied specifically to La-Niña-like decadal cooling … For the recent decade, the decrease in tropical Pacific sea surface temperature has lowered the global temperature by about 0.15 degrees Celsius compared to the 1990s".
Despite only covering 8.2 percent of the Earth's surface, these results suggest that the tropical Pacific Ocean plays a major role in short-term changes in the average global surface temperature. And over the past 15 years, it's offset most of the global surface warming from the increased greenhouse effect.
These results are broadly consistent with several other important recent papers investigating the role of the oceans in global warming. For example, the model used in this study finds that the overall heating of the planet has not slowed when the warming of the oceans are taken into account, as studies led by John Abraham, myself, and several others have also concluded.
Research led by Gerald Meehl has similarly focused on the importance of the Pacific Ocean in short-term global surface temperature changes. His climate model predicts that there will be decades when surface temperature changes are relatively flat because more heat is transferred to the deep oceans, precisely as we have observed over the past decade. Meehl discussed the Kosaka & Xie study with Carbon Brief,
"This paper basically confirms, with a novel methodology, what we originally documented in our Nature Climate Change paper in 2011 and followed up with in our Journal of Climate paper ... We went beyond [the new paper] to show that when the tropical Pacific was cool for a decade ... more heat is mixed into the deeper ocean, something the new paper doesn't address."
Kevin Trenberth, who co-authored several of these important ocean studies, has likewise pointed to the important role of the Pacific Ocean in transferring more heat to the deep oceans.
"The cause of the shift is a particular change in winds, especially in the Pacific Ocean where the subtropical trade winds have become noticeably stronger, changing ocean currents and providing a mechanism for heat to be carried down into the ocean. This is associated with weather patterns in the Pacific, which are in turn related to the La Niña phase of the El Niño phenomenon."
Research by Masahiro Watanabe of the Japanese Atmosphere and Ocean Research Institute has also suggested that the transfer of heat to the deep oceans and corresponding slowed global surface warming is related to changes in the Pacific.
Thus the scientific picture is becoming increasingly clear that the Pacific Ocean has played a large role in the slowed surface warming in recent years, but the warming of the oceans and planet as a whole have continued unabated. Thus the slowed surface warming is very likely to be a temporary effect, similar to the flat global surface temperatures between 1940 and 1970 when the Pacific Ocean was in another cool cycle.
Although it may be a natural reaction to hope that the recent slowed surface warming suggests that climate change isn't an imminent threat, the scientific evidence simply does not support such optimism. Climate scientist Judith Curry, who I recently criticized for failing to grasp the concept of climate risk management, recently articulated this rosy view on her blog. By focusing at the model simulation data specifically from 1975 to 1998, Curry incorrectly argued that the study supports the position that global warming is mostly natural.
There are a few major problems with this argument. Between 1975 and 1998 when the Pacific Ocean was in a warm phase of its cycle, it accounted for some of the observed global surface warming (though less than Curry asserts; about 30 percent). But the thing about cycles - they're cyclical. Focusing on the warm cycles while ignoring the cool cycles is an example of classic cherry picking.
If we look at the full record, for both 1950–2012 and 1970–2012 (the Pacific Ocean temperature data are most reliable since 1970), according to the model used in this study, the Pacific Ocean has actually had a slight overall cooling effect on global surface temperatures. It's also important to note that this cycle is just moving heat around between oceans and air - the overall warming of the planet has remained steady and rapid.


As I noted last week at Hot Whopper the authors did no favours for themselves or the interpretation of their paper by using the term "hiatus" without any prefacing modifiers.
It's important to emphasise that there is no hiatus in overall global heat accumulation - only a redistibution such that the surface of the planet manifests less of the overall heat accumulation. This is of course what Kosaka and Xie are describing, but the Denialati have run with the ambiguous phrasing and released their own twisted meme to the world whilst Precision stands waiting for Truth to finish lacing its boots so that the former personage can pull on its own footwear.
Hmm. That graph looks familiar. Where have I seen it before?
Oh yes. Here:
Their result is a good match for my toy 2-box+ENSO model from last year, but far more rigorous. Tamino has produced a very similar model.
You can play with it online here. It produces a good match for IPCC TCR estimates, but the results are of course totally controlled by the uncertainties in the forcings, so that doesn't prove anything. I think the Potsdam forcings omit 2nd AIE (is that in the glossary?), so you have to upweight AIE by 50%. What it does show is that curent forcing estimates can explain 20thC climate very well.
Yeah, there's quote mine gold here. I'm surprised "... the decrease in tropical Pacific sea surface temperature has lowered the global temperature by about 0.15 degrees Celsius compared to the 1990s" hasn't gotten ripped out of context and reposted on a bazillion blogs. Yet.
But as to the substance of the paper, climate contrarian Marcel Crok asked Xie for a response to Curry's analysis, which is now posted on Crok's blog "Staat van het Klimaat", which appears to be Dutch for "Look How Cold It Is!".
Short version, Xie agrees with Curry that recent warming was modulated by natural variability, but cautions that natural variability's ups and downs average out over long periods, and did not play the primary role in the century-scale warming trend.
Tamino has a post on this article wit ha little more technical detail.
@Kevin C:
While the Potsdam forcing might exclude the 2nd AIE (cloud lifetime effect), there is no strong evidence that it really matters. The Potsdam-AIE with default weighting corresponds almost perfectly with the current best estimate of the total AIE. What keeps puzzling me is why GISS assumes this rather constant aerosol forcing ramp up. That's very unlikely to be the case (see Skeie et al. 2011). I therefore strongly recommend to use the Potsdam forcing.
"Curry incorrectly argued that the study supports the position that global warming is mostly natural."
At a certain point it becomes difficult to believe that deniers are deluded enough to really mean the things they say.
The model incorporates warming from greenhouse gases. It finds that, to date, the overall impact of natural variations has been to mute the atmospheric warming from greenhouse gases by a very small amount. That directly contradicts the position Curry is taking. Or to quote the abstract;
"Although similar decadal hiatus events may occur in the future, the multi-decadal warming trend is very likely to continue with greenhouse gas increase."
How can Curry not know that her stated position on this is nonsense? It's like watching a video from space of the Earth spinning through the course of the day and then saying, 'This supports my position that the Earth is flat.' No... it really really doesn't, and anyone with even basic reading comprehension and reasoning skills can see that. So... what the hell?
K.a.r.S.t.e.N: That's interesting. The lower aerosol indirect contribution supports a slightly lower TCR, and leaves a little room for a long period oscillation such as the PDO.
Do you know if Piers Forster's forcings from the Otto et al paper are available? I'd like to compare them as well if possible, as it might shed some light on the different TCR estimates we are seeing at the moment.
(If not I guess I'll write to him)
The discussion or presentation of average global surface temperature in terms of "decadal" values may not be the most effective way of communicating the issue. "Decade-by-decade" presentations can play into the scams of those wanting to "delay” action that would reduce their ability to get more profit, pleasure, comfort, or convenience from burning fossil fuels (a practice that is not only creating costs future generations will face without having benefited from the burning but that is simply not sustainable by future generations because the fossil fuels become harder and harder to obtain and eventually would run-out).
“Scientific denial” is not the real problem. The real problem is the success of political efforts to “delay” popular support for actions that would limit the ability of people to get benefits from burning fossil fuels. Those efforts can continue to succeed by arguing that we need to wait for more proof. Claiming that 2000-2010 was the warmest decade to date only allows them to argue that though that may be the case the temperatures so far since 2010 are not higher so we need to wait until after 2020 before we can know more about the need to “start debating” how to reduce the burning of fossil fuels. And a person tending to want more personal benefit will easily consider that to be a reasonable claim, to delay the action that would reduce their potential for benefit.
Presenting the likely magnitude of variability of global average surface temperature due to the ENSO cycle along with the level of the ENSO at the time of a global average would reduce the ability to claim the “need to wait for more proof”. Another way to argue with the delayers would be to point out that until an El Nino event occurs that is as significant as the 1997-98 event they can make no claim regarding “any slowing or stopping that appears to have occurred since the last major El Nino”.
My guess is that Curry got too close to something that made her "terrified beyond the capacity for rational thought", probably at a subconscious level. She has a pattern of invoking the half of uncertainty that does not go there, or only seeing the half of the cycle that takes her farther from there. The simplest explanation I can think of for her illogical thinking is a subconscious filter on what she is able to incorporate into her world model.
No, I'm not a clinical psychologist; yes, I have a degree in the field. I know about enough to get myself into trouble. It fits what I learned in school, but I'm not qualified to do more than guess.
@Kevin C:
While TCR is indeed a bit lower (1.4K), the current warming seems to be slightly underestimated which leaves wiggle room for upward adjustments. So not much of a difference. The problem I see with the GISS forcing is that it can't be reconciled with the sulfate emission inventories at all. As sulfate aerosols are the most efficient cooling agent, a linear (negative) aerosol forcing ramp up appears extremely unlikely. Apart from Skeie et al. 2011, also Meinshausen et al. 2011 and Forster et al. 2013 seem to confirm this point of view. The fact that it reduces the correlation coefficient in the 2-box model is an interesting one, but nothing to be worried about. Plenty of options as to why that's the case. I might elaborate on that at the next opportunity (it's primarily a response time issue).
Just to make sure: What you refer to as "Potsdam forcing" is based on Meinshausen et al. 2011, or did I get that wrong? I guess, the Forster et al. 2013 forcing wouldn't actually be that much different. I am not aware of a readily accessible source for the forcing data. Apart from Piers, you may contact Alexander Otto (he used to work from home, so I can't ask him directly).
Yes, it's the Meishausen RCP data.
If we accept the lower AIE and still demand a fit to the warm last decade, then that does indeed suggest a misfit of the response time. Which could suggest something else is misfit and pulling in the wrong direction. I'm currently involved in another discussion on the volcanic response - do you have anything to add on that?
One line of attack would be to release the constraint that all the forcings have the same response function, which might give a clue to where the problem lies. However overfitting is going to be a big problem.
As ."One Planet" @ 8 asserts, 'delay" appears to be the motive behind politician's yammering about the "lack of absolute certitude" incessently. And yet, even with "Rush Limbaugh" having 1/2 of his brain tied behind him, he and I and thou and thee and all things whatsoever appear to have a "common cause" here, motivated by a desire to avoid the end of evolution on this planet.
Therefore then, there has to be at least one psychotic in the room, or the matter must not yet be well communicated, as regards the dire-ness of the scenario.
"Relative benefit" is difficult to discern when all parties are reduced to ash, or dessicated proteins.
I don't get how it is that I am extremely motivated, and so many others appear to not give a flying whit.
I did give myself the out of "psychosis", above, please pass the Clozapine.
Kevin, let's see whether I get the message across to you.
I've already realized that all forcings have the same response function. Could indeed be a problem, particularly for anthropogenic aerosols as they've mainly been counterbalancing forcing to the GHG forcing. Apart from a short period in the 1960s when they might have been strong enough to produce a net negative forcing, they have ever been "working" in a positive forcing regime which is suggestive of an immediate effect. In my opinion, they should therefore always be treated as an instantaneous forcing.
However, I do believe that the default response time for volcanic eruptions (30 years) is also not appropriate. I set the response time of the 2nd time constant (tau_2) to 5 years and are still obtaining reasonable results. In fact, if I only test the correlation for the period past 1950 (when the longer term effects are increasingly irrelevant), the correlation coefficient peaks at 5 years response time and again at very long response times > 40 years. For me, this is indicative of two "real" response time scales involved. Well, three in fact: The very quick land surface response (1 year), the fast ocean response (3-5 years) and the very slow ocean response (>100 years).
I think I raised this issue when you took down the FR11 video. I argued, that I don't see any problem with the video and the FR11 method as it fully takes the land and the fast ocean response into account. My point is, that the remaining imbalance does not have a measurable effect on the surface temperature anymore (see Stenchikov et al. 2009). Rather, the forcing signal it is stored in the deep ocean for a very long time (see Gleckler et al. 2006).
And now comes the trick: This "lost" signal reemerges to the surface in the form of stronger La Nina events in the decades after the eruption. You may think of ENSO as a mediator for the remaining energy imbalance of the system. My suspicion is, that volcanic eruptions result in a preponderance of La Nina like conditions once the post-volcanic El Nino phase fades away (there is more than anecdotal evidence that strong eruptions tend to trigger an El Nino event). Alternatively, the magnitude of the La Nina and/or El Nino events may change according to the remaining energy imbalance in the system (i.e. in deeper ocean layers). The preponderance of La Nina like conditions which we are encountering right now might be some sign of a delayed response to the Pinatubo eruption. With respect to the timing of such system restoration processes, I think there is no rule whatsoever. It remains a stochastic problem. However, in the long-term, the system does equilibrate at some stage (apart from the fact that "true" equilibrium might never be reached due to the never ceasing volcanic activity).
Why do I think that this is the case? Because we can reproduce the NH temperature of the past 500 years by means of all known external forcing factors as previously shown:
www.skepticalscience.com
Note that the slow volcanic ocean response in this example is mimicking the ENSO response such that it lowers the surface temperature for almost a century (following an e-folding restoration curve). In the "real world" however, the remaining surface temperature signal after 5 years is so small, you would never be able to pull it out of any observational data. Rather, it is camouflaged as ENSO ;). No contradiction here! That's why FR11 is still working. Whether their identified ENSO-related trend is purely stochastic or whether it contains a volcanic footprint ... not sure we will ever know for sure. However, in my opinion, it doesn't change or undermine their conclusions.
Sounds weird? Well, that's the way I think the whole system works. It seems to be an elegant way to combine the different external forcing factors and interval variability likewise. It consistently solves the big picture, but leaves room for stochastic processes.
Replying to davidnewell @ 12.
The best explanation I have developed so far for the "significant lack of concern about potential future consequences" is that some people allow their personal desire for more profit, pleasure, comfort or convenience to trump concerns about what might happen to other people in the future. The real problem in this case is that the ones benefiting most aren’t expecting to be the ones suffering the consequences.
As tragic as that sounds it seems to be the best explanation for the ease with which the delayers have been able to maintain support for their efforts to "do nothing that would spare the future from negative consequences".
There are even people arguing things as absurd as "the total lost benefit of today's most fortunate reducing their creation of future problems is greater than the problem being created". To add insult to the injury of that absurd evaluation they over-state the lost benefit and under-state the future costs by only caring about the costs to the most fortunate and then reduce those costs because they would happen in the future.
The creation of a sustainable better future for all life on our one and only planet should be the first requirement of the acceptability of any action. That, however, is not the motivation in societies that are immersed in the mass-consumption market with its pursuers of maximum short-term benefit.
That may not ease your frustration, but it may explain why so many people seem unwilling to actually understand the details and significance of this issue (the inconvenient truths). More details, presented effectively, make it more difficult for them to believe what they would prefer to believe. However, it is very challenging to "make someone believe something that requires them to give up their potential benefit just to help someone else”. It is difficult to make the case when “responsibility to create a better future for all” is not part of our culture. We can’t even convince people to focus exclusively on driving when they are driving even though they are putting themselves personally at risk when they allow themselves to be distracted from that important responsibility.
K.a.r.S.t.e.N: That is very interesting indeed, thanks for the explanation.
One of my biggest problems with the short volcanic response is that it demands a TCR which is much lower than the rest of the temperature record requires. However, a very slow response would address that in part (although some of the response would then fall out of the TCR window and contribute only to ECS). But a more complex interaction between volcanoes and ENSO (on which there is certainly plenty of literature) or even ENSO and PDO (on which there is some) would change the picture a lot.
Can you suggest any tests we could do to look at this? Allowing a separate volcanic response still seems worth a try, but I wonder if there is anything else.
Also, do you have any views on the solar response, which has a strong interaction with the delayed volcanic response on the satellite era? My other correspondent has noted recent work on UV which may affect the scale of the solar response.
However if we allow all the terms to vary separately I am still convinced that the problem suffers from overfitting, so I'm looking for any constraints I can use.
There is still Earth's basic energy imbalance of +0.58 W/m2calculated by Hansen and his teams during the last decade. Warming will continue apace no matter where it goes (deep ocean, atmosphere, etc.) until the system reaches equilibrium again, if ever. If I'm missing something, please let me know.
Kevin, for the "forcing function" in my 2-box EBM I used a quick land response (1 year) and a slow ocean response (60 years) ONLY for volcanic eruptions. The latter combines the fast and the slow ocean response in that the exponential decay is faster. Essentially, I merely tried to fit the Stenchikov et al. 2009 (S09) model results as good as I possibly can. You may check what I exactly did: Pinatubo S09 vs Pinatubo EBM, and Tambora S09 vs Tambora EBM. That would be my test! It's hard to come by more of these data. So this would certainly be the starting point if one were to dig deeper.
Apart from volcanes, solar variability and aerosol forcing is unlikely to be "delayed", while I accommodated the WMGHG response using OHC data (which isn't perfectly accurate, but only an issue in the last 50 years or so). It does reproduce the principal climate variability in a quite convincing fashion, which - after all - was the whole purpose of this exercise for me. However, it is by no means robust with regard to the ultimate climate sensitivity (though mainstream numbers do the job quite well), since I was trying to get the NH response right (due to the limited number of reliable global paleo-reconstructions).
You are right, the slow response won't have a measurable effect on TCR. It merely controls ECS in the long run (which is one reason why I consider all these supposedly observation-based ECS estimates useless). So yes, TCR might be lower. BUT, it is only lower because part of the initially forced temperature response is now treated as stochastic internal variability (mainly PDO). What is commonly believed to be purely chaotic is in fact partly driven by former external forcing. What is changing as a results of this, is the ratio between TCR and ECS. TCR might be lower, but ECS remains entirely unaffected. So I am not sure there is much that can be done here. For example, there is simply no way to reproduce the strong SST increase post-Novarupta (1912) until 1940. In the simplest case, it is just the immediate recovery from Krakatoa, Santa Maria and Novarupta, which went on uninterrupted with its climax during the strong 1942 El Nino (supported by early GHG forcing).
Another potential "solution" to the volcano-puzzle: As we are lacking precise knowledge of the strength of some volcanic eruptions, we might have to revise the volcanic forcing estimates (despite some recent more sophisticated attempts to fill the gaps). Novarupta is one such example, an eruption which might have led to much more intense NH cooling. At least, it causes the strongest bias in the CMIP5-GISS comparison (corrected for ENSO following FR11).
Re solar response: I'm not sure in how far this has to do with a delayed volcanic response? I might have missed sth here. The solar UV response has implications for the (north) polar region in the NH winter. Via considerably changing solar fluxes in the UV range, the coupling between polar stratosphere and troposphere is "facilitated" under low solar activity conditions (due to changing stratospheric heating rates IIRC) which in turn increases the chance for polar vortex splitting and subsequent cooling in Eurasia. The net effect is a slightly amplified cooling. We saw many of these events in recent years, with 2012 being a particularly drastic example. As you surely know, it might as well be a response to the shrinking Arctic sea ice. Hard to know, but there is some evidence for the solar link. Models with a so-called high-top stratosphere reproduce the observed patterns nicely (Adam Scaife and Sarah Ineson have good publications on that issue).
By the way, when I am using the Potsdam forcing in your toy model, I noticed that the volcanic temperature response seems to have an offset. Don't know whether this is just a graphic issue. If not, it may introduce an unintended error when it comes to the computation of the correlation coefficient.
K.a.r.S.t.e.N@17.
My ten peneth down the wishing well on early 20th century forcings is to wonder how quickly electric power was adopted during those decades. We have good data for how much coal was burnt but I have been unable to find information on the proportion burnt in power stations as opposed to factory boilers and domestic grates. Any significant drop in coal use in boilers and grates would have made a big difference to pollution even if coal use in power stations was increasing and resulting in greater total coal use - my hypothesis being that power stations burn more consistently and more cleanly. Unfortunately quantitive data on the rise of the power station has so far eluded me.
MA Rodger @18, the biggest change in the early twentieth century would have been from coal fired to oil fired boilers in shipping.
One Planet Only Forever @ 14.
Thank you for that summary explanation. Very thoughtful.
MA Rogder @18: I don't have much to add to Toms comment. Black Carbon emissons seems to have risen a bit faster at that time while sulfate emissions stalled temporarily. Anthropogenic aerosol forcing hence not negative. But unless current emission inventories change dramatically, forcing contributions from anthropogenic aerosols are marginal between 1920-1940. Some propose land use changes as a more potent driver. I think that's also only a tiny part of the story. Another minor contribution may arise from a temperature station coverage bias (less robust SH data).
K.a.r.S.t.e.N @21.
Nonetheless, thank you for the comment. It prompted me to mix "black carbon" into a renewed bit of searching & quickly arrived at Bond et al 2007 "Historical emissions of black and organic carbon aerosol from energy-related combustion, 1850–2000." They wade through the various coal uses & historical energy intensities. They find falling global BC emissions from coal use after 1925 but very little deviation from a constant rate of increase from all sources.
And they work through their estimation methods so I can have a bit of fun seeing if I can sort out some sort of smog factor.
MA Rodger, for BC I am currently relying on Skeie et al. 2011a, while it is the companion Skeie et al. 2011b paper for all other aerosol species. The latter also provides some interesting forcing estimates, though I'd rather treat them with caution ;-)
OK, there's a problem is estimating separate response functions from the different forcings. We basically have three types of forcing - anrthopogenic, solar and volcanic.
The solar response is probably small. The BEST attribution paper puts it at 0.03C solar cycle peak to peak, which is smaller than Hansen and much smaller than F&R. However the result is strongly dependent on the duration of the response function. That means that for the moment it's not a very good basis for deducing the response function.
The anthropogenic forcing is the biggest part of the signal. However it shows a roughly exponential increase over time. One problem in deconvoluting the temperature response from the forcings is that the deconvolution is singular for some classes of signal - linear and exponential functions included. We can't determine the shape of the response function from the anthropogenic response, because there are an infinite number of equally good solutions.
That leaves the volcanic signal (or potentially a combination of the three signals). Now if the volcanic response has a dip in the second decade due to reduced heat release through ENSO, then that should be at least partly mitigated by including the ENSO term in the model (maybe only partially because the actuall response might be non-linear, e.g. current ENSO times heat stored last decade). If non-linearity is not an issue, including the ENSO term would avoid the need to change the shape of the response function.
Further, I'm not sure I see a reason (unless we get into non-geographically-uniform forcings) for ENSO heat storage to respond differently to volcanoes than to other forcings.
@Kevin C:
Re the volcanic response, I am not sure whether I got your last sentence in the 4th paragraph. If ENSO is included (which it already is in the first figure of the toy model), the lag time for volcanoes in the response function should be less than 30 years (which is the current default lag time). It seems that 5 years are more appropriate. With longer lag times, wouldn't there be the danger of "double counting" in case ENSO is partly volcanically modulated?
Re your last paragraph, there is an interesting paper by McGregor et al. 2013 which came out a week ago, argueing that ENSO might indeed be capable of responding to external forcing. While physically plausible, they present intriguing paleoclimatic evidence for that.
So far, it is thought that stronger (pos.) external forcing tends to produce less frequent El Nino events or to reduce its magnitude, resp. If this holds true also for short term forcings, negative volcanic forcing would increase the likelihood for El Nino events. And indeed, most volcanic eruptions are followed by an El Nino. As a result, a considerable energy imbalance builts up in the climate system, an imbalance which has to be overcome somehow ... and the easiest way to do that is to have stronger La Nina events in the decades that follow. I am not aware of any proposed mechanism for that, which is why I am very careful to connect the current La Nina preponderance with a delayed Pinatubo response. I just mentioned it before as one conceivable reason for that, while I consider it much more likely to be the case for past eruptions. I rather think of the current La Nina phase as a counterbalancing response to the strong GHG forcing (in agreement with some anecdotal paleo-evidence; see e.g. Mann et al. 2009). This way, everything would be fairly consistent, apart from the fact the many climate models suggest a different response. Nothing we should be too worried about in my opinion. The fact that things have looked different in the course of the past century could be easily explained by the highly spatially heterogeneous and temporally variable aerosol forcing. Above all: Stochastic internal variability!
Hope that makes sense to you, though it might not bring us closer to the "response function truth".
Kevin, yet another addendum:
The mentioned offset in the volcanic forcing in the Potsdam or Meinshausen et al. 2011 data, resp, is in fact a deliberately chosen nominal positive forcing of 0.2 W/m2 in order to obtain consistency between the historical period and the future forcings. The idea is to account for the average planetary energy imbalance caused by past volcanic eruptions. The very imbalance which causes the climate to warm as soon as a volcanically quiet period occurs. Or in other words, it is the forcing equivalent to the volcanic deep ocean cooling I mentioned earlier, which tends to cool the planet for a very long time (in the way hypothesized above). Of course, it is a crude average estimate, but better than nothing. Preferably, the CMIP5 GCMs would be spun up for a millenium or so before the actual simulation period of interest is run (in order to make sure the model is in quasi-equilibrium according to historic volcanic activity). See Gregory et al. 2013 for more details (I just had the pleasure to listen to a talk of Jonathan, during which everything became crystal clear all of a sudden ;-)).
So everything correct. I just didn't connect the dots properly.
Does the Yu Kosaka and Shang-Ping Xie study cite a value for climate sensitivity based on their data? The value which drops out of my 2-box model is 0.77°C/W/m², or around 2.8°C for a doubling of atmospheric CO₂.
@Icarus:
Which forcings did you use? In case it is based on GISS, please see my comments #5 and #10 in which I point to some rather intractable inconsistencies with these data.
Kosaka and Xie don't touch upon the sensitivity issue. However, J-N Gammon did, coming up with a rather low TCR estimate (based on the CM2.1 model used in the study) after an initially more plausible range. While his revision was certainly justified, the model itself seems to have issues with the aerosol forcing as Paul S pointed out in the comment section. I agree with him, which should bring the TCR estimate back to J-N-G's original posting.
Thanks K.a.r.S.t.e.N. I haven't gone into it in as much depth as you have, and yes I used the GISS forcing data. I think you're saying that the GISS aerosol forcing is too large, which would make the net forcing unrealistically small, and the sensitivity therefore too high... is that correct? I think James Hansen did an analysis relating to this in a recent paper - trying different response times and different aerosol forcings. Possibly this was the paper which brought on his comments about a 'Faustian bargain'. I will have to dig it out and re-read it...
Icarus, the constant aerosol forcing ramp up is extremely unlikely. In fact, this is reflected in the Meinshausen-Forcing which is more or less the basis for the upcoming AR5. So yes, with GISS aerosol forcing, the sensitivity might be too high. On the other hand, the GHG forcing is on the high(er) side in the GISS forcing data. Some counterbalancing here, but I am afraid we are going to run into the next issue right away: The so-called effective radiative forcing concept. Way beyond what I can explain right now, but maybe something we get to hear more often very soon (see Forster et al. 2013 for more).
You are absolutely right regarding Hansen et al. 2011. It is certainly an interesting effort, a very interesting one to be sure, but I am inclined to think that the models have more trouble to get the ocean response right, rather than they are wrong regarding the aerosol forcing. My argument is mainly based on the latest developments on the "OHC-front", i.e. the results presented in Balmaseda et al. 2013. If true, they contradict Hansens assumption of a lower planetary imbalance in the last decade, which in turn suggests that the slow response function (effective deep ocean mixing) is closer to the truth (corresponding with a more plausible aerosol forcing). Given the current ENSO state, I'm hardly pressed to think that his notion of "[too] excessive deep ocean uptake of heat" (with respect to GISS modelE-R) might be wrong after all. What I heard from (some) ocean modellers recently, seems to point in a similar direction ... corroborated by the simple fact that the model response to the forcing over land is surprisingly good, while all the discrepancies are restricted to the ENSO region as well as the circumpolar southern oceans. Hoprefully, Fig. 2 from van Oldenborgh et al. 2013 helps to illustrate what I just said:
I wanted to chime in with my own SOI analysis inspired by Kevin C and Icarus.
I took a monotonic warming and laid the scaled SOI on top of it, comparing to the GISS temperature record. Then I added in the major volcanic disturbances using the BEST data. The lower panel is the SOI-corrected signal, which shows no evidence of a pause.
Since the SOI reverts to the mean, it is virtually impossible for the pause to continue considering its past historical trend.