Phil Jones - Warming Since 1995 is now Statistically Significant
Posted on 14 June 2011 by dana1981
As all Skeptical Science readers are undoubtedly aware, in February of 2010, Phil Jones was asked some loaded questions in an interview with the BBC. Several of the questions were gathered from "climate sceptics", and Jones' answer to the second one has been widely re-published and distorted:
"Do you agree that from 1995 to the present there has been no statistically-significant global warming?"
"Yes, but only just. I also calculated the trend for the period 1995 to 2009. This trend (0.12C per decade) is positive, but not significant at the 95% significance level. The positive trend is quite close to the significance level. Achieving statistical significance in scientific terms is much more likely for longer periods, and much less likely for shorter periods."
Why choose 1995 as the starting point in this question? Well, that is the closest year for which the answer to this loaded question is "yes". From 1994 to 2009, the warming trend in the HadCRUT dataset was statistically significant at the 95% confidence level (CL). It's also worth noting that there's nothing magical about the 95% CL - it's simply the most commonly-used interval in scientific research, but it's also true that the HadCRUT 1995-2009 trend was statistically significant at a 93% confidence level.
In other words, using Jones' data, we could say with 93% confidence that the planet had warmed since 1995. Nevertheless, this did not stop numerous mainstream media outlets like Fox News claiming that Phil Jones had said global warming since 1995 was "insignificant" - a grossly incorrect misrepresentation of his actual statements. The Daily Mail warped the truth even further, claiming Jones had said there was no global warming since 1995. These media outlets turned 93% confidence of warming into "no warming".
Furthermore, the HadCRUT dataset excludes portions of the Arctic where there are no temperature stations. The Arctic also happens to be the fastest-warming part of the planet. NASA's GISTemp, whose data analysis extrapolates for the Arctic temperatures using the nearest temperature stations, did find a statistically significant warming trend at the 95% CL from 1995 to 2009. So not only are the "skeptics" cherrypicking the start date, they're also cherrypicking a dataset which doesn't cover the whole planet.
Deep Climate has detailed the history of the 1995 cherrypicked starting point. It appears to have originated with an email from Richard Lindzen to Anthony Watts, which was subsequently published in a post on WattsUpWithThat (WUWT):
Look at the attached. There has been no warming since 1997 and no statistically significant warming since 1995. Why bother with the arguments about an El Nino anomaly in 1998? (Incidentally, the red fuzz represents the error ‘bars’.)
Best wishes,
Dick
Luboš Motl made a similar argument in December 2009 using UAH satellite data, which was also published on WUWT. Two months later, the question was posed to Phil Jones in the BBC interview, which suggests strongly that it originated from Motl, Lindzen, and/or Watts. Regardless of the source, what really matters is that the question was based on a cherrypicked starting date, and on a somewhat arbitrary statistical confidence level, and that the media subsequently distorted Jones' response.
In January 2009, Tamino at Open Mind analyzed the data after removing the influence of exogenous factors like El Niño, volcanic eruptions, and solar variation from the temperature data. Tamino concluded that "until 2001 the warming is statistically significant" (Figure 1).
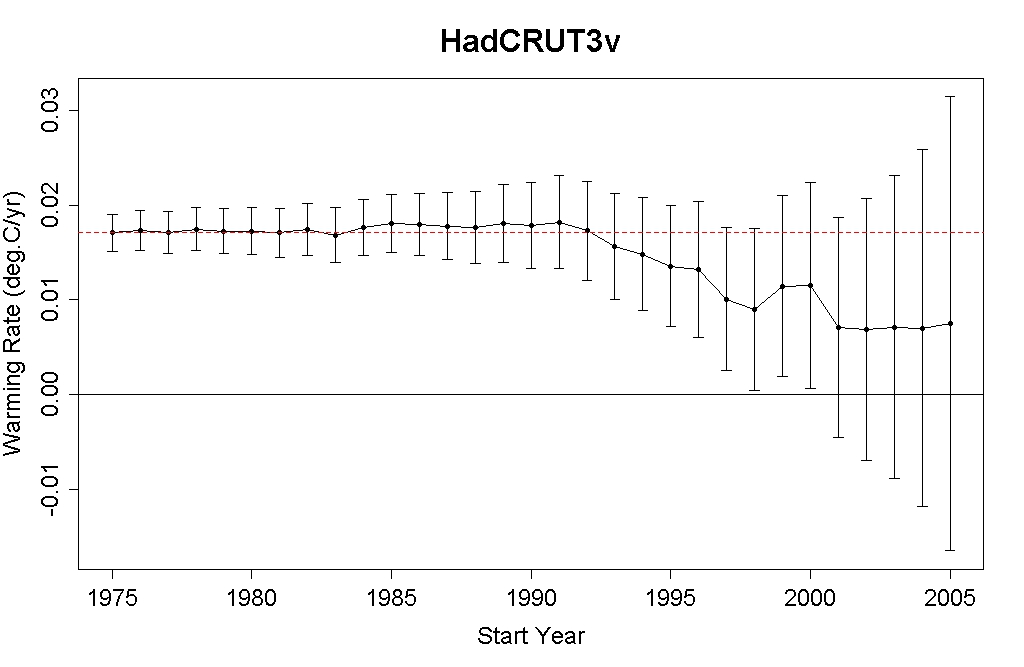
Figure 1: HadCRUT3v estimated warming rates from the plotted date to Present with 2-sigma error bars, using exogenous factor-compensated temperature data (Open Mind)
Another year has passed since the original BBC interview, and in a new BBC article, Jones notes that the HadCRUT warming trend since 1995 is now statistically significant.
"Basically what's changed is one more year [of data]. That period 1995-2009 was just 15 years - and because of the uncertainty in estimating trends over short periods, an extra year has made that trend significant at the 95% level which is the traditional threshold that statisticians have used for many years.
"It just shows the difficulty of achieving significance with a short time series, and that's why longer series - 20 or 30 years - would be a much better way of estimating trends and getting significance on a consistent basis."
As Jones notes, and as scientists like Lindzen and Motl should very well know, trying to assess trends in the noisy global temperature data over periods as short as 10-15 years is pointless. There's just too much short-term noise, which if you're going to look at such short-term data, you at least need to attempt to filter out first, as Tamino did.
So to sum up, a cherrypicked starting date chosen by a couple of "skeptics" (Lindzen and Motl) and published by a "skeptic" blog (WUWT) was picked up and passed along in the form of a loaded question to Phil Jones in the BBC interview. Phil Jones' answer was subsequently (and predictably) grossly distorted by various media outlets, who turned 93% confidence of global warming into "no global warming".
In reality, the HadCRUT warming trend since 1995 was statistically significant above the 90% CL, the GISTemp warming trend (which does not exclude the Arctic) was significant at the 95% CL, and by removing short-term effects, even HadCRUT has been significant at the 95% CL since 2000. One year later, we can now say that the HadCRUT warming trend since 1995 is statistically significant at the 95% CL, even including the exogenous factors.
Unfortunately, the main consequence of this sequence of events was that much of the public was misinformed by media articles claiming that global warming since 1995 was "insignificant" or non-existent, which are both factually incorrect statements. Misleading the public may well have been the goal of those individuals who originally cherrypicked the 1995 starting date and the HadCRUT dataset, and if so, they succeeded. And not surprisingly, Anthony Watts continues to mislead his readers, claiming Phil Jones' comments are "an about face...From the “make up your mind” department", when in reality Jones' comments have been consistent and accurate throughout.
This reactions to this story have revealed a number of media outlets whose aim is not to accurately inform their readers with regards to the climate, but rather to misinform them.

Arguments


I saw one last night but do not remember where.
Jerry
Also, is the cooling since 2001 significant? Sure looks so.
[DB] "Also, is the cooling since 2001 significant? Sure looks so."
You have made a non-factual statement, sir. Removing the transitory exogenous factors such as volcanic effects and oceanic cycles (which neither add to nor detract from the long term trend) one gets this:
Looking at the warming rates:
[Source]
Care to provide us with a peer-reviewed reliable source for your claim? Because there clearly isn't any cooling evident. Just warming that hasn't yet reached the 95% significance level.
Essentially what we can say is that if we were to repeat the experiment on a large number of times (using parallel universes perhaps), then if we assume the null hypothesis is true we would see a statistic at least as extreme only 7% of the time. But this is only the case if the null hypothesis is true.
sorry to be picky... :(
If we assume there is no long term temperature trend (warming or cooling) we would expect to see a short term warming trend as strong as that in the HadCRUTv3 temperature series only 7% of the time.
Sure, the CRU published data contains a cooling trend since 2001.
The charts above from Tamino, which exclude data, are most certainly not peer reviewed science.
[DB] "Sure, the CRU published data contains a cooling trend since 2001."
Patently false:
The time series shows the combined global land and marine surface temperature record from 1850 to 2010. According to the method of calculation used by CRU, the year 2010 was the equal third (see footnote) warmest on record (with 2003), exceeded by 1998 and 2005. The years 2003, 2005 and 2010 are only distinguishable in the third decimal place.
[Source]
Tamino's charts are based on CRU data so they directly reflect the warming signal inherent in the data. And they follow the same form used in peer-reviewed science. Perhaps you are unaware that Tamino, in addition to being a professional time-series analyst, is also publidhed in the field of climate science?
In CW's eagerness, he forgets to note that he has just agreed that the warming was in fact present for the period in question. The relatively noisy data and statistics dictate that one typically needs 20-30 years of global temperature data to determine reliable trends in the data-- yet here we have another 'skeptic', again cherry picking. Yay, we can do this ad infinitum to delude ourselves-- "ooh, ooh the warming in 2081-2085 slowed or was not statistically significant, no need to worry folks!".
I have process the data using a stats package. The rate of warming for the HadCRUTv3 (variance adjusted) data was 0.10839 C/decade, and for 1995-2010 it was 0.10865 C/decade, a difference of 0.00026 C/decade. Yet some dishonest people would have us believe that that tiny difference is the difference between warming and no warming.
Can we also assume CW that you are OK with people (even some of high standing like Lindzen) cherry-picking the data with the sole purpose of hiding the incline and obfuscating?
Climate Watcher - no, the "cooling since 2001" isn't statistically significant, since it doesn't exist.
Sounds like denial.
And the IPCC trend is not linear, so please stop misrepresenting the IPCC report. We've explained this to you several times and yet you continue to repeat this distortion. You're like our own personal Fox News.
This is the quote from the IPCC:
"A temperature rise of about 0.2 °C per decade is projected for the next two decades for all SRES scenarios"
More good learning tools about statistical significance of trends in noisy data in Tamino's "How Long" post, as well as the linked post above.
2010 was also 1st or 2nd in the list of all-time hottest years (up to May 2010 was clearly the hottest 12 months IIRC). With the start of a big La Nina, and an exceptional solar minimum, that's some cooling we're observing. As far as I know, the early months of this year, under the effects of a full large La Nina, are still ranking highly in all-time lists. Some cooling...
If only science could go back to Bayes factors, then we could have validity and accessibility!
Yes there is a warming trend in the thirty year record. ( I have never indicated there wasn't ).
At the same time, the warming since 1995 and the cooling since 2001 can both be statistically significant.
The thirty year trend certainly contains more data points, but it was Jones who notes the trends since 1995 to begin with.
[DB] You continue to make false, unsubstantiated statements and ignore rquests for substantiation of those claims. If you wish your comments to remain after posting, then please either substantiate those claims as requested or retract the falsehoods.
[Dikran Marsupial] Jones was asked to comment on trends since 1995 in a BBC interview, he did not introduce the 1995 start date (as you ought to know if you read the article to which you are responding). Jones gave a completely straight answer to a highly loaded question, an example to which we should all aspire.Looking at the trend from 2001 (10 years of data) is meaningless in the context of making deductions about whether or not the planet is undergoing long-term warming or cooling (you know, climate change).
The p-value for the 2001-2010 trend (-0.0281 C/decade) is a paltry 0.592, an epic fail. Hardly surprising given that the deniers are cherry picking 10-yrs of data, a period of time known to have no statistical significance. To use Tom's analogy, we would expect to see a short-term rate of 'cooling' as calculated for 2001-2010 ~61% of the time-- so nothing unusual.
Did I get that right Tom?
There are those who would use this short-term (sky would call it cherry-picked) data to "prove" that the globe is cooling, and others who will claim that the decrease does not exist.
At least acknowledge the data for what it is worth.
You are digging yourself in a very, very deep hole here.
CW "Jones who notes the trends since 1995 to begin with."
No, please pay attention and read the main post. It was a set-up by Lindzen and his pals.
CW "the warming since 1995 and the cooling since 2001 can both be statistically significant."
I have just shown @14 that your unsubstantiated claim that the temperature trend from 2001 to 2010 was statistically significant is demonstrably wrong. Do you not even understand basic stats?
Please stop right now at trying to deceive people.
1. GISS reached 95% confidence through 2009.
2. Independent satellite (RSS/UAH) records also show warming (90% level?).
3. Significant global glacier loss, and rising sea levels are indirect indications of warming.
What are the odds of all these measures being greatly wrong in the same direction?
HadCRUT3v global dataset
Yes, they did a double cherry pick, they sought out the HadCRUT3 data from all the available global temperature data sets to deceive and confuse. Ironic beyond belief, because the CRU employs the same group of scientists who the 'skeptics' accused of fudging the temperature data and of fraud. The behaviour of Lindzen is beyond the pale.
Re the 2001-2010 period, CW is arguing a strawman, so how anyone can imply Dana is trying to hide/ignore something that was not even on the radar when he drafted the post is beyond me. This is what 'skeptics' have to do in the absence of facts-- they distort and fabricate strawmen arguments.
[DB] Indeed. When one considers the warming of the Arctic excluded by CRU, the cherry-pick becomes even more obvious:
Especially when viewed latitudinally:
[Source]
I find it a bit silly, in comments on an article about cherrypicking data since 1995, that we're now cherrypicking data since 2001.
"I find it a bit silly, in comments on an article about cherrypicking data since 1995, that we're now cherrypicking data since 2001."
It is how they manufacture debate and confuse Dana. But I'm sure you know that and are being too polite about it :)
Hmm. There's a lesson to be learned here. Scientists being interviewed by the media should take some media training. No politician would have fallen for an ambush like that. Climate Scientists need to start thinking more like politicians. It's not being dishonest; it's just thinking through how your responses can be misrepresented by those with intent to deny. Remember, if you pause and think, nine times out of ten the editor will have to cut out the pause. By all means fill the gap by saying something like, "let me explain this in ways the layman can understand..." pause... (as long as you like)... then answer. Don't be rushed! Of course if you're live on air you might not get asked again: but what's worse -- that, or being haunted for a year by something you said too hurriedly?
And that's free advice from someone who has been interviewing people for doccos for 35 years.
There pretty much isn't a way a layman can understand frequentist statistical hypothesis tests; many scientists who use them every day don't understand them either. I am a statistician and while I understand them, I can't really explain why they are useful in the form they are generally used in science.
The point I was really making was that Jones gave a straight answer to a loaded question, unlike some (naming no names) that give loaded answers to straight questions! ;o)
In that sense I agree with John Russell - it would behoove climate scientists to take some media training before being interviewed. It's unfortunate, but they really have to anticipate that there are a lot of people just waiting to pounce on any opportunity to misrepresent their comments. Rather than beginning his answer with the word "yes", Jones probably should have begun it with an explanation about why the question was loaded.
[DB] Good points. Here's the trends, overall, 2001-2010 and 2008-2010:
[Source]
It was fine if you're a scientist who understands the language. But while it was scientifically correct it could have been worded to make it clearer to the layperson. For instance I think if Phil Jones had been media trained he would have answered the question, "Do you agree that from 1995 to the present there has been no statistically-significant global warming?" with the answer...
"I've calculated the trend for the period 1995 to 2009. This trend (0.12C per decade) is positive at the 93% significance level. Which means there's only a 7% chance of error." (-- or whatever is scientifically correct).
There was no reason to say, 'Yes'. The interviewer is not a judge and they're not in court. Saying 'yes' meant that from that point on he was on the back foot.
And yes, he probably would not be invited back, because providing context and dictating the narrative would have circumvented the story that was trying to be spun.
"Well, there is a statistically significant warming trend since X, but the period from 1995 to the present is simply to short to properly use statistical methods to answer your question."
That answer, too, would have been a bit of a white lie (if the upward trend were strong and steady enough, it would have been possible, so saying it's not possible is not strictly true, it's just not true as things turned out), but... really, I think it's the only thing he could have said to avoid all that came after.
My advice to everyone is to get a supercomputer, and run several thousand iterations of OUTFOX-E before you post a even a simple comment here!
Media training is about having the confidence to get your point across in a friendly and helpful manner, no matter what you're asked. Most scientists are touchingly naive about this (I've interviewed enough of them to know!). The truth will win in the end but at this point it needs a bit of help. The 'sceptics' are way ahead of you on this.
What we could do is look at a longer timescale, in which case the warming trend is clear (and indeed statistically significant). That would suggest that we just don't have enough data to be sure that the observed trend is not just the result of chance.
I could also point out that if you don't have much data (i.e. you look at trends over a small timescale) it is easy to find cooling trends, even while long term warming is clearly going on, for instance:
Again that suggests that the reason for a lack of significance is that there just isn't enough data between 1995 and 2009 to rule out random chance, as there are three other similar (albeit shorter) cooling periods that are very likely to be random chance. If they wanted additional evidence, I'd point them to the paper by Easterling and Wehner on this topic.
I'd also point out that another way of deciding would be physics. CO2 is known to be a greenhouse gas, the greenhouse effect has been well understood since the 1950s, and if there were cooling you'd need an explanation as to why there was cooling. In other words we have prior knowledge and the trend between 1995 and 2009 is not the only evidence we have.
However I know there is plenty in there to be misconstrued by the deliberate denialist. It is unavoidable.
Jones clearly did get his point across in a relaxed and friendly manner, just not perhaps the point that we might have wanted him to get across!
sphaerica ;o) ... or just have a time machine, I'm sure that is the way Hansen got his predictions so accurate, we all know climate projection is impossible because climate is chaotic!
In this case that's not the situation. Roger Harrabin, the BBC's reporter is straight up -- but I don't think he realised the significance of the question he was asking. And if he did he would probably have been hoping Jones would have given a stronger rebuttal. Remember that most interviewers talking to a single individual have to ask devil's advocate questions because they cause the interviewee to respond with strong answers.
I suggest anyone likely to be interviewed analyses interviewing techniques on TV -- you can learn a lot.
Here's the headline after Dikran Marsupial, a lead figure in the climate change debate, gives an interview to the BBC (and this is an exact quote):You can't win at this game. You just can't.
I have some links handy with the four main timeseries, suitable fo the most common situations:
1995 until today
1998 until today
2000 until end of 2010
2000 until today
[DB] Fixed missing equals signs from html url tags
Using the GISTEMP dataset (1880-present), if you create averages your intervals in the upper 50's of years or greater, you will find no cooling trends, and the same for the HadCRU dataset (1850-present) for intervals in the lower 80's or greater. This gives visual to support to the points made about the desirability of using longer intervals. (Unless there is something hidden in the graphing tool, I realize I'm ignoring statistical significance. And I would want to understand those data before using it where I was an author. But the picture certainly is interesting.)
Also--in my mind at least--shortening the interval to show times when the trend is decreasing over various intervals certainly gives one pause in "calling" a peak, because the ones in the past haven't persisted. I would think you'd want some driver to have changed to increase confidence that something really was different.
What I find rather ironic, is that of all the temperature databases, only UAH has a 5-year moving average in record territory. Go figure.
You might find this analysis enlightening:
Tamino - Five Years
And yet some people insist that short term data sets represent "trends"...
I also find the critiquing of Jones' interview on a public comment thread to be unseemly and unwise.
The "null hypothesis" for the significance tests is taken as "there is no trend".
Is that really an appropriate test to make, when you've got decades of data which provide a trend with a high degree of confidence?
I.e. surely, when adding to a pre-existing data set, the test should be "is this indicative that the trend has changed from the previously established and highly significant trend?"
I'm sure there's a detailed statistical answer as to why this isn't done, but it's not one I'm aware of.
Then again, it might just be custom, to test against a "no-trend" hypothesis.
This can be seen in politics also, where anything (really anything, it's appalling) goes, as long as one side can be represented as "bad" in the resulting rethorics. It is a profound failure of critical thinking in the masses that makes this possible. All objective reality can be dismissed, everything becomes a matter of opinion and all opinions are equally valid by virtue of being just opinions. Sad.
A couple of points:
DB inline comments @7: I believe the peer reviewed article by Tamino based on the analysis from which your charts @2 comes from is not yet published. (I am unsure whether it has been accepted yet, or is still in review.)
Dana @5 does not "fail to acknowledge the data", he just does not restrict his analysis to just one data set. In fact of the four major data sets, just one shows a negative trend over that period. RSS is almost exactly flat, but very slightly positive. GISStemp and UAH are strongly positive over that interval.
Climatewatcher @2, if a 0.12 trend over 15 years is not statistically significant, then a -0.0281 trend over 10 years certainly isn't. (But see following comment.)
For AGW, as postulated by the IPCC, this is not the case.
The IPCC predicts a range of possibilities for both a 'Low' and 'High' scenario.
The "likely" range of 1.1C to 6.4C warming this century defines the null hypothesis.
Anything lower ( or higher ) falsifies the theory as embodied by the models.
The trends since 1979 in various data sets are from 1.3 to 1.7 C per century, which do lie within the range, though at the low end. The chorus here is the modeled trends are not linear, and they're not, but they're pretty close. And anyway, the IPCC gave us another prediction to measure things by when they predicted the 0.2C per decade rate for the next two decades regardless of scenario.
[dana1981] No. The IPCC projected temperature trends are not even remotely close to linear, unless we dramatically cut GHG emissions.
As for your 0.2°C per decade claim, if it was made in the 2007 IPCC report, we're 15% of the way there. Please, stop obsessing over short-term cherrypicked data, and please stop misrepresenting the IPCC report.