Climate Science Glossary

Term Lookup

Enter a term in the search box to find its definition.

Settings

Use the controls in the far right panel to increase or decrease the number of terms automatically displayed (or to completely turn that feature off).

Term Lookup

Settings


All IPCC definitions taken from Climate Change 2007: The Physical Science Basis. Working Group I Contribution to the Fourth Assessment Report of the Intergovernmental Panel on Climate Change, Annex I, Glossary, pp. 941-954. Cambridge University Press.

Home Arguments Software Resources Comments The Consensus Project Translations About Support

Twitter Facebook YouTube Mastodon MeWe

RSS Posts RSS Comments Email Subscribe


Climate's changed before
It's the sun
It's not bad
There is no consensus
It's cooling
Models are unreliable
Temp record is unreliable
Animals and plants can adapt
It hasn't warmed since 1998
Antarctica is gaining ice
View All Arguments...


Username
Password
New? Register here
Forgot your password?

Latest Posts

Archives

Data Contradicts Connection Between Earth's Tilt and the Seasons

Posted on 12 April 2012 by ptbrown31

***The following is a satirical argument intended to highlight some basic errors often made in the climate change debate. Also, I want to show how easy it can be to fool ourselves with real data. The subjects that are touched on are 1) signal-to-noise ratio issues in the Earth's climate system (also discussed here and here, for example) and 2) the fallacy of inferring causality from correlation without evoking physics (also discussed here and here). Those who follow the global warming debate will immediately recognize the similarity to arguments that short-term cooling during a CO2 increase disproves human-caused warming.***

For years we have been told that the Earth's tilt and the associated changes in incoming solar radiation are the cause of the seasons. Scientists have claimed that it is "settled science" that during spring, the day length increases and the sun gets higher in the sky at noon. According to the theory, this should cause the Northern Hemisphere to warm from Feburary through April. However, if this science is so "settled", then why is it easily refuted with empirical evidence?

I live in San Jose, California. The blue curve in figure 1 shows the daily high temperature that we experienced between February 22nd and April 7th. I have also plotted the amount of daylight for each date in question. Notice that we experienced an overall downward trend in temperature over this time period while the length of daylight steadily increased. This is precisely the opposite of what the 'tilt theory' of seasons claims. The data proves the theory invalid!

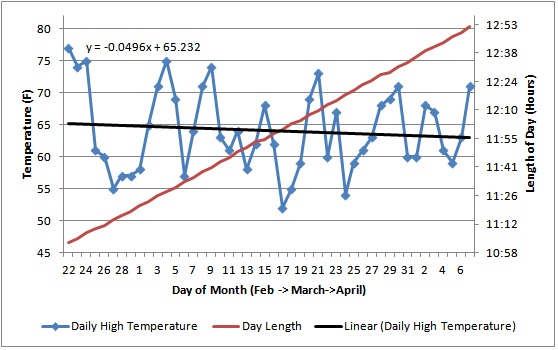
Figure 1 – Daily high temperature versus length of day in San Jose, California from February 22nd to April 7th 2012.

So if the day length does not have an effect on local temperatures what does? Figure 2 shows the same temperature data displayed in figure 1 but with the daily high sea level pressure overlaid in red. Immediately we can recognize a strong relationship between these two variables. As sea level pressure decreased over this time period, it caused temperature to do the same.

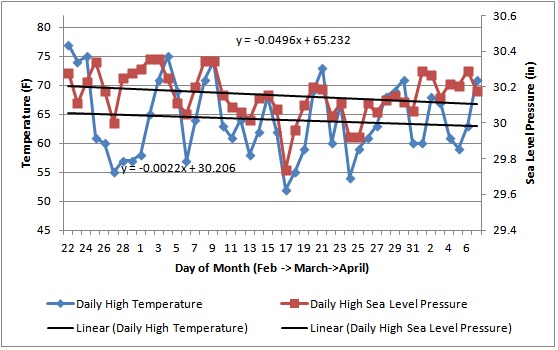
Figure 2 – Daily high temperature versus daily high sea level pressure in San Jose, California from February 22nd to April 7th 2012.

The conclusion is clear. The tilt of the Earth relative to the sun does not control local temperature variations nor does it cause seasons. Instead, local sea level pressure is the cause of seasonal changes in temperature.

***People with some knowledge of meteorology and the Earth's seasons will find the above argument ridiculous. However, if there was some political benefit from confusing the issue of why the Earth experiences seasons, I am almost certain that you would see arguments like this all over the blogosphere.

For those who do not immediately see why the above arguments are incorrect remember a couple points:

1) In order to see the effect of the Earth's tilt on San Jose weather; you need to investigate a time period longer than ~6 weeks. To see when the signal becomes apparent through the weather noise see this graph.

2) Daily high temperature and daily high sea level pressure are indeed highly correlated variables. This is because the ideal gas law shows that 'all else being equal', they must be correlated. Furthermore, from a synoptic meteorology perspective, high pressure systems are associated with clear skies and more incoming solar radiation. The problem is that this has nothing to do with the cause of seasons. For instance it can't explain why our seasons follow a 12 month cycle. Instead this relationship is only of real consequence for short term variability in local weather.***

0 0

Printable Version  |  Link to this page

Comments

Comments 1 to 24:

  1. Shouldn't this have been submitted to WUWT as new analysis?
    0 0
  2. WUWT Headline:
    Skeptical Science Admits that Earth's Tilt More Important in Climate then CO2
    0 0
  3. For a moment I thought you may be Bob Tisdale. A genuine Tisdale would have used at least 30 graphs to illustrate the same point.
    0 0
  4. While I wouldn't normally post an xkcd cartoon on SkepticalScience, there is a time and place for everything: (It took me a while to get the final panel, but I'm a little slow.) [Mouseover text: Correlation doesn't imply causation, but it does waggle its eyebrows suggestively and gesture furtively while mouthing 'look over there'.]
    0 0
    Moderator Response: [Sph] Added mouse-over text to cartoon image.
  5. Kevin C. Just quietly I think that there is much time and space for xkcd on Skeptical Science. Especially #386...
    0 0
    Moderator Response: [Sph] Embedded image reference:
  6. Thanks for the excellent simple example of bad science. I will definitely be incorporating this into my high school curriculum.
    0 0
  7. Thanks for a great demonstration of two common errors: using correlation to imply causation and failure to use all data. Has anyone considered the meaning of the fact that length of day lags mean daily temperature by ten to eleven months? #386 has always been my favorite xkcd!
    0 0
  8. We recently had a very good BBC TV series in the UK about Earths orbit around the Sun and how it determines the seasons/weather. One point made was that the summer in the Southern Hemisphere is generally cooler than in the Northern Hemisphere, basically because of the land mass in the North and the greater water mass in the South. Well worth watching if you get the chance.
    0 0
  9. That was a good series, Paul D, and it even gave a good explanation of the tilt/wobble/orbital changes that lead to and out of ice-ages. Orbit : Earth's Extraordinary Journey
    0 0
    Moderator Response: [mc] Apparently only available as video if you're in the UK!
  10. Moderator Response: [mc] Apparently only available as video if you're in the UK!
    Darn!
    0 0
  11. Yes, just had a quick search for the BBC Orbit series and it looks like it is only currently available in the UK (officially). There appears to be an episode on Youtube, but it isn't on the BBCs Youtube account so may not be there for long. It isn't clear if the BBC are trying to sell it globally.
    0 0
  12. They might have to snip out most of the content? It appears to support the idea of a round ball-like planet going around the Sun. Might hurt sales in some regions. :p
    0 0
  13. Indeed, focusing on three months is too short to draw correct conclusions. Which is why the IPCC looks at the past 1,000 years and tests its models against data from the past 100 years. But how do we know the IPCC's time span is long enough to draw the right conclusion? Greenland ice cores tell us that 6,000 years ago was a bit warmer than today and that the last interglacial, some 130,000 years ago, was much warmer (about 3 C). But why stop there? During the Jurassic 160 Million years ago, atmospheric CO2 was about 8 times today's level and the temperature was nearly 15 C warmer than today. So how do we know that IPCC models tested against one century are correct?
    0 0
    Moderator Response:

    [DB]"Greenland ice cores tell us that 6,000 years ago was a bit warmer than today"

    Incorrect. Greenland ice cores show temps in the period you reference were similar to those of Greenland in the latter part of the 20th Century. Which are cooler than those of today. You also then infer that those regional conditions in Greenland then were global, which they were not. Unlike modern warming, which is global and is warmer than the period you reference. Even for Greenland.

    Your comments regarding the Jurassic are specious, due to conditions being vastly dissimilar to those of today.

  14. How do we know that comparisons to time periods with no similarity to the present are irrelevant?
    0 0
  15. I said : "Greenland ice cores tell us that 6,000 years ago was a bit warmer than today". Moderator says: "Incorrect. Greenland ice cores show temps in the period you reference were similar to those of Greenland in the latter part of the 20th Century. Which are cooler than those of today." I say: Richard B Alley, The Younger Dryas cold interval as viewed from central Greenland. Quaternary Science Reviews Volume 19, Issues 1-5, 1 January 2000, Pages 213-226. http://www.ncdc.noaa.gov/paleo/pubs/alley2000/alley2000.html The Alley 2000 data is available online. Here is an annotated graph of a portion of this data, clearly showing periods warmer than today in the past 10,000 years. Could you please explain your blunt dismissal of this objective observation?
    0 1
    Moderator Response:

    [DB] The Alley referenced data set uses a zero reference of 1950 (unless otherwise specified, ice core records are zeroed to 1950 by convention). Thus 95 years before present is 1855, not 2012.

    This is all fully detailed in the SkS skeptic meme rebuttal "Most of the last 10,000 years were warmer". If you wish to pursue your claim further, take it there.

    Perhaps you are unaware, but Jo Nova's blog is a known dissembler venue. And not credible.

    Please resize all graphics posted to 450 pixels width or less. Thanks!

  16. You can check the original here. Figure 1 is labelled as thousands of years before 1950. The term 'before present' may the source of the confusion: see the Wikipedia article on the technical use of the term.
    0 0
  17. Moderator has removed one comment I added after my last where I stated that the above discussion about the temperature of the past 6,000 years pulls us away from my initial criticism of this article. Allow me to restate it: With this article you have proven that three months of hindcast is too short to support accurate climate predictions. The IPCC GCM climate models are validated using data from 1900 onward. Where is the proof that one century of hindcast is strong enough to support climate predictions for the next century?
    0 0
  18. #17 Manny, you're comparing apples to oranges. The article is not a parody of a model 'hindcast', it is a parody of amateurs thinking they can predict future temperatures based on drawing a line through a tiny subset of current temperatures. The above article demonstrated that doing a regression over a short timescale (seven weeks, not three months) is insufficient to distinguish the forced winter-summer trend in San Jose, even when we clearly understand the forcing and the result. This is the same argument as someone drawing a trend line through temperature data for a decade or less (they usually start in 1998, 2002 or some other such high point), and thus claiming that they can say something about the long-term trend or the nature of its forcing. Climate models on the other hand are not based on wiggle-matching, or simple correlations / linear / multiple regressions. They are based on the fundamental physical properties of the atmosphere, land and ocean including the energy flows to, from and through each. Validation of a GCM over the past century is to confirm that the model of the Earth system (and the physics defined therein) behaves in a manner similar to that of the observed Earth system. That they do so is a powerful validation of that fundamental physics. The basic physics has to be right to replicate not only the overall warming trend, but key wiggles such as mid-century cooling or volcanic eruptions. The basic physics is then used to make projections given a furture evolution of key parameters like CO2 emissions, volcanoes, ENSO and the Sun. Do you see the difference? While some elements of the system have behaviours dominant over longer timescales (including sea level rise, ice sheet disintegration, natural carbon sequestration), most of the other dominant behaviours can be characterised by the models on the century or sub-century scale. There is no reason to think that the forces that have controlled our climate over the past millennium, and even further back through the ice ages, should have changed in their modes of operation. Do you have a reason why those forces might have changed?
    0 0
  19. I think Manny's comment implies that he/she thinks that there could be unknown natural forcings that effect climate only on century wide scales. "Proof" is a concept for mathematics not science, so it is better to say that there is no evidence for such forcings. There is a very strong believe among scientists in the conservation of energy which would require this natural forcing to manifest as a energy flow that so far has evaded detection. This is possible but highly unlikely.
    0 0
  20. Scadenp, I am male and you are criticizing me for the use of the word "proof". I recognize my error and will therefore ask for "evidence" that one century of hindcast is enough to support climate predictions for the next century. Skywatcher, I am not comparing apples to oranges, I am questioning the predictive power of the IPCC models. With your answer, you are implying that the modelers made no mistake and you are expecting me to trust you. Sorry, I do not. I want to see evidence. All I am asking is graphs of the output of the various IPCC models (there are several) vs observed temperature in order to judge the models for myself. Is this too much to ask?
    0 0
  21. Hi Manny. For a look at that predictive power, you might to look at this. The question is similar to how can you be sure that our experience of space-flight to the moon is enough to guide a space craft to pluto. The answer of course is that our confidence is based on understanding the basic physics. You should also be aware that modelling on one scale or another extends well past last century and seems adequate to explain most aspects of the evolution of climate through the history of the planet. For the evidence to support this, then please see the rather overwhelming detail found in the IPCC WG1 report. In the "Paleoclimate" (Chapter 6), you can see very much the graphs you are asking for. I would also strongly recommend you study this post from one of the modelling groups to understand what those model outputs mean.
    0 0
  22. Scaddenp, I looked carefully at all the figures (I am visual) of the WG1 Paleoclimate document. That's what I was looking for, thanks. And indeed, the models are validated over 1,000 years, not 100. To go back to the main topic here -- that validation of a model on too little data is misleading -- I cannot help wonder why, since the 1,000 yr temperature data is mainly proxy, did the IPCC modelers not extend their validation with more ancient proxy data? There are Greenland ice cores going back 100,000 years and Antarctic going back 400,000 years. All they have to do is run their computer longer. Extraordinary claims require extraordinary evidence.
    0 0
  23. I would also say that this is heading off-topic fast, so I have responded here
    0 0
    Moderator Response: [DB] Fixed link
  24. Manny #20, my wording in #18 may have led to some confusion - I'm not implying that modellers made no mistake. I am implying that they have constructed a physical representation of Earth that is consistent with observational data. It is not arbitrarily constructed either, but constructed from our fundamental understanding of heat flows, radiation and the properties of solids, liquids and gases. It could be fundamentally flawed, but as it is based on physics and not on an arbitrary regression (as in the satirical example above), it has an awfully good chance of being closer to the truth than arbitrarily drawing a line through a few years of temperature data. As such, it has a very good chance of showing us what to expect over the next century, given assumptions of certain key parameters, like CO2 emissions and long-term solar activity. I've responded here as my comment relates to misinterpreting of my #18, but further discussion of models should continue on the thread as directed by scaddenp above.
    0 0

You need to be logged in to post a comment. Login via the left margin or if you're new, register here.


The Consensus Project Website

THE ESCALATOR

(free to republish)


© Copyright 2024 John Cook
Home | Translations | About Us | Privacy | Contact Us