


 Arguments


Rahmstorf et al. Validate IPCC Temperature Projections, Find Sea Level Rise Underestimated
Posted on 29 November 2012 by dana1981
A new paper in Environmental Research Letters by Rahmstorf, Foster, and Cazenave (RFC12) takes a very interesting approach in testing the Intergovernmental Panel on Climate Change (IPCC) global warming projections, and also examines its sea level rise projections. Consistent with the previous analyses at Skeptical Science, RFC12 finds that the climate models used in the IPCC 2001 Third Assessment Report (TAR) and 2007 Fourth Assessment Report (AR4) predicted the ensuing global surface warming to a high degree of accuracy, while their central sea level rise predictions were too low by about 60%.
Novel Approach to Testing Temperature Projections
One of the principle difficulties in testing relatively recent temperature projections is that there are a lot of short-term influences on global surface temperatures that introduce noise into the data. For example, there are oceanic cycles like the El Niño Southern Oscillation (ENSO, comprised of El Niño and La Niña events), an 11-year solar cycle, and particulates released during volcanic eruptions which cause short-term cooling by blocking sunlight. Many of these short-term influences are very difficult to predict ahead of time, and when averaging many model runs together as the IPCC does, these short-term unpredictable effects on temperature tend to average out to zero.
Thus the IPCC multi-model average of simulations do not reflect these short-term temperature influences, which is not a problem for long-term predictions, because positive and negative short-term cycles and noise average out to zero over long timeframes. However, when comparing model projections to observed temperatures over just a decade or two, the short-term noise can play a significant role. RFC12 takes a very clever approach to address this issue, applying the methodology of Foster and Rahmstorf (2011), using the statistical technique of multiple regression to filter out the influences of ENSO and solar and volcanic activity from the global surface temperature data (Figure 1).
Figure 1: Global surface and lower atmosphere temperature data from 5 data sets (with a 12-month running average) before and after applying the statistical methodology of Foster and Rahmstorf (2011) to remove the influences of ENSO and solar and volcanic activity.
The paper then compares the global surface temperature data (with these three influences both included and removed) to the envelope of climate model temperature projections in both the 2001 and 2007 IPCC reports (Figure 2).
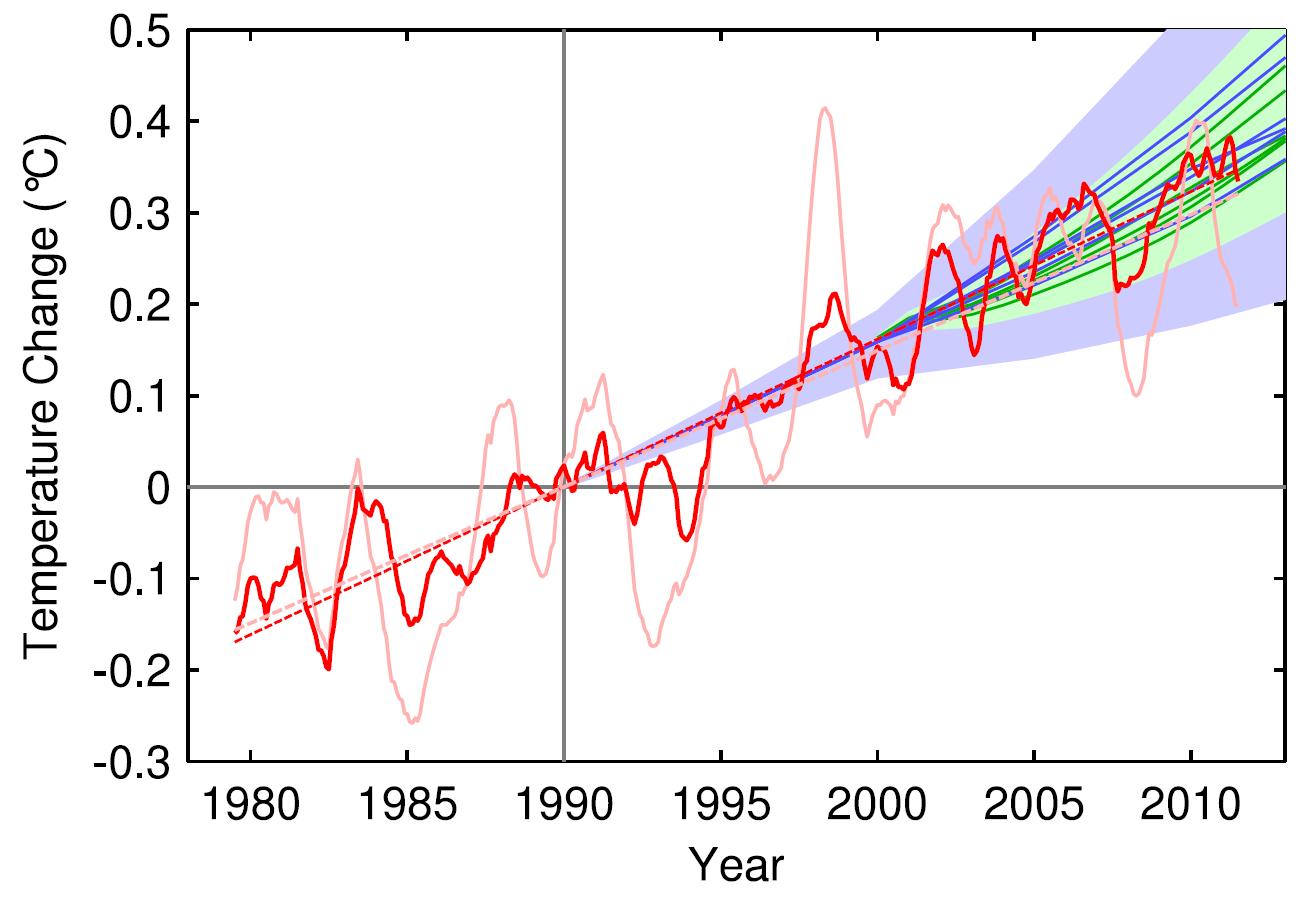
Figure 2: Observed annual global temperature, unadjusted (pink) and adjusted for short-term variations due to solar variability, volcanoes and ENSO (red) as in Foster and Rahmstorf (2011). 12-month running averages are shown as well as linear trend lines, and compared to the scenarios of the IPCC (blue range and lines from the 2001 report, green from the 2007 report). Projections are aligned in the graph so that they start (in 1990 and 2000, respectively) on the linear trend line of the (adjusted) observational data.
IPCC Has Accurately Projected Global Surface Warming
As Figure 2 shows, the unadjusted data (pink) have tended to fall towards the lower end of IPCC projections in recent years, primarily due to the preponderance of La Niña events and an extended solar cycle minimum, which have short-term cooling influences on global surface temperatures. However, when these influences are filtered out (red), the observed temperatures fall very close to the central climate model projections, which RFC12 notes are based on greenhouse gas emissions scenarios that accurately reflect the observed CO2 changes over that timeframe.
In short, the global climate models used in the IPCC reports have been very good at predicting the underlying human-caused global surface warming trend, beneath the short-term noise which will average out to zero over time. This suggests that IPCC projections of future global warming, which are based on various possible human greenhouse gas emissions scenarios, are reliable.
IPCC Has Underestimated Sea Level Rise
It's well-known that the IPCC almost certainly underestimates future sea level rise, because their models do not include the effects of dynamic ice processes. Most sea level rise from ice melt comes from chunks of ice breaking off into the ocean, then melting. This calving process is accelerated by warming, but the dynamic processes are not well understood, and are thus not represented in climate models. By the year 2100, the 2001 IPCC report predicted between 20 and 70 centimeters (cm) of sea level rise, while the 2007 report predicted between 18 and 59 cm over that timeframe, depending on how much greenhouse gas emissions change in the future.
However, subsequent research has predicted significantly higher sea level rise by 2100. For example, Vermeer and Rahmstorf (2009) used a semi-empirical method linking temperature changes to sea level rise, which they validated by comparing observed sea level to reconstructed sea level calculated from global temperature observations from 1880 to 2000. Using this method, the projected global sea level rise by 2100 is significantly higher than the IPCC projections, between 75 and 190 cm (Figure 3). Several other recent studies have also projected that global mean sea level rise by 2100 will be close to 1 meter.
Figure 3: Projection of sea-level rise from 1990 to 2100, based on IPCC temperature projections for three different emission scenarios. The sea level range projected in the IPCC AR4 for these scenarios are shown for comparison in the bars on the bottom right. Also shown in red is observed sea level (from Vermeer and Rahmstorf 2009).
RFC12 compares the historical sea level tide gauge data from Church and White (2011) and recent satellite altimetry sea level data (orange and red in Figure 4, respectively) to the 2001 and 2007 IPCC report model projections (blue and green in Figure 4, respectively). The observational data in Figure 4 are aligned so that extending the satellite best-fit line (red) back to 1990 will match the IPCC projections at that date, where the IPCC TAR model runs begin.
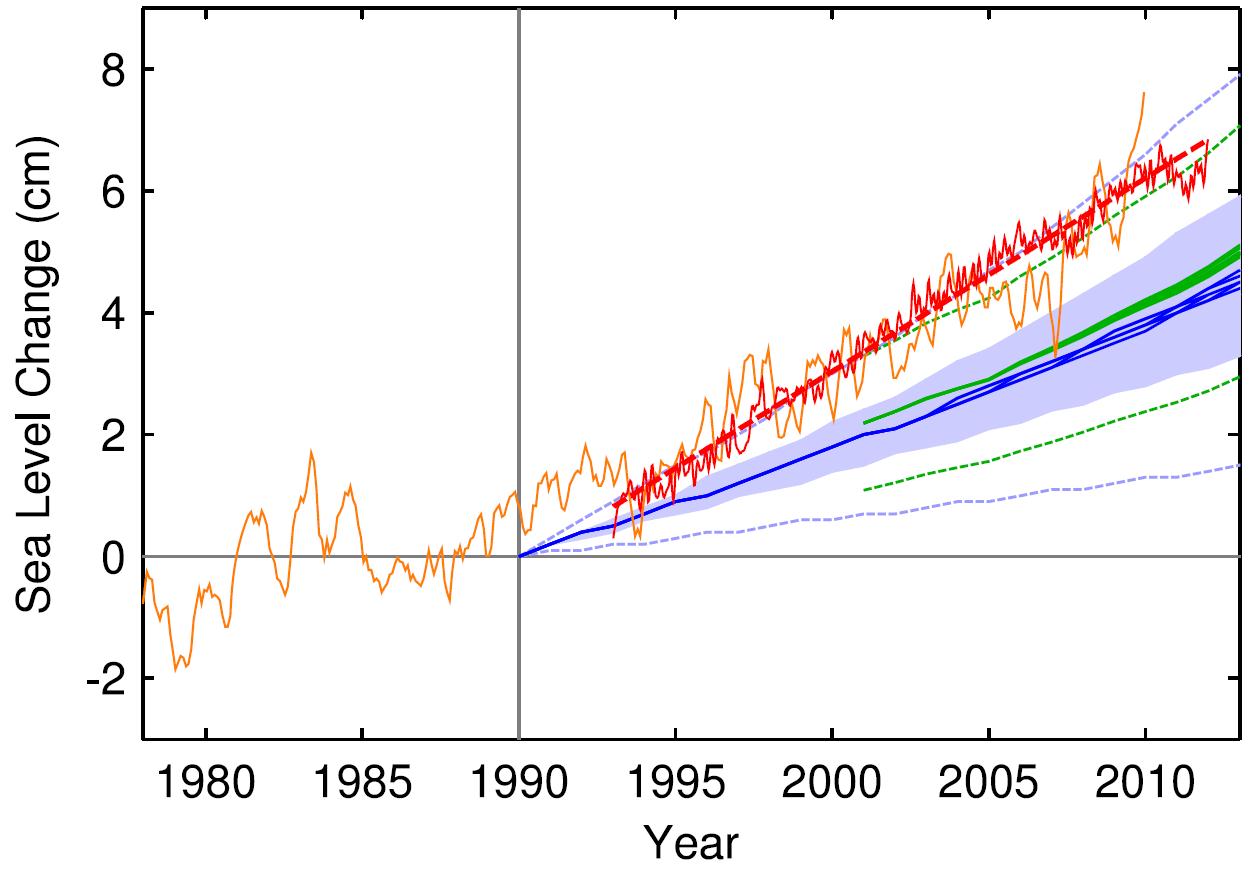
Figure 4: Sea level measured by satellite altimeter (red with linear trend line; AVISO data from (Centre National d’Etudes Spatiales) and reconstructed from tide gauges (orange, monthly data from Church and White (2011)). Tide gauge data were aligned to give the same mean during 1993–2010 as the altimeter data. The scenarios of the IPCC are again shown in blue (third assessment) and green (fourth assessment); the former have been published starting in the year 1990 and the latter from 2000.
The authors conclude as follows.
"The satellite-based linear trend 1993–2011 is 3.2 ± 0.5 mm yr-1, which is 60% faster than the best IPCC estimate of 2.0 mm yr-1 for the same interval"
IPCC Likely Underestimates Future Sea Level Rise
RFC12 notes that global climate models also underestimate the sea level rise during 1961–2003 by approximately 50%; therefore, the underestimate of recent sea level rise more likely due to a systematic bias than recent short-term effects. This suggests that IPCC projections of future sea level rise will similarly be biased low. The paper then compares the current rate of sea level rise to the IPCC projections, and finds that they are only consistent for the highest IPCC sea level projections (Figure 5).
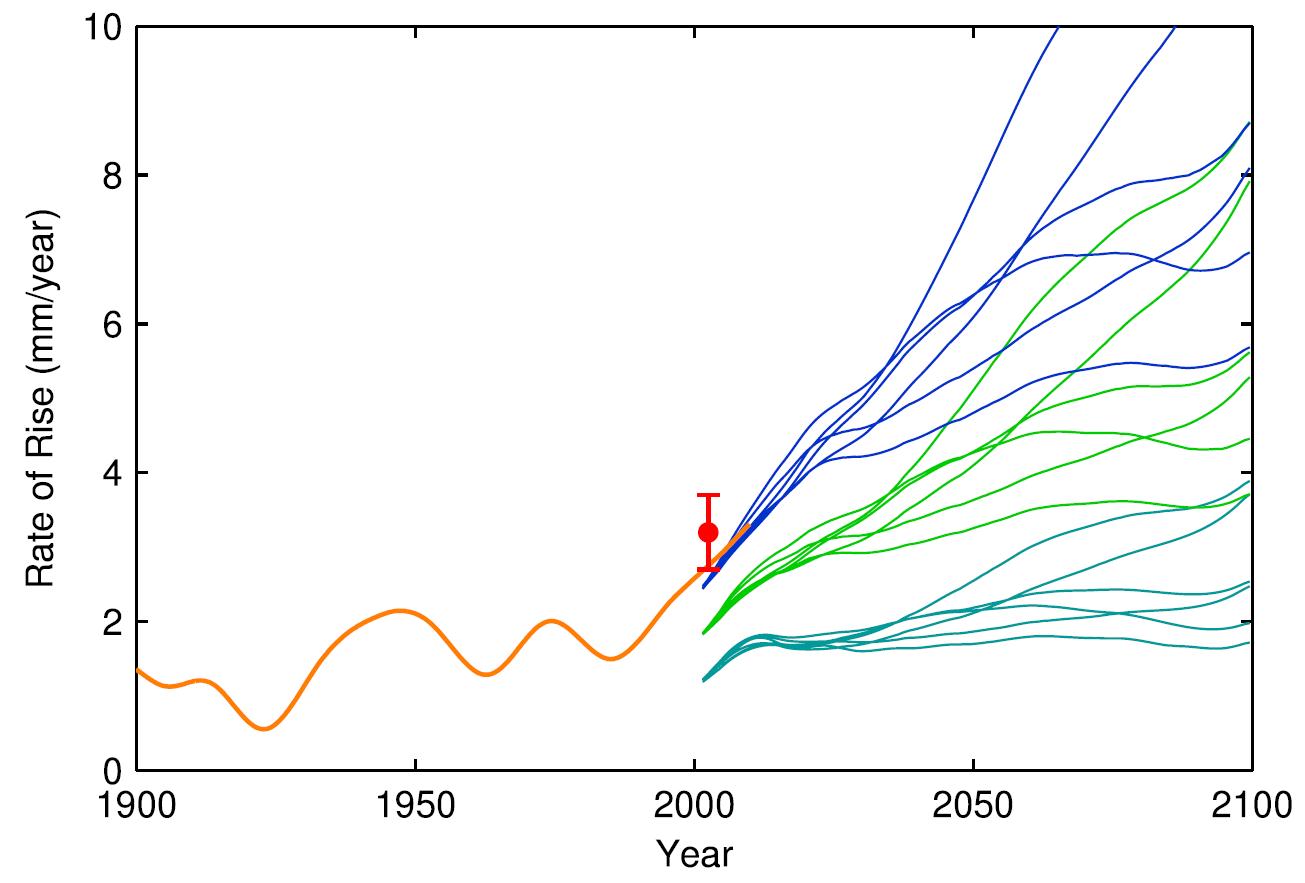
Figure 5: Rate of sea level rise in past and future. Orange line, based on monthly tide gauge data from Church and White (2011). The red symbol with error bars shows the satellite altimeter trend of 3.2 ± 0.5 mm yr-1 during 1993–2011; this period is too short to determine meaningful changes in the rate of rise. Blue/green line groups show the low, mid and high projections of the 2007 IPCC report, each for six emissions scenarios. Curves are smoothed with a singular spectrum filter (ssatrend; Moore et al. 2005) of 10 years half-width.
However, since the models used in the IPCC report do not include dynamic ice melting processes, as noted above, even the highest IPCC projections will likely continue to underestimate future sea level rise.
Debunking the Myth that the IPCC is Alarmist
To summarize, contrary to the myth that the IPCC is alarmist, RFC12 shows that in reality the IPCC report has accurately projected the human-caused global surface warming trend over the past two decades, and has underestimated global mean sea level rise by approximately 60%. Thus the IPCC future global temperature projections appear to be reliable, while its future sea level rise projections appear to be too conservative, primarily because they do not account for dynamic ice melting processes.
Note: this post has been incorporated into the intermediate rebuttal to the myth that the IPCC is alarmist


 0
0  0
0 [Source]
(please, update the comment policy: the HTML image hyperlinks do not work, likely because the text indicated there to write is incomplete)
This happens despite being in an ENSO-neutral year. It is obvious that that La Niña that caused a brief dip in sea level is now history. Surely the record melt in Greenland contributed to this(even if I don't know how much of the spike is due to Greenland melt)
[Source]
(please, update the comment policy: the HTML image hyperlinks do not work, likely because the text indicated there to write is incomplete)
This happens despite being in an ENSO-neutral year. It is obvious that that La Niña that caused a brief dip in sea level is now history. Surely the record melt in Greenland contributed to this(even if I don't know how much of the spike is due to Greenland melt)
 I suspect that the figure you've seen refers to the rate of CO2 emission increasing by a third, but not the CO2 concentration increasing by a third.
In addition, the 2.0-4.5 degrees refers to the warming expected at equilibrium, and in reality it takes a while for the atmosphere and oceans to warm up. When atmospheric CO2 hits 560ppm, the warming observed at that point will in fact be a bit lower than 2.0-4.5 degrees, as it takes a few decades for the earth to catch up.
I suspect that the figure you've seen refers to the rate of CO2 emission increasing by a third, but not the CO2 concentration increasing by a third.
In addition, the 2.0-4.5 degrees refers to the warming expected at equilibrium, and in reality it takes a while for the atmosphere and oceans to warm up. When atmospheric CO2 hits 560ppm, the warming observed at that point will in fact be a bit lower than 2.0-4.5 degrees, as it takes a few decades for the earth to catch up.


Comments