


 Arguments


Reconciling Two New Cloud Feedback Papers
Posted on 19 February 2013 by dana1981
The role of clouds as a climate feedback – whether they amplify or dampen global warming, and by how much – is one of the largest remaining uncertainties in climate science. Climate contrarians will often invoke the cloud feedback, claiming that they will dampen future global warming so much that future climate change will be too small to worry about. Dessler (2010) estimated the short-term cloud feedback using measurements by the Clouds and the Earth’s Radiant Energy System (CERES) instruments on NASA's Terra satellite from March 2000 to February 2010, finding that the net feedback is fairly small, but most likely positive (amplifying global warming).
Two new papers on the subject are now out, An analysis of the short-term cloud feedback using MODIS data by Zhou, Zelinka, Dessler, and Yang, and Impact of dataset choice on calculations of the short-term cloud feedback by Dessler and Loeb. As the titles suggest, Zhou et al. use cloud measurement data from the Moderate Resolution Imaging Spectroradiometer (MODIS), also on NASA’s Terra satellite over the same 2000–2010 timeframe, while Dessler and Leob examine how the use of different clear-sky top-of-atmosphere (TOA) energy flux and surface temperature measurements change the results using the approach in Dessler (2010).
The scientists find that they get slightly different results for the short-term cloud feedback when using MODIS and CERES data. Dessler (2010) found a short-term global cloud feedback of 0.54 ± 0.74 Watts per square meter per Kelvin (W/m2/K) using CERES, while Zhou et al. (2013) estimates the feedback at -0.16 ± 0.83 W/m2/K using MODIS data. The uncertainty ranges overlap, but obviously the most likely value in the former is positive, and in the latter is negative. Dessler and Loeb confirmed that the CERES-based results in Dessler (2010) are robust, differing by just 0.2–0.3 W/m2/K when using different TOA flux measurements, though differing by as much as 0.8 W/m2/K with different temperature datasets.
In either case, the evidence indicates that the short-term cloud feedback is a relatively weak one. Zhou et al. suggest that the result using MODIS data is biased low, which would indicate that the feedback is probably positive, slightly amplifying global warming.
Cloud Background
Clouds have two competing effects on global temperatures – they have a cooling effect by reflecting sunlight back into space, and they have a warming influence via the greenhouse effect. Overall the net effect is one of cooling, but when the climate warms, whether this results in more of the cooling or warming cloud influence depends on which types of clouds tend to increase in a warmer world (Figure 1).
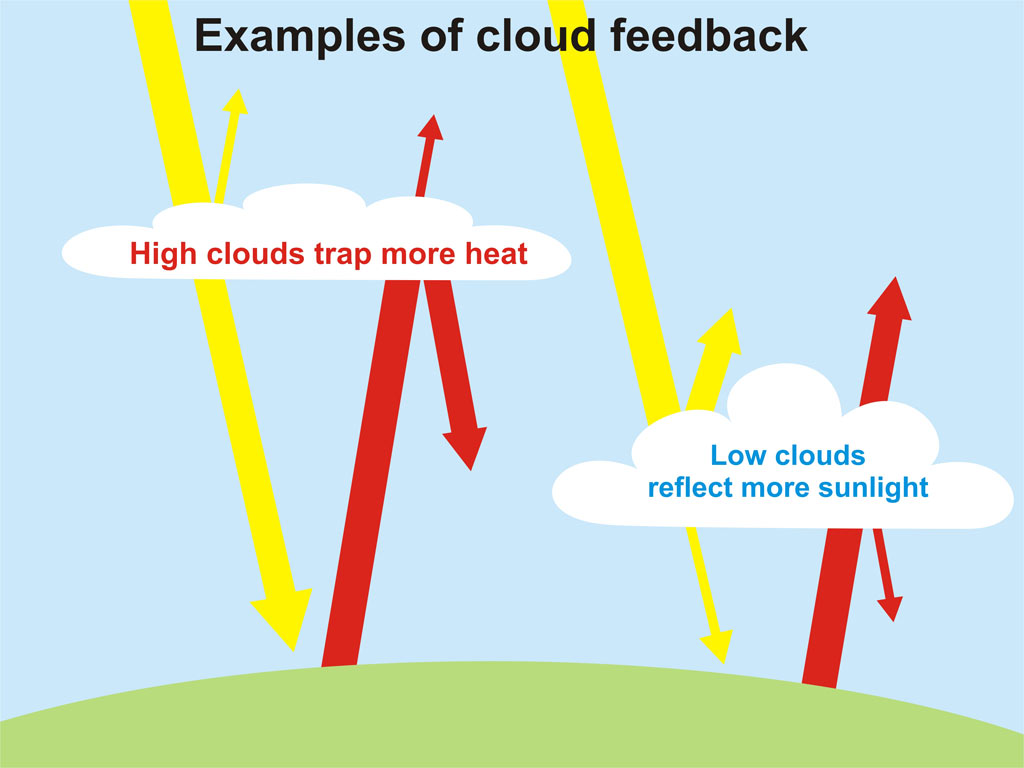
Figure 1: Examples of global warming feedback effects by high and low elevation clouds
As Zhou et al. note, the uncertainty as to how clouds will respond to a warming world is one of the largest contributors to the uncertainty in climate sensitivity (the total amount of warming in response to a global energy imbalance, e.g. caused by an increased greenhouse effect, including feedbacks). Over the past several decades, climate scientists have been unable to narrow the possible range of climate sensitivity values, which remains at 2 to 4.5°C global surface warming in response to a doubling of atmospheric CO2.
This is why cloud feedback research is important, to try and narrow that range down so that we can more accurately predict how much global warming to expect in the future. However, since we only have good satellite cloud observations since 2000, scientists can only estimate the short-term cloud feedback, which may be different than the long-term cloud feedback.
Both of the studies discussed here estimate the short-term cloud feedback by calculating the cloud contribution to the change in incoming and outgoing energy at the top of the atmosphere over the past decade, and comparing it to changes in surface temperature over the same timeframe.
Dessler and Loeb (2013) CERES Analysis
As in Dessler (2010), Dessler and Loeb estimate the cloud feedback by taking the difference between the observed incoming and outgoing energy at the top of the atmosphere (TOA flux, or ?Rall-sky), and what it would be if the sky were clear with no cloudcover (?Rclear-sky), and comparing this result (?Rcloud) to the change in global surface temperature.
Dessler and Loeb estimate ?Rclear-sky and ?Rall-sky using various different satellite instruments and methods. They find that ?Rall-sky is consistent between the three CERES instrument datasets they examine, but there is larger variation in the ?Rclear-sky estimates.
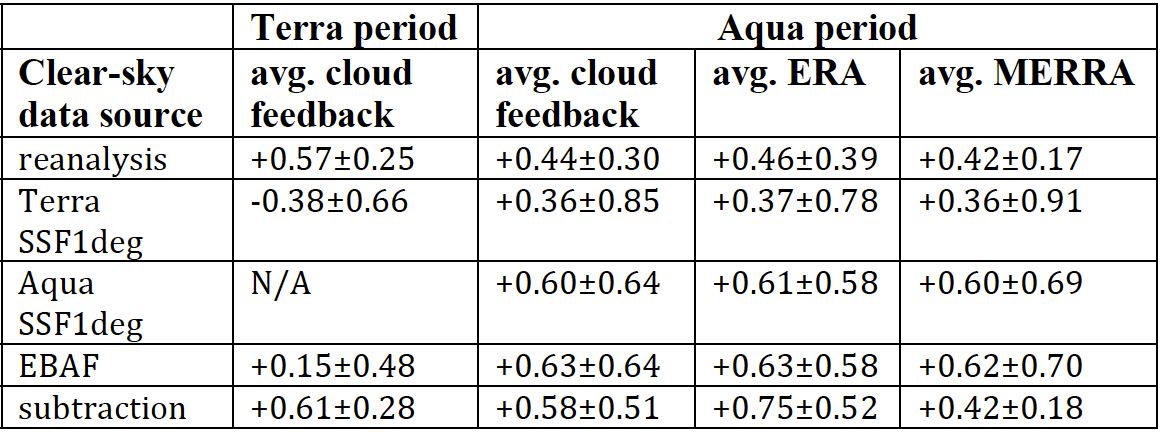
Dessler and Loeb also estimate the cloud feedback using a different methodology that does not require a ?Rclear-sky estimate, which they call the "subtraction method" and involves subtracting the contributions to TOA flux due to other non-cloud factors from ?Rall-sky, leaving just ?Rcloud. Using the subtraction method results in a cloud feedback estimate ranging from +0.28 to +0.84 W/m2/K, with a most likely value of 0.61 W/m2/K. This is in very good agreement with the results of Dessler (2010), and most of the other results in Dessler and Loeb (2013), which are summarized in Table 1.
Table 1: Average of the total cloud feedback values in W/m2/K. The Terra period covers March 2000–June 2011, the Aqua period covers July 2002–June 2011. The average ERA and MERRA columns are the average of the feedbacks using those reanalyses for the cloud radiative forcing adjustments.
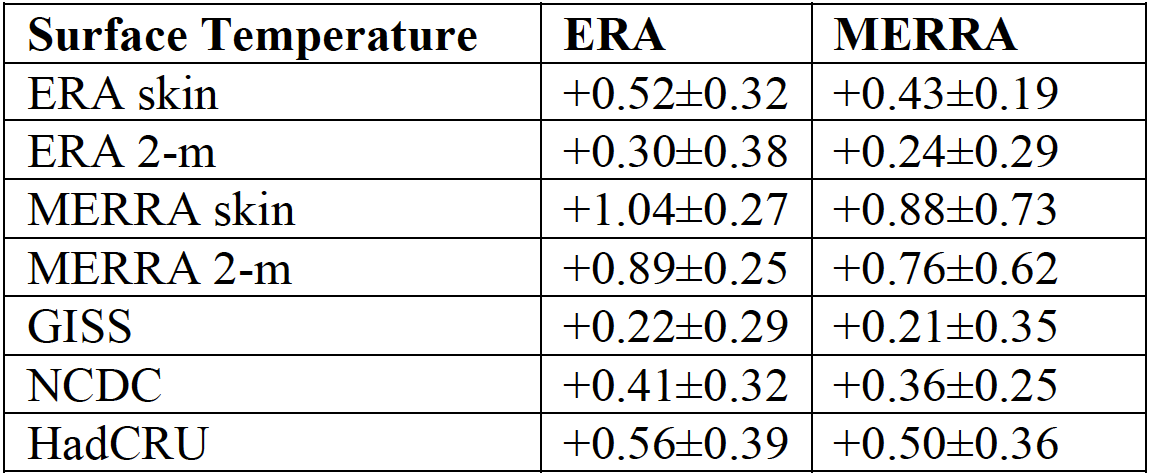
Using different global surface temperature datasets made a bigger difference in the cloud feedback result (Table 2).
Table 2: Average of the ensemble of total cloud feedbacks calculated using a single
surface temperature data set, in W/m2/K. The feedbacks are calculated over the Aqua period, July 2002–June 2011. The averages are broken into ERA and MERRA, which is the reanalysis that was used for the cloud radiative forcing adjustments.
Overall, Dessler and Loeb conclude that the Dessler (2010) result of a weak but likely positive short-term cloud feedback is robust across the many different datasets.
"These results, when appropriately weighted by a critical evaluation of the relative strengths of the data sets, strongly support the conclusion of D10 of the existence of a likely positive cloud feedback ... Putting everything together, this analysis provides strong evidence supporting D10’s contention that the short-term cloud feedback over the decade of the 2000s was likely positive."
This paper was also intended to investigate the conclusions of Masters (2012), which argued that, using other datasets, one could get a strong negative cloud feedback. Dessler and Loeb (2013) showed that this result was due to problems in the CERES data, and that overall, the short-term cloud feedback value obtained by Dessler (2010) is a robust estimate from the CERES data.
Zhou et al. (2013) MODIS Analysis
As in the Dessler studies, Zhou et al. examine the cloud contribution to the change in energy flux at the top of the Earth's atmosphere, but in their case they use MODIS data to estimate the change in cloud cover in order to calculate ?Rcloud. The goal of this paper was to test the Dessler (2010) results using a completely independent dataset.
A useful aspect of MODIS is that it allows Zhou et al. to break the cloud feedback down by cloud type, which cannot be done with the CERES data. As with Dessler and Loeb, Zhou et al. examine how their results vary using different surface temperature datasets. The results are summarized in Table 3.
Table 3: Summary of global average cloud feedbacks in W/m2/K, uncertainties are ±2σ
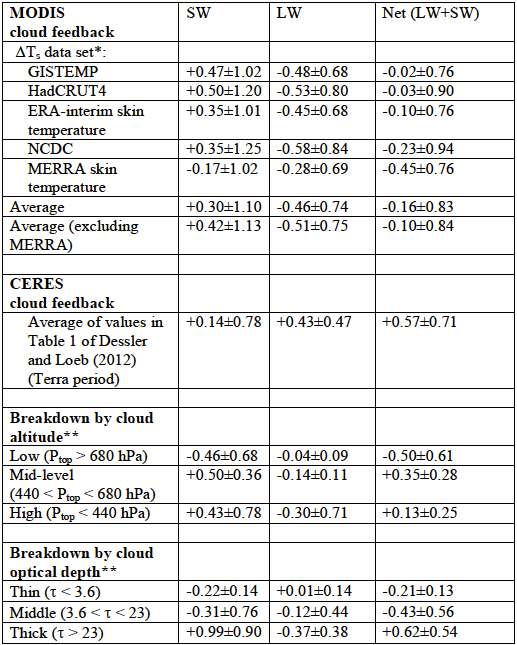
*Source of ?Ts data: GISTEMP: Hansen et al. (2010); HadCRUT4: Morice et al. (2012); ERA-interim: Dee et al. (2011); the National Climatic Data Center (NCDC): Smith et al. (2008); NASA’s Modern Era Retrospective-analysis for Research and Application (MERRA): Rienecker et al. (2011);
**calculated using GISTEMP ?Ts.
As the fourth column in Table 3 illustrates, all of the most likely cloud feedback results using MODIS data are slightly negative, whereas the Dessler and Loeb results are positive.
Resolving the Discrepancies
Zhou et al. note that their MODIS shortwave radiation estimates (the cooling effect of clouds by reflecting radiation back into space) are in good agreement with the Dessler CERES results; the difference mainly comes from a smaller longwave radiation estimate (increased cloud greenhouse effect) in MODIS as compared to CERES. Zhou et al. note that several issues have been identified with the MODIS data. For example, the satellite has difficulty identifying thin clouds, and it cannot make nighttime observations, both of which would have a larger effect on the longwave radiation measurements. The authors conclude that the cloud feedback estimate based on MODIS data is most likely biased low.
"Putting everything together, it is our judgment that the global-average cloud feedback from CERES is likely to be more reliable than the values obtained from the MODIS measurements. But even with potential global-average biases, the MODIS calculation is useful because it allows us to break the cloud feedback down by cloud type, something that cannot be done with the CERES data."
What it all Means
The Zhou et al. paper ends by emphasizing that they are evaluting the short-term, not long-term cloud feedback.
"That this work is an analysis of the cloud response to short-term climate variations is an important caveat. Previous work has shown little correlation between the cloud feedback in response to these short-term (mainly ENSO) climate variations and the response to long-term global warming (Dessler, 2010; Colman and Power, 2010; Dessler, 2012). Thus, the implications of this for long-term global warming are unclear."
Nevertheless, both of these papers show that the short-term cloud feedback is relatively small, and most likely slightly positive (amplifying global warming). Dessler's group is also looking at other datasets to try to obtain another short-term cloud feedback estimate to help reduce the uncertainty.
Regarding the long-term feedback, for now we will have to be satisfied with the many different lines of evidence that the net overall climate feedback is strongly positive, and climate sensitivity is between 2 and 4.5°C global surface warming in response to a doubling of atmospheric CO2.
Note: these results have been incorporated into the Intermediate rebuttal to the myth 'clouds provide negative feedback'.


But one question remains, not matter what the temperature does, more co2 in our envirnoment means that our environment must buffer this change.
Thank-you for this summary of these recent papers. As one who does not have access to these paywalled documents, I really appreciate your efforts to bring the science to more people.
I am confused by one part of the post. If I understand correctly, Dessler (2010) and Dessler and Loeb (2013) both used CERES data. Zhou et al used MODIS data. The post comments on the benefits and shortcomings of both data sets.
However, the post also states: The Dessler and Loeb (2013) "paper was also intended to investigate the conclusions of Masters (2012), which argued that, using other datasets, one could get a strong negative cloud feedback. Dessler and Loeb (2013) showed that this result was due to problems in the CERES data..."
Do Dessler and Loeb (2013) show Master's (2012) results to be because of a problem in the Ceres data? Or in the manner Masters (2012) treated/handled/analyzed those data?
Thank-you.
If MODIS does not see clouds at night, that is pretty significant, because clouds at night have no albedo effect (=negative feedback) and so their only effect can be their insulating property (=positive feedback). So no wonder MODIS evaluations show more negative feedback.
I'm a little confused about where the earlier stuff - AR4, for example, had the effect of clouds as overall fairly negative (something like 44 W/m2 SW reflected vs 31 W/m2 LW retransmitted downward - fits into this newer work.
Am I correct in saying that Dessler and Loeb and Zhou are actually looking at what happens to cloudiness and its effects on the short-term radiation balance as the climate changes ('inverse sensitivity', from the units they use), and the AR4 numbers apply to global averages over the long term? The 'inverse sensitivity' numbers don't make a lot of sense otherwise (for example the 44 W/m2 of SW reflection by clouds is supposed to cool the planet by ~12oC, giving 3.7 W/m2/K, compared to the more recent values that are about 10x smaller.
danp @2 - sorry, I don't have Dessler's paper on me, so I can't clarify. That was a comment Dessler suggested that I add when he reviewed the post, and I didn't focus on that part of the paper, so I don't recall the details.
Jsquared @4 - yes, we're talking about the cloud feedback in response to global warming here.
I am new to this site and I hope you will forgive the naivete of this inquiry, bt I would like to know if the large, wide swaths of cloud left behind many airliners are having a negative or positive effect on global warming, or perhaps less confusingly (since a positive, feed-forward effect would be "negative" for us) are they, as per the diagram, low enough to be reflecting more sunlight or high enough to be trapping more heat? Also, could someone explain why these trailing clouds look so different from the contrails I remember seeing in my youth?
dana1981@5 - There has to be some good physics in that order-of-magnitude difference in the size of the responses. What could be so different in the short-term and long-term response of water vapor? All that comes to mind offhand is that aerosols don't have a chance to do their thing - nucleation - in the short-term response, or maybe it's a latitudinal effect built into the CERES and MODIS measurements? It's a little hard to give either one much credence.
Citizen 7,
The exact effect is unknown. In daytime, contrails reflect sunlight and so have a cooling effect. In both daytime and nighttime, contrails also have a warming greenhouse effect.
Airplane Contrails Boost Global Warming, Study Suggests
Global radiative forcing from contrail cirrus -- Ulrike Burkhardt and Bernd Kärcher
Airplane contrails worse than CO2 emissions for global warming: study
Atmospheric science: Seeing through contrails -- Olivier Boucher
As to why contrails now may appear differently than those from yesteryear, consider that the atmosphere today has some 4% greater humidity levels than that of just 40 years ago. Since contrails are essentially water vapor, that will effect dissipation and spreading.
This site is a useful reference for more information on contrails (I use it to debunk the chemtrailers):
http://contrailscience.com/how-to-debunk-chemtrails/
My goodness... there's a conspiracy for everything, isn't there?
I'll bet there's even a conspiracy to spread conspiracies (thus hiding the one, true conspiracy that they don't want us to figure out).
I hear ya. I hear there's even a blog post on some blog somewhere detailing those kinds of conspiracies...and others...
Thank you, Sphaerica, for the references; the longer Nature Climate article by Burkhardt and Karcher is especially informative. I notice that they speak of contrail cirrus as "a new cloud class," at least for their model, however, and their first set of graphics shows significant foci of young, linear contrails almost exclusively over Europe and eastern North America, something that seems to merit more explanation unless the air traffic in those areas is much, much greater than elsewhere. And I'm pretty sure I did not observe these prominent, persistent bands of clouds in the sky overhead before just a few years ago, whereas I see them regularly now--did the amount of air traffic go up suddenly? I am wondering about how new this phenomenon is, and why the geographical concentration--is there a clear correlation with the quantity of air traffic, over both time and space? Does anyone have data about this?
I also appreciate the information from Daniel Bailey that the atmosphere has "some 4% greater humidity levels" than 40 years ago--is that a direct result of global warming, or are there other factors involved? I can see how such a change might lead to a different appearance of the trails left by aircraft between now and then, though presumably such a change would have been slow and gradual. Would you say this is the primary reason they appear so prominent now?
There seems to be quite a bit of scientific uncertainty about this phenomenon, given the numerous qualifiers in the paper, but I am very glad to read a serious scientific discussion of it, rather than encountering the kind of immediate denial/debunking response I've had from some, who will kind of nervously maintain that the skies have ALWAYS looked like they do now. No, they have not. I think it's important--and surely what is required for good science--to stay with the testimony of our own eyes rather than yield quickly to "what others say," as in the Solomon Asch experiments (e.g., http://www.age-of-the-sage.org/psychology/social/asch_conformity.html). In some cases the "conspiracy theory" label is used to prevent people from demanding good scientific explanations for what they see, such as the sudden and perfectly symmetrical descent of WTC 7, when official versions seem to be lacking in explanatory power (as apparently at least one of other the posters here--funglestrumpet?--seems also to have noticed.
Citizen 7... You're actually breaking the very first rule of science in saying contrails look different to you today than they did just a few years ago. That rule is: Don't trust your senses! Human perception is the worst measuring device known to man.
If you think there "might" be a difference, what you have to do is find a way to test that hypothesis. Find a way to measure the phenomenon you believe you're seeing. Find ways where you can make sure your perception is not fooling you.
This statement is immediately suspect: "...who will kind of nervously maintain that the skies have ALWAYS looked like they do now. No, they have not."
When you start from a position that you are correct before you have methodically tested that your perception you're merely listening to your need to find something there, regardless of whether something is there or not.
You state, "In some cases the "conspiracy theory" label is used to prevent people from demanding good scientific explanations for what they see..." But you do not yet know for sure that you actually see what you believe you see.
Before you test your idea you can do nothing but get into a battle of different faulty perceptions. I've been around a good number of years. I'm a GA pilot so I've long watched the sky for cloud formations and with special interest in aircraft. I have never noticed a change in contrail formations.
But I would also not rule it out until I saw strong empirical evidence one way or another.
And yet, Sph and DB, the actual, well-documented conspiracies (reviewed in Merchants of Doubt) are simply ignored. Too much evidence, I guess. Takes all the mystery out of it.
Citizen 7 @ 6: "could someone explain why these trailing clouds look so different from the contrails I remember seeing in my youth"
Answering a question with several other questions:
- how long ago was it that you were a "youth"? That could be 10, 20, 30, or 70 years ago.
- where were you a "youth", and is it a different place from where you are today?
Why am I asking? Well, contrails form because aircraft engines give off water vapour (combustion byproduct). Under the right conditions (air close to saturation), the vapour will condense to liquid water or sublimate to ice crystals, forming contrails. If there is enough mixing in the air, the contrails will rapidly dissipate and be thin and short-lived. If the air is very stable and very close to saturation, the contrails may last quite a while and be quite thick.
The appearance of the contrail will depend on the amount of water vapour released, the local temperature and humidity, and the local atmospheric motions - which can depend on the height the aircraft is flying at, the current weather, and the season. The amount of water vapour released will depend on the fuel consumption, which depends on engine and aircraft design and efficiency.
When I was a "youth", there were still a lot of piston-engined aircraft around. Now, there are highly-efficient jets that often fly at higher altitudes. A lot of factors to consider, only some of which relate to the atmospheric conditions.
[...speaking as a professional atmospheric scientist and former amateur pilot...]
Citizen 7, as a proof source, the atmospheric increase in water vapor statement comes from Trenberth, Fasullo and Kiehl 2009 (p. 317), and is best illustrated by this graphic:
[Graphic source: personal communication with Dr. Trenberth]
I once worked on a contrail formation and mitigation project with Boeing researchers and can add a little to Bob Loblaw @15's comments about contrail frequency. Jet engines inject heat, water vapor, and soluble and insoluble particles (e.g., sulfates and soot) into the ambient conditions, and if the environment is super-saturated with respect to ice, then ice crystals that nucleate on these particles will grow and spread to form "contrail cirrus" (nice summary here). Contrails form by the same processes as cirrus cloud particles, called homogeneous and heterogeneous ice crystal nucleation, generally in the upper troposphere at temperatures below about -40C if the air is ice-supersaturated. When air reaches 100% RH it is saturated with respect to liquid water and water droplets will nucleate around aerosols in the air, but below 0°C water vapor reaches saturation with respect to ice at a lower RH that decreases with decreasing temperature. For example, at -40C water vapor is in equilibrium with an ice crystal at 67% RH, so if the environment is at 80% RH (supersaturated with respect to ice) then a contrail ice crystal will grow, but at 66% RH it will sublimate and disappear and a contrail won't persist).
There weren't many contrails before there were jet engines injecting moisture and particles into the atmosphere. The physical and optical characteristics of contrails can and have changed over time due to changes in aircraft fuels (which changes the composition, concentration, and physical properties of the ice-forming nuclei), and changes in engine efficiency (cooler exhaust in more efficient engines increases the likelihood of contrail formation).
The project I worked on with Boeing was to quantify contrail-forming conditions at sites in the U.S., UK, and Germany based on radiosonde temperature and humidity data, such as determining contrail-formation probability distributions over some city as a function of time-of-day and season, and characterizing the thickness of ice-supersaturated layers. Boeing used these data to evaluate strategies for mitigating contrail formation by changing the flight level by 2000-4000 feet if the aircraft is in a contrail-forming layer, and looking at the tradeoff with the extra fuel burned to change from the optimal flight level.
The above link also points toward contrails having a net warming effect on climate, just like cirrus clouds.
This article is a clear demonstration of the difference between the arguments of climate scientists and climate deniers. Here all the available evidence is presented before a conclusion is reached and the reader can go back to source and make his own evaluation. Climate deniers sound like preachers. Everything is clear and worked out and the conclusions are in no doubt. In itself, it doesn't proove that the climate scientists are correct but it sure gives one more confidence that they are on the right track (and that they will change their conclusions if contrary evidence is found). Some of us need certainty in our lives so much that we become religious and become climate change deniers. It is so much more comfortable than wrestling with the evidence but so much less satisfying. I wonder if the insane level of PC and lack of "hard" subjects in our schools is partially to blame. We no longer study euclidian geometry starting with SAS and ASA and building the whole structure from scratch. There are no longer any winners and loosers and competition is to the bottom instead of to the top. It's not cool to be the top student any more.
I've spent quite a bit of time today studying the two papers in Nature Climate Change on contrail cirrus that Sphaerica so kindly provided as references, and I want to say I really appreciate the insight into how this phenomenon is being discussed by atmospheric scientists. I am also rather intrigued by the way people who inquire about the phenomenon are sometimes treated, even on this list--like they have become misled by an idea that has cooties on it and needs to be batted away, "debunked," in the same way the very notion of global warming is "debunked" by the climate change denialists. No, DSL, books like Merchants of Doubt are not being ignored; various kinds of academics are starting to analyze the process. Denial is a very real psychological/social phenomenon that results when important strands in one's--and one's social group's--belief bubble are being challenged. And of course the "belief bubble" that we all inhabit, which takes for granted assumptions like the notion that our human enterprise must continue to "grow" ad infinitum, is challenged by the discovery that if we keep doing what we're doing, only more and more of it, we're going to shove the planetary system into a new and inhospitable state--so of course there's a lot of implicit climate change denial in the fact that we all keep marching in lock step, even if only certain well-funded think tanks are generating the explicit kind of denial that you're trying to challenge on this website.
But there are multiple other layers of denial as well, "new rules" and new realities that we don't want to face--climate change almost seems to be one of the easier ones, especially since it's getting to be more and more "in our faces" all the time, but we're going to have to penetrate all of them eventually.
I gather from the papers in Nature Climate Change several things about what is being called "aviation-induced cloudiness," which apparently can result from two different mechanisms, the fanning out of ice crystals from aircraft contrails into high, cirrus-like clouds, and also aerosols of soot and other particulates emitted by aircraft that could serve as nuclei for ice crystals. Modeling the effects of contrail formation and spread demonstrated that spreading "contrail cirrus" clouds increase radiative forcing by a considerable amount--a net globally of 37.5 mW per square meter, and up to 300 mW per sq m over the eastern U.S. and central Europe. Boucher goes on to say that "overall, and despite their short lifetime, contrails may have more radiative impact at any one time than all of the aviation-emitted carbon dioxide that has accumulated in the atmosphere since the beginning of commercial aviation." That sounds to me like a pretty significant statement, even if aviation is only responsible for "an estimated 2-14% of anthropogenic climate forcing." It sounds, in fact, like an important item to throw in the mix if you come across people concerned about what they're seeing in the sky, to get them concerned about climate change, instead of making fun of them.
Boucher notes that "both ground- and satellite-based cloud observations have suggested a small but noticeable increase in regions of high air-traffic density." And Burkhardt and Karcher specifically identify the southeastern U.S. is as having "coverage" by the young, linear contrails of up to 1%, the highest figure given for that kind of cloud. I happen to live in the southeastern portion of the U.S., and I know what I see in the sky now is qualitatively and quantitatively different from what I saw only a few years ago, when contrails might be seen sometimes but never 10, 12, 15 of them lining up from horizon ro horizon, or fanning out into herringbone patterns of cirrus to cover half the sky and more.
On the "chem trail debunking" website, old photos are being presented purporting to show that "it's always been like this"--that's crap, and I greatly resent this Orwellian attempt to rewrite history. There may be a few photos of such things appearing now and then, going way back--I did see short, transient contrails from time to time as far back as I can remember--but the kind of huge, dominating formations that I see now, no--that would have been a very occasional thing, if it ever occurred. I grew up in and around the "picture postcard" St. Pete beaches before there were condos lining every shoreline, and if there had been lots of contrails crisscrossing the skies they would have stood out like a sore thumb. In contrast, there are some mornings these days when I feel like I'm living in some kind of Stephen King novel--"under the dome" of "aviation-induced cloudiness," of whatever cause.
So to me, someone who with great emotion flat-out denies that there's anything different going on in the skies today, at least where I live, is engaging in something very like climate change denial. There's a certain belief bubble that will apparently be threatened if some new information is admitted. And that doesn't seem very scientific to me at all--rather, it's a clinging to the "old paradigm," as Thomas Kuhn describes, and reinforced by a kind of groupthink--you don't want to believe something, and the people you talk to don't want to believe it either, so you all reinforce each other's erroneous but deeply held beliefs--it works to keep thoughts of climate change tidily at bay, why not other discomfiting thoughts? The same kind of denial seems to mark the reluctance of the scientific community to weigh in on the physical events of 9/11--instead of "debunking" the truly incredible standard explanation and asking what happened to all that mass, there are gatekeepers like Michael Shermer working hard to "debunk" the questions that are raised. When we start finding the courage to deal with that whole ball of wax, maybe moving on to tackling climate change won't seem so hard to do.
If the actual increase in temperature from a doubling of c02 is one degree celcious without feedbacks and one of the major contributers to additional warming was supposed to be a large positive feedback from clouds. Should not that mean that if clouds only represent a small positive feedback the estimate of additional warming should be adjusted downwards?
adrian smits - The 2-4.5 C Charney climate sensitivity (mid-term; 50-100 years) includes feedbacks such as water vapor, clouds, climate driven aerosols, sea ice, and snow cover. See Hansen et al 2007 for a reasonable discussion of climate sensitivity and various feedbacks.
Of these feedbacks, the largest is water vapor increases driven by temperature, roughy doubling the temperature change from long lived GHGs alone. Aerosols (based on ice core evidence) decrease with warming, as (obviously) do sea ice and snow cover. Cloud feedback represents a fairly uncertain, but small, contribution to feedbacks, based on the evidence so far.
And, perhaps more importantly, we have far more evidence (and lines of evidence) supporting total climate sensitivity than we do for some of the components of feedback. If clouds turn out to supply less positive feedback, then perhaps aerosols provide more? Whatever the uncertainties about the ratios of the components, the strongest evidence is for the sum of feedbacks and total climate sensitivity - transient, Charney, and equilibrium.
Charney and Equilibrium Climate Sensitivity (ECS) are the same thing, and it requires many centuries to fully realise.
Earth System Sensitivity is the whole hog, including such long term feedbacks as albedo change from ice sheet loss. That requires milennia.
TCR should be the focus, the effects are more immediate (~70 year forecast) and the estimates more precise (you don't have to deal with certain complex dynamics).
Tristan - Actually, there are three sensitivities that can be considered:
There are even longer feedbacks, such as CO2 drawdown through weathering of rocks, but those are on the 10's of thousands of year scale.
Yes, and if you read my post you'll note that I mentioned all three :)
Isn't it Transient Climate Response? Maybe both terms are used. I haven't seen estimates quite as high as 3C for TCR.
Charney/ECS is not 50-100 years though, it's longer than that. It includes the ocean mostly/wholly responding to the forcing.
I believe Hansen's term for the milennial sensitivity was Earth System Sensitivity
Tristan - Quite correct on the three sensitivities; clearly I needed more coffee when I wrote that.
As to the TCS range, the IPCC AR4 discussion on sensitivities states that:
ESS as Hansen defined includes ice sheet changes, feedbacks including release of GHG's (such as ocean CO2, permafrost methane, etc). I find it (IMO) a bit more clear to group the different sensitivities by what feedbacks occur over that time period, rather than just the timescale itself.
The thing I find difficult to match up in my head is the idea that (judging by the likely ranges) the TCR can be as much as 2/3rds of the ECS.
A TCR of 2 and an ECS of 3 implies that 66% of the total warming associated with doubling GHG concentrations would have been already realised by the time the GHG concentrations had doubled.
It doesn't seem plausible.
@jsquared #7
The measured responses in the papers listed here depend on numerous data sets on temperatures and clouds, which average over large areas (hundreds of kilometers) and times (weeks to months). As aerosols are short-lived in the atmosphere (order of one week) their impact will be averaged in the data. If aerosol emissions and abundance drastically changed over the observational period, it could have biased the cloud data. Not likely when looking at large areas of the globe, but possible if you only looked downwind of China.
But on the short- vs. long-term: 10 years are not long enough to judge whether GW will cause a major redristribution of cloud heights, e.g. driven by changing convection schemes and higher water vapor amounts. Look at Figure 1 again: If you redistributed high clouds to low clouds, you would counteract GW. If you redistributed low clouds to high clouds, you would reinforce GW. However, there is no evidence for either yet AFAIK, meaning the data sets studied do not provide enough information. A major complication is overlapping clouds, i.e. situations where your satellite "sees" only the high cloud, but not the lower one below. In such a scene, you expect a warming but you may actually get a cooling. People are working on better retrievals though such that lower clouds can be detected in the presence of higher ones.