Climate Science Glossary

Term Lookup

Enter a term in the search box to find its definition.

Settings

Use the controls in the far right panel to increase or decrease the number of terms automatically displayed (or to completely turn that feature off).

Term Lookup

Settings


All IPCC definitions taken from Climate Change 2007: The Physical Science Basis. Working Group I Contribution to the Fourth Assessment Report of the Intergovernmental Panel on Climate Change, Annex I, Glossary, pp. 941-954. Cambridge University Press.

Home Arguments Software Resources Comments The Consensus Project Translations About Support

Bluesky Facebook LinkedIn Mastodon MeWe

Twitter YouTube RSS Posts RSS Comments Email Subscribe


Climate's changed before
It's the sun
It's not bad
There is no consensus
It's cooling
Models are unreliable
Temp record is unreliable
Animals and plants can adapt
It hasn't warmed since 1998
Antarctica is gaining ice
View All Arguments...


Username
Password
New? Register here
Forgot your password?

Latest Posts

Archives

Why did sea level fall in 2010?

What the science says...

Select a level... Basic Intermediate

Sea level fluctuations during El Niño (rising) and La Niña (falling) are the result of large exchanges of water between land and ocean in the form of rain and snow. This averages out to zero over time.  It does not affect long-term sea level rise, which comes from melting icesheets, glaciers, and thermal expansion.

Climate Myth...

Sea level fell in 2010

Large sea level fall in 2010 means IPCC sea level projections are wrong.

A number of climate not-so-skeptics have been exploiting global sea level data in their latest attempt to hide the incline.  Skeptical Science readers will be very familiar with the tactics the "skeptics" use to make this argument:

  1. Cherrypick a very small amount of data during which the short-term noise has dampened the long-term incline.
  2.  Ignore the long-term trend.
  3.  Refuse to examine the reasons behind the short-term change.

Climate "skeptics" have used this exact same strategy to hide the incline in global surface temperatures (here and here and here), lower troposphere temperatures (here), and ocean heat content (here and here).  We've found that an effective way to reveal the deception of these arguments is with an animated GIF, comparing the long-term data with the short-term "skeptic" cherrypick.  Figure 1 makes this comparison for the global mean sea level data during the satellite radar altimiter record (since 1993) from the University of Colorado.  The first frame shows the entire record, the second shows four periods of flat or declining mean sea level, and the third shows the most recent short-term decline.

msl

Figure 1: University of Colorado global mean sea level data with a 12-month running average, and short-term declines.

Cause of Short-Term Decline

Figure 1 confirms that yes, global mean sea level has declined slightly over the past year or so, and even slightly more than previous recent short-term declines.  But a true skeptic should ask what has caused this short-term decline, especially since it appears counter-intuitive.  After all, land-based ice continues to melt rapidly, and the oceans continue to warm rapidly (thermal expansion of ocean water contributes to sea level rise).  So what has dampened the long-term sea leve rise illustrated in Figure 1?

As Skeptical Science has previously reported, climate scientists attribute the short-term decline to extreme flooding in 2010.  This period also saw a strong La Niña cycle, which typically results in an increase of rain and snow falling over land, which corresponds with a fall in global sea level.  2009 to 2011 saw some epic deluges throughout the world; countries such as Pakistan, Sri Lanka, Australia, the Philippines, Brazil, Colombia and the United States have been hammered with extreme flooding.  Figure 2 illustrates where the water has gone.

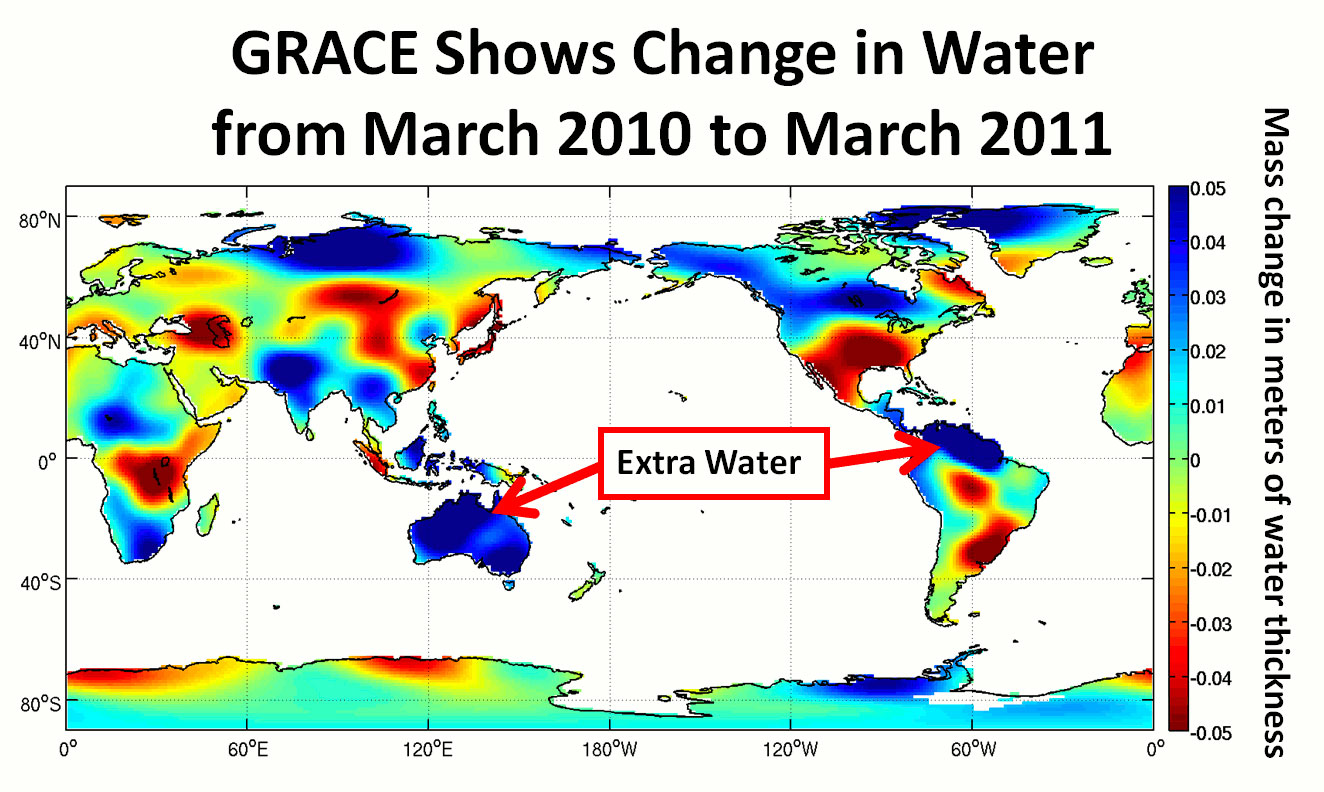
Figure 2: change in land-based global water storage in the period March 2010 to March 2011, as observed by GRACE gravity satellites. Image from NASA JPL.

Cherry-Flavored Water

In short, arguments that sea level rise has stopped are based on the same tired old "skeptic" tricks of cherrypicking short-term data and ignoring the long-term trend.  We know that ocean warming and melting ice will cause sea level to rise over the long-term, and the only reason the sea level rise has temporarily slowed is that there was so much flooding in 2010 - hardly a result worth celebrating.  As long as humans continue to warm the planet by increasing the amount of greenhouse gases in the atmosphere, we can expect the long-term sea level rise to continue.

Basic rebuttal written by dana1981


Update July 2015:

Here is the relevant lecture-video from Denial101x - Making Sense of Climate Science Denial

Last updated on 24 August 2017 by skeptickev. View Archives

Printable Version  |  Offline PDF Version  |  Link to this page

Argument Feedback

Please use this form to let us know about suggested updates to this rebuttal.

Comments

Comments 1 to 23:

  1. To a layman, the Grace plot appears to contradict the explanation that La Nina has transferred around 6mm of seawater onto the land, and to do so on two counts. First, assuming that both thermal expansion and cryosphere decline remained ongoing from 3/10 to 3/11, then ~3.2mm of the trend annual sea level addition is missing as well as the noted 6mm - i.e. around 9.2mm is missing in total. Second, the ratio of the area of land to sea being around 1:2.43, that 9.2mm of seawater should pile up substantially on land - i.e. to around 22.3mm on average. Even the 6mm volume would pile up to an average of 14.6mm on land, which Grace doesn't appear to show. Given the cartography of the Grace plot, it is hard to estimate areas of inundation in ratio to areas of drought, alongside the area of no net change, but studying it with the best impartiality I can apply, it doesn't appear to show more than an average of perhaps 4.5mm being retained on land - which, divided by 2.43, would represent only around 1.85mm of sea level. No doubt you will have accurate data from the Grace plot and can thus provide the proper figure for additional water on land. In surmising that it may be of a different scale to what should result from the missing 9.2mm of seawater being stored on land, if this were correct, I'd be glad to read your views on the percentage increase in airborne water vapour that the missing water now represents, given a normal mean equivalent of just 25mm of global rain being held as vapour. It would also be helpful to learn just what would be the CO2e of that increase in water vapour, and just how La Nina, and maybe other phenomena, could have evaporated that volume to remain as water vapour without an observed commensurate spike in global temperature - assuming that a global 1.0C rise is actually required to raise global water vapour by just 7%. I feel I must be missing something(s), as it's all rather puzzling. Regards, Lewis
    Response:

    [DB] "I'd be glad to read your views on the percentage increase in airborne water vapour that the missing water now represents"

    Lewis, remember that atmospheric water vapor excesses have a residence time of about 9 days.  Thus that water piled up onto land masses has a slow trek through cachments, impoundments and reservoirs on its way back to the sea.  And some will make its way into water tables as well.

  2. Lewis. I'm not so sure about all that water piling up on land. Quite a lot of it is 'in' the land. Australia's vast, drought-parched landscapes have soaked up a lot of water. Dry and cracked wetlands have filled (not all of them, unfortunately), most rivers, lakes, dams, reservoirs and rainwater tanks are brimful and many millions of thirsty trees and other plants have replenished their starving cells. And on top of that, I expect that we'll soon be seeing some figures about how much of the flooding and soaking rains have replenished groundwaters and deeper aquifers. And we're not the only ones. I'm just not familiar enough with other geographies to venture any opinions. More numbers from more observations and analyses are needed before we can get too detailed on this one.
  3. DB - thanks for your response - which I'm afraid still leaves me puzzled. As I understand it, Grace is the most sensitive instrument yet built for observing gravitational anomallies, and has been calibrated to identify changes in the presence of water both on and within the land. I'd agree that extreme rainfall will, on some adverse terrain, be very slow in its return to the ocean, and some will be subsumed into aquifers, but this doesn't explain why Grace doesn't show the gravitational reponse on land of the volumes of seawater that went 'missing'. What it appears to show on and in land - as best I can judge - is around 20% of that volume, and while I'd doubt it is accurate to say 0.5%, the idea of it being wrong by 80% seems implausible. NASA data on the actual net volume of anomalous water Grace recorded on the land would clarify the issue, but as it stands, it appears that ~9.2mm is 'missing' from the sea, of which Grace can sense only around 1.85mm on land. Short of a surprising leak in the seabed somewhere, this implies that around 7.3mm is now somehow being retained as airborne water vapour, being, as you say, recycled about every 9 days. Quite why this should be happening seems unclear. Regards, Lewis
  4. Adelady - thanks too for your response - It's good to hear of the land around you getting the chance to recover somewhat from the awful drought. As far as I know, Grace is able to sense the gravitational signature of additional water, whether it's on the surface or deep underground. Thus it shows the net change at year's end for each area of land, and it is the sum of these changes across all lands that seems to me far short of what has gone missing from the sea. As you say more numbers and analysis are needed to clarify the issue. Regards, Lewis
  5. LewisC - trying to estimate numbers from that graphic is not a reliable method. I assume the data will find its way into the scientific literature - but I will check up on that. The idea that the atmosphere is holding the equivalent of an extra 7.3mm of sea level, during 2010-2011, is a tad absurd. The exchange of water between the ocean and land surface can lead to mean sea level fluctuations up 8mm during ENSO events. See Llovel (2010) cited in the post. During the extreme El Nino of 1997/1998 sea level rose a whopping 20mm over the short-term, so we know that large fluctuations are possible. More telling, perhaps, is that La Nina is when we typically see cooler surface temperatures, and therefore a corresponding decrease in atmospheric water vapor. El Nino, on the other hand, is when heat is given up by the ocean surface to the atmosphere, and this warming increases the water vapor content of the atmosphere on a global scale. See Trenberth & Smith (2005). Of course, the oceans are still warming and the land ice is still melting, so long-term sea level will rise. This might be a rather large "pothole" on the road to higher seas though - given that La Nina looks set for a double-dip.
  6. I didn't see this graph in the discussion, so I submit it because the correlation between Multivariate ENSO Index and detrended-corrected global sea mean level seems eloquent : Source
  7. Thanks Papy, demonstrates the relationship nicely.
  8. This also comes from the same source. Putting the recent drop in the longer term context makes the "pothole" look relatively smaller, and well within the longer trend. http://sealevel.colorado.edu/content/revisiting-earths-sea-level-and-energy-budgets-1961-2008
  9. Post updated to include figure 5. Some extraneous text snipped.
  10. Lewis C and Rob: I computed these values from GRACE data back in September, commented here. My computations indicate that about 80% of the sea level decline between March 2010 and March 2011 was due to increased storage on land.
  11. Thanks Keith. We''ll see how well that stands up against the peer-reviewed literature, when the paper by Carmen Boening is published.
  12. 6mm drop in sea level may sound like a lot when you consider all of the world's oceans, but Australia was bone dry prior to the recent floods, so rather than the rain run off the land in to the rivers/oceans as you'd expect, it soaked it up like a sponge.
  13. mace@12 Please try to use some self-skepticism when putting forward a new hypothesis and at least apply a sanity check before posting. The surface area of the worlds oceans is ~3.6×10^8 km2, the surface area of Australia is only 7,617,930 km2, 1/47th of the surface area of the oceans. So for Australia as a sponge absorbing a 6mm rise in seal levels would be equivalent to absorbing 282mm of rainfall over its entire surface (most of which doesn't get much rainfall). Do you think that is at all plausible? If mean sea level were that sensitive to local flooding, it would bounce up and down like a yo-yo. Also I would suggest that you should confine yourself to discussion on a smaller number of threads. Your posts rather suggest a lack of basic knowledge on a number of basic topics, and posting wild theories like this gives the impression of trolling/spamming, especially when posted to multiple threads. This is intended as friendly advice, there is plenty of time to discuss these topics, and science is better served by depth of discussion rather than breadth.
  14. Sorry about that Dikran. I kind of see your point now about Australia but I read the article and previous posts so just wanted to launch a hypothesis out there to see if any fellows felt it was plausible. The article also identifies Columbia, the US, Brazil and Pakistan as having some heavy flooding. I don't think it's quite so dry in those places, though, so I agree my hypothesis is probably falling down. I think I've only posted to 2 threads, so far but apologies again. I will confine my posts to just 1 thread in the future.
  15. mace, you are welcome to post comments to as many threads as you feel capable of carrying on a dialogue on with any who participate with you, provided you are on-topic for that particular thread and that your comments comply with the Comments Policy (here). That being said (per Dikran above), for better internalization of things learned, fewer is probably best. Also note that this is a science-based website, so any hypothesis one wishes to float would need be accompanied by supportive references to the peer-reviewed literature.
  16. Hi Daniel Bailey, thanks for letting me post on more threads but I think I'll stick to just this one as I need to internalize my thoughts. The topic's about sea level falling, and the articles saying that this is because of more rain falling on the land than is normal. Obviously, rain would normally run off the land in to the rivers and oceans pretty quick, so I'm trying to think up why this hasn't happened in 2010. It dawned no me that it might be that it's being sucked in to the land, so I looked at the countries in figure 2 of the GRACE diagram, and Australia looked a likely candidate for this sponge effect. There definitely seems to be slightly more dark blue than dark orange in that picture, and the two can't be convoluted because the dark blue indicates higher quantities of surface lying water but it doesn't factor in how much has been absorbed in to the earth. The direct link is here:- http://grace.jpl.nasa.gov/news/index.cfm?FuseAction=ShowNews&NewsID=53 A Nasa climate scientist, Josh Willis, has put it more eloquently than I can, but I reckon he's saying the same thing. I guess we'll have to wait until next year for an update of the sea level data. Even if it doesn't show a bounceback, I think this could be due to a lagging effect as the water has to penetrate through the rock to get back to the sea.
  17. mace @16, the inland area of Eastern Australia, approximately the entire area of Queenland, New South Wales and Victoria inland of the Great Dividing Range, consists of three very large flood plains. The largest is the Murray Darling Basin, with an area of just over a million square kilometers. The Darling and tributaries drains nearly all of inland NSW, and a large section of southern Queensland, with a river system that drains into the Murray, and then into the sea in South Australia. Next largest is the Cooper Creek Catchment, with an area of 297,000 km^2. The Cooper Creek Catchement reaches as far north as my birth place, Mount Isa and drains into Lake Eyre, a normally dry salt pan below sea level. The area in Queensland drained by Cooper's Creek and the Diamantina (a tribuatary) is called the channel country because of the very large number of normally dry river beds that cross it. (Click on picture for full sized photo, which is well worth the look.) North of the Cooper Creek Catchment is the Gulf Country, a wide area drained by a number of intermittently flowing rivers into the Gulf of Carpentaria. The area of the gulf country is about 186,000 km^2. Combined, all three flood plains have an area approximately half of the Mississipi Basin, but unlike the Missisipi basin, most of the area is arid with only intermittently flowing rivers. It is also exceptionally flat. Floods in the Cooper Creek in Queensland take 9-10 months to travel its 1,300 km length to Lake Eyre. The land is so flat that raging floods travel at the glacial pace of 0.2 km/hour. Water traveling to the Murray down the Darling takes a similarly long time. Consequently much of the 2010 Queensland flood is either just now reaching the mouth of the Murray, or reached Lake Eyre a month or so ago, where it will now sit until it evaporates away. The land was so wet that the rivers in the channel country still have water in them. In addition to this natural storage, many of Australia's dams where at very low capacity before the floods, but are now very full. Wivenhoe Dam near Brisbane, for example, would have captured a volume of water close to that of Sydney Harbour (mostly during 2010). Combined that means a truly staggering quantity of water is being stored in Australia's river systems and dams which was not there 2 years ago. Dikran Marsupial is correct. The amount of water involved is not enough to account for the dip in sea level in 2010 by itself (and Australia was certainly not the only area flooded in 2010). Never-the-less, that water which is stored in Australia's rivers will not return to the sea as quickly as it was taken from it. It will be five or more years before Australia dries out (assuming we do not have ongoing rainfall, which we currently have). I suspect similar stories can be told in many other regions of the world, so while I expect sea levels to resume their inexorable rise, it will not be an immediate turn around.
  18. In addition to Tom's comment above, mace, please note that it can take several months to years for rainwater deposited into catchments and watersheds to return to the sea. A compounding factor is the replenishment of depleted aquifers. A nice, open-access, recent review is by Church & White 2011: Sea-Level Rise from the Late 19th to the Early 21st Century John A. Church • Neil J. White Surv Geophys (2011) 32:585–602 DOI 10.1007/s10712-011-9119-1 [Source]
  19. mace@14 Scientific discussion is best served by having a high signal to noise ratio, so sanity checking theories before putting them forward (or better still performing some background research) is vital in making sure that ones contributions are signal rather than noise (which is why I only contribute to discussions where I have some background and merely lurk on discussions where I don't). It takes a long time to understand even the basics, so reading the articles on SkS before posting is a good idea. If in doubt, posing the theory as a question is probably a better approach, e.g. "what effect has the recent floods in Australia had on global mean sea level?". There is nothing wrong with not knowing the answers to such questions (I would deinitely defer to Tom on this one!). It is true that other countries have had floods this year, however I suspect that is true of most years (the places in question may vary from year to year), and that the volume of the oceans means this variability has relatively little effect on sea levels. In guaging the effect of these floods on mean sea level, we ought to extend the discussion back in time to get an idea of what effect we should expect to see (I don't know the answer to that).
  20. I think that this short-term decline from lanina isn't affected much because it will back to the same situation. But its effect much on the climate of that area. How is it increasing amount of greenhouse gases?

  21. Why did sea level fall in 2010?

    This exchange in the Fall of 2011 presents a fascinating discussion of the relationship between global mean sea level and water transfer to land masses.  Specifically, the apparent temporary downtrend in sea level around 2010 was purported to be explained at least partially by torrential rainfall in Australia and elsewhere.  BUT the accumulation of rain on land was not nearly enough to account for the sea level drop.  The discussion trails off in December 2011 without a resolution of the discrepancy.  And the anthropogenic increase in sea level resumed its upward trend in 2012.

    Was this discrepancy ever resolved?  Does the discrepancy have implications regarding the accuracy annd relliability of satellite measurements?  Is this related to the later downturn in sea level in the 2016 timeframe?

    VR, richieb1234

  22. Richieb @21 , I am not clear about the nature of your inquiry.  Australia (the part that gets rained upon!) is about 3% of the world's land area . . . so presumably it was the other 140-ish million square kilometers receiving the bulk of the "missing" ocean water.  Spread kinda thin, even allowing for local concentrations (see chart in OP).

    Water runs off quickly and returns to the ocean, or soaks into the soil for a year or two ~ and eventually trickles back to the ocean, or evaporates and rains into the ocean.  All part of the normal variation of things.

    There doesn't seem to be any discrepancy requiring special explanation.   There are always small ups and downs imposed on top of the continuing rise in sea level.

  23. RitchieB,

    I do not think that there was ever a "discrepancy" to be corrected in the comments above.  The first commentor says they are a "layman" who eyeballs a graph and does some rudimentary calculations.  The responding posters cite Llovel et al 2010 which states in the abstract:

    "We show that whatever the period considered, interannual variability of the mean sea level is essentially explained by interannual fluctuations in land water storage, with the largest contributions arising from tropical river basins"

    Obviously the laymans eyeball is not as accurate as professional scientists calculations.  If you want more information Google Scholar says Llovel has been cited 84 times.  If you read the titles of the papers you can find one that answers your questions.  Here is one I looked at.  In the abstract it says all the fall in sea level in 2010-2011 is caused by land storage.

    If you look at the intermediate level of the explaination of this myth here at SkS, there is a graph that shows the yearly seasonal variation of sea level in the Northern Hemisphere varies by about 60 mm and the Southern Hemisphere varies by about 30 mm.  It seems reasonable to me that a change in rainfall could cause 10 mm yearly change for a short time when seasonal variation is so much larger.

Post a Comment

Political, off-topic or ad hominem comments will be deleted. Comments Policy...

You need to be logged in to post a comment. Login via the left margin or if you're new, register here.

Link to this page


The Consensus Project Website

THE ESCALATOR

(free to republish)


© Copyright 2024 John Cook
Home | Translations | About Us | Privacy | Contact Us