


 Arguments
Software
Resources
Comments
The Consensus Project
Translations
About
Support
Arguments
Software
Resources
Comments
The Consensus Project
Translations
About
Support
![]()
![]()
![]()
![]()
![]()
![]()
![]()
![]()
![]()
![]()


![]()


Latest Posts
- At a glance - Clearing up misconceptions regarding 'hide the decline'
- Pinning down climate change's role in extreme weather
- 2024 SkS Weekly Climate Change & Global Warming News Roundup #17
- Fact Brief - Is Antarctica gaining land ice?
- Simon Clark: The climate lies you'll hear this year
- Skeptical Science New Research for Week #17 2024
- Water is at the heart of farmers’ struggle to survive in Benin
- At a glance - The difference between weather and climate
- India makes a big bet on electric buses
- 2024 SkS Weekly Climate Change & Global Warming News Roundup #16
- EGU2024 - An intense week of joining sessions virtually
- Skeptical Science New Research for Week #16 2024
- How extreme was the Earth's temperature in 2023
- At a glance - Is the science settled?
- What is Mexico doing about climate change?
- 2024 SkS Weekly Climate Change & Global Warming News Roundup #15
- Fact Brief - Did global warming stop in 1998?
- Skeptical Science New Research for Week #15 2024
- EGU2024 - Picking and chosing sessions to attend virtually
- At a glance - The Pacific Decadal Oscillation (PDO) is not causing global warming
- Climate Adam: Is Global Warming Speeding Up?
- 2024 SkS Weekly Climate Change & Global Warming News Roundup #14
- Gigafact and Skeptical Science collaborate to create fact briefs
- Skeptical Science New Research for Week #14 2024
- How can I make my retirement plan climate-friendly?
- At a glance - Global warming and the El Niño Southern Oscillation
- A data scientist’s case for ‘cautious optimism’ about climate change
- 2024 SkS Weekly Climate Change & Global Warming News Roundup #13
- Skeptical Science New Research for Week #13 2024
- You can start applying for the American Climate Corps next month
Comment Search Results
Search for Arctic Sea ice
Comments matching the search Arctic Sea ice:
- How extreme was the Earth's temperature in 2023
Jan at 17:45 PM on 19 April, 2024Made it a little bit nicer, as it is important:
On the causes of the exceptional temperature jump in 2023
First things first:
What was special about the warming in 2023 was, that it happened all in the last 6 months, so it was a much larger jump over these months than the mean values of 2023.
Further, only a moderate El Nino existed, so not too much warming came from here.
Reasons where:
SOx reductions over the shipping routes amplified the marine heatwave signal across the mid-latitudes.
The El Nino in combination with a positive Indian Dipole - both lead to a larger heat release of the tropical oceans as a clear and strong circulation cell is supported over the tropical oceans due to the zonal SSTs gradient.
Sea ice reductions around the Antarctic caused circulation changes that led to moist and warm air advection over Antarctica (strong effect on the warming as exceptional heat waves rocked Antarctica), as well as radiative effects of the sea ice reductions and heat release over sea ice-free areas.
Then that climate warming warms the oceans now more than natural variability is often able to produce colder than normal SSTs - at one time only some ocean regions existed with colder than normal temperatures.
Then we had the vast expansion of marine heatwaves across the global oceans, especially across the mid-latitudes reaching a coverage of more than 40% in July.
The warmer-than-normal Oceans created a cloud feedback thereby increasing shortwave absorption (reinforces marine heatwaves).
From 2012 to 2016 we had a non-linear increase of moisture in the marine boundary layer caused by exceptional SSTs. The next jump will have happened in 2023 causing a water vapor feedback over large parts of the oceans to increase. And tropical moist air advection is causing marine heatwaves in the subtropics to mid-latitudes. So also here is another feedback as more water vapor radiates longwave radiation back to the surface.
Further, we had during summer to autumn large areas where the soil-moisture-temperature cascade came into play producing these exceptional continental heat waves. It comes along with a cloud feedback and supports stalled/fixed high-pressure systems as these heat domes redirect the jet around them (higher troposphere).
Then we had the pattern effect of increasing zonal (east/west direction) temperature gradients at the ocean surface and continents which disturb the overlying circulation, often causing blocking patterns (also a reason for the marine heatwaves to build up)
Then we had towards autumn a heat release of the marine heatwaves across the mid-latitudes, as the atmosphere gets colder. Also, cold core and warm cors eddies cause extreme temperature gradients in the western boundary extension regions leading to a larger latent heat releases over these ocean regions (small-scale pattern effect of SSTs increases wind speeds).
Last it has been possible that the oceans released heat from the subsurface that had built up. Across the mid-latitudes warm freshening water masses are accumulating under the surface as shallow as 150m depth. And these heat depots could have been tapped, as the jets speed up during winter, as the density gradient between the tropics and poles increases in the upper atmosphere while it decreases near the surface, especially during winter. More and stronger low-pressure systems due to increased shear are the outcome. And all these extreme low-pressure systems in autumn and winter across the mid-latitudes in 2023/24 could have tapped these subsurface heat depots. But no study here as this is a new development seen in the intensity of the low-pressure systems the last years (e.g. number of atmospheric rivers hitting the US west coast)
Main problem thou is the expansion of marine heatwaves, as they are feedback driven by global warming heating the oceans from the surface too fast (thermal stratification increases non-linear in the upper 300m of the oceans in various regions), in combination with the pattern effect which disturbs global zonal circulation with the result of more stalled high-pressure systems (low wind speeds are in most instances the main precondition for marine heatwaves to form besides thermal stratification and shallow upper mixed layer depth).
Last the warming of the northern latitudes can also be included in the factors driving global warming in 2023.
In short, the warming of 2023 was feedback-driven by various systems forcing each other into a heating mode with the systems of the oceans, atmosphere, and landmasses acting in unison!
The exact series of which contributed to what extent to the heating science has to find out. But it would have to be done on a monthly basis!
The next jump will have devastating consequences as they become larger...
In my opinion, the model spread is now a joke as it is way too large proving the uselessness of models as they will increasingly become unable to predict what is coming as too many parametrizations prevent them from simulating the non-linear character of the mutually reinforcing systems with many processes operating on small scales...
p.s. we warm the oceans too fast from the surface that is our main problem!
- How extreme was the Earth's temperature in 2023
Jan at 16:59 PM on 19 April, 2024What was special about the warming in 2023 was, that it happened all in the last 6 months, so it was a much larger jump over these months then the mean values of 2023.
Further, only a moderate El Nino existed, so not too much warming came from here.
Reasons where:
SOx reductions amplified the marine heatwave signal across the mid-latitudes.
The El Nino in combination with a positive Indian Dipole - both lead to a larger heat release of the tropical oceans as a clear and strong circulation cell is supported over the tropical oceans due to the zonal temperature gradient.
Sea ice reductions around the Antarctic caused circulation changes that led to moist and warm air advection over Antarctica (strong effect on the warming as exceptional heat waves rocked Antarctica), as well as radiative effects of the sea ice reductions and heat release over sea ice-free areas.
Then climate warming warms the oceans now more than natural variability is often able to produce colder than normal SSTs - at one time only some ocean regions existed with colder than normal temperatures.
Then we had the vast expansion of marine heatwaves across the global oceans, especially across the mid-latitudes reaching a coverage of more than 40% in July.
The warmer-than-normal Oceans created a cloud feedback thereby increasing shortwave absorption (reinforces marine heatwaves).
From 2012 to 2016 we had a non-linear increase of moisture in the marine boundary layer caused by exceptional SSTs. The next jump will have happened in 2023 causing a water vapor feedback over large parts of the oceans to increase. And tropical moist air advection is causing marine heatwaves in the subtropics to mid-latitudes. So also here another feedback as more water vapor radiates longwave radiation back to the surface.
Further, we had during summer to autumn large areas where the soil-moisture-temperature cascade came into play producing these exceptional continental heat waves. It comes along with a cloud feedback.
Then we had the pattern effect of increasing temperature gradients in the oceans surface and continents which disturb the overlying circulation, often causing blocking patterns (also a reason for the marine heatwaves to build up)
Then we had towards autumn a heat release of the marine heatwaves across the mid-latitudes, as the atmosphere gets colder.
Last it have been possible that the oceans released heat from the subsurface that had built up. Across the mid-latitudes warm freshening water masses are accumulating under the surface as shallow as 150m depth. And these heat depots could have been tapped, as the jets speed up during winter, as the density gradient between the tropics and poles increases in the upper atmosphere while it decreases near the surface. More and stronger low-pressure systems due to increased shear are the outcome. And all these extreme low-pressure systems in autumn and winter across the mid-latitudes in 2023/24 could have tapped this subsurface heat depot. But now study here as this is new.
Main problem thou is the expansion of marine heatwaves, as they are feedback driven by global warming heating the oceans from the surface too fast (thermal stratification increases non-linear in the upper 300m of the oceans in various regions), in combination with the pattern effect which disturbs global zonal circulation with the result of more stalled high-pressure systems (low wind speeds are in most instances THE precondition for marine heatwaves too form besides thermal stratification and small mixed layer depth).
Last the warming of the northern latitudes can also be included in the factors driving global warming in 2023.
In short the warming of 2023 was feedback-driven by various system forcing each other into a heating mode with the systems of the oceans, atmosphere, and landmasses acting in unison! The exact series of which contributed to what extent to the heating science has to find out. But it would have to do it on a monthly basis!
The next jump will have devastating consequences as they become larger...
Here is my FB page, want now to make my own blog, as the experts lose the oversight and models will be increasingly wrong (the model spread is in my opinion a joke as it is way too large proving the uselessness of models)...
https://www.facebook.com/Erdsystemforschung/
All the best
Jan
p.s. we warm the oceans too fast that is our main problem!
- How extreme was the Earth's temperature in 2023
nigelj at 07:08 AM on 18 April, 2024Some explanations for the unusual global warming levels in 2023:
James Hansen thinks the anomalously high global surface temperature in 2023 are due to AGW + El Nino + Aerosols reductions. I can't find the related commentary, and have to go by memory, but Hansen suggests that the quite abrupt reductions in shipping aerosols in 2023 added to reductions in industrial aerosols over the last ten years warmed the oceans and this energy comes out after a time delay and it all came out in 2023. Perhaps someone has the details of his suggestion and comments on its credibility.
El ninos release ocean heat that has been building up. I note that the high sea surface temperatures are in the northern oceans are away from the centre of el nino activity.
From NASA: Five Factors to Explain the Record Heat in 2023. But what caused 2023, especially the second half of it, to be so hot? Scientists asked themselves this same question. Here is a breakdown of primary factors that scientists considered to explain the record-breaking heat ( I have cut and pasted the key statements only):
The long-term rise in greenhouse gases is the primary driver.
The return of El Niño added to the heat.
Globally, long-term ocean warming and hotter-than-normal sea surface temperatures played a part.
Aerosols are decreasing, so they are no longer slowing the rise in temperatures.
Scientists found that the Hunga Tonga-Hunga Ha‘apai volcanic eruption did not substantially add to the record heat.
earthobservatory.nasa.gov/images/152313/five-factors-to-explain-the-record-heat-in-2023
From PBS News: ‘We’re frankly astonished.’ Why 2023’s record-breaking heat surprised scientists. A range of factors including general warming due to human-caused climate change, the El Niño climate pattern, record-low Antarctic sea ice and others — contributed to 2023’s record-breaking heat, but they don’t tell the full story. Schmidt said more work has to be done to fully understand why the year was so hot.
“In 2024, we’ll be seeing whether this persists or whether it kind of goes back to a normal pattern,” he said. “And that will be kind of telling as to whether 2023 was just a very unusual combination of things that all added up to what we saw, or whether there’s something systematically different going forward.” (Seems like good comments to me)
From Copernicus:
Some alternative suggestions on 2023 warming including changes in regional wind patterns over the northern parts of the oceans bringing heat to the surface:
atmosphere.copernicus.eu/aerosols-are-so2-emissions-reductions-contributing-global-warming
(This is not a reference to el nino, but to other changes in wind patterns to the north. For me it raises the question of caused the changes in wind patterns)
Clearly there is no definitive answer yet on why 2023 was so unusually warm ( ditto 2024 thus far). As scientists say next years data will help illuminate the causes.
- Welcome to Skeptical Science
Eclectic at 09:45 AM on 4 April, 2024Cookclimate @118 :-
You are wrong. When the arctic/Greenland ice-sheets melt, that raises the sea level near the equator, and consequently that slows the Earth's rotation. Basic physics. And you are wrong about so very much of the other stuff you posted.
Where do you get all that wrong info from?
- Welcome to Skeptical Science
cookclimate at 09:28 AM on 4 April, 2024CO2 does not cause Earth’s climate change.
It is estimated that it will cost $62 trillion to eliminate fossil fuels, but eliminating fossil fuels will be a complete waste of our tax and corporate dollars, because it will not stop the warming. You can’t stop Mother Nature.
The IPCC (Intergovernmental Panel on Climate Change) frequently shows that temperature correlates with CO2 for the last 1,000 years as proof that CO2 is causing the warming. But if you extend that to the last 800,000 years, the temperature and CO2 lines do not correlate or fit (Figure 14 in Supplemental Data). If the lines don’t fit, then you must acquit CO2. CO2 is not guilty of causing climate change. CO2 does not control Earth’s temperature. The IPCC has not demonstrated any scientific evidence that CO2 controls Earth’s temperature (they only have unproven theories).
The facts:
• Earth is currently warming (it is still below the normal peak temperature).
• CO2 is increasing (it is above the normal CO2 peak).
• Earth’s current warming is being caused by a 1,470-year astronomical cycle.
The 1,470-year astronomical cycle warms the Earth for a couple of hundred years and melts ice sheets primarily in Greenland and the Arctic. It has repeated every 1,470-years for at least the last 50,000 years. It is normal that it would be happening again. It accelerates Earth’s rotation, stopping length of day increases (Figure 9). It warms the Earth. Based on historical data, the current warming should peak near the year 2060 and then it should start to cool.
For more information, see A 1,470-Year Astronomical Cycle and Its Effect on Earth’s Climate,
and Supplemental Data,
www.researchgate.net/publication/379431497_Supplemental_Data_for_A_1470-Year_Astronomical_Cycle_and_Its_Effect_on_Earth's_Climate#fullTextFileContent - Climate - the Movie: a hot mess of (c)old myths!
jimsteele at 02:05 AM on 4 April, 2024I would also take issue with SkepticalScience claiming Polar bears are in danger of extinction as well as many other species.
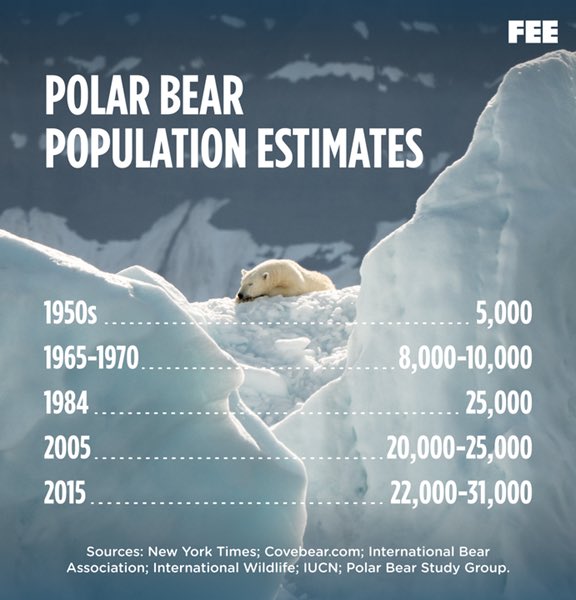
Polar bears are believed to be affected by reduced sea ice because their main prey, the ringed seal, remains in the Arctic all year and they give birth to their pups on the ice where they are very vulnerable to the bears.
• There are 2 types of sea ice. Land-fast ice and pack-ice. Unlike fast-ice, pack ice is mobile. When winds cause pack ice to collide with the shore or other ice slabs, the pack ice thickens as ice slabs are pushed on top of each other. Thick pack ice doesn’t melt completely in the summer. However, shifting winds can blow thick pack ice out of the Arctic, as happened in the 1990s9.
• Ringed seals depend on fast-ice. Thin fast-ice naturally melts completely by July, and then re-forms starting in October.To breathe, ringed seals must create breathing holes by head-butting through any newly forming thin ice. Then gnawing and clawing at the ice as it thickens, keeps their breathing holes open throughout the winter. Multi-year pack ice is too thick for seals to create breathing holes.
• Ringed seals mostly give birth to their pups on land fast-ice in March and April. Pups remain on the ice while nursing and then molting in June. Land-fast ice is thickest during the seals reproduction cycle and remains until late June. Seals then abandon the ice to hunt in open water starting in July and only crawl out on ice unpredictably to bask in the sun for a few hours. Melting ice after July has no effect on how available the seal pups are to bears.
• Polar bears gain almost all of their body fat in the late spring and early summer from feeding on baby ringed seals. In contrast, all bears lose weight during the winter when there is the greatest amount of ice. Feasting on baby seals from March thru June determines if the bears will survive the winter. Unlike feasting on baby seals, any feeding on ice or land after June is purely opportunistic. Pregnant females enter hibernation just as ice begins to reform and emerge only as ringed seals are giving birth
• Ringed Seal are so abundant they are considered a Species of Least Concern, so Arctic climate change does not appear to have had a negative effect.
• More open water from July to September increases sunlight reaching phytoplankton, generating greater photosynthesis and a more productive Arctic Ocean.3 Increased photosynthesis improves the whole Arctic food chain, eventually increasing fish populations that ringed seals depend upon. More ringed seals provide more food for polar bears.
• Since hunting polar bears was restricted, polar bear populations have increased. - At a glance - Human activity is driving retreat of arctic sea ice
gerontocrat at 03:48 AM on 7 March, 2024And some unusual evidence on the NW Passage hot off the press from "The Guardian" newspaper.
https://www.theguardian.com/environment/2024/mar/06/gray-whale-nantucket-extinction
Gray whale sighted off New England 200 years after species’ Atlantic extinction
Scientists confirm cetacean’s presence but cite impact of climate change which has made North-west Passage ice-free in summer
Scientists have confirmed the presence of a whale off New England that went extinct in the Atlantic Ocean two centuries ago – an exciting discovery, but one they said that illustrates the impact of climate change on sea life.
Researchers with the New England Aquarium in Boston found the gray whale while flying 30 miles south of Nantucket, Massachusetts, on 1 March. The whale, which can weigh 60,000 pounds (27,215kg), typically lives in the northern Pacific Ocean.
The gray whale vanished from the Atlantic Ocean by the 18th century, but there have been five observations of the animal in Atlantic and Mediterranean waters in the last 15 years, the aquarium said in a statement. The whale found this month was probably the same animal spotted in Florida late last year, the aquarium said.
The researchers who found the animal off Massachusetts said they were skeptical at first, but after circling the area for 45 minutes, they were able to take photographs that confirmed it was indeed a gray whale.
“I didn’t want to say out loud what it was, because it seemed crazy,” said Orla O’Brien, an associate research scientist with the Anderson Cabot Center for Ocean Life at the New England Aquarium.
Scientists said they were thrilled to see the animal, but its presence probably has to do with the warming of the planet. The North-west Passage, which connects the Atlantic and Pacific Oceans through the Arctic Ocean in Canada, has lacked ice in the summertime in recent years, they said."
- Increasing melting of West Antarctic ice shelves may be unavoidable
David-acct at 10:35 AM on 5 November, 2023Surprising that there was no mention of the geothermal activity in West Antarctica . The article only mentions warming seas as if global warming was the primary cause of the West antarctica sea ice melting.
Far better to provide a more complete analysis
www.science.org/doi/10.1126/sciadv.1500093
- Antarctica is gaining ice
John Hartz at 07:48 AM on 13 October, 2023Suggested supplemental reading:
Forty percent of Antarctica’s ice shelves are shrinking, worrying scientists by Kasha Patel, Environment, Washington Post, Oct 12, 2023
- Antarctica is too cold to lose ice
John Hartz at 07:44 AM on 13 October, 2023Suggested supplemental reading:
Forty percent of Antarctica’s ice shelves are shrinking, worrying scientists by Kasha Patel, Environment, Washington Post, Oct 12, 2023
- John F. Clauser: the latest climate science-denying physicist
MA Rodger at 21:25 PM on 7 September, 2023Markp @1+,
I think it is wrong to say that the IPCC is not a scientific body. Certainly the SPMs are edited for the political purpose of obtaining unanimity, but the assessment reports do reflect the whole of the science and thus are scientific. If that science is not being done (and in the case of WG2 & WG3 I fear it probably isn't), it is a problem not of the IPCC's making.
The two examples you provide are worthy of discussion.
☻ Spatt & Dunlop (2018) 'What Lies Beneath; The Understatement of Existential Climate Risk' is a bit of a gallop through the subject and today a little dated. It is the product of a think-tank and, apparently, "is not intended as a 'scientific paper'." Perhaps study of missing threats should become a subject set up as a science; the studying of the cracks within AGW science.
Today the science (and thus the IPCC) is addressing tipping points and if the evidence suggests either of them are still underplaying them, then that should be put on record.
And the 'fat tail', our inability at nailing down ECS and partcularly the top end of possible ECSs; if that does continue to remain elusive, isn't that because the 'fat tail' acts so slowly? And if it is slow and also temperature induced, presumably we should be able to dodge it before it arrives.
☻ The second example you cite is a downloadable undergrad thesis and the climatology bit of it is about the rather dated 'Arctic melt-out' warnings of two-decades back. At the time the basis for these warnings was the period of increased melt 2000-07 which saw previous trends in annual Arctic minimum SIE rise from -0.06M sq km/y to -0.24M sq km/y. The idea that the thinning ice would disappear with a rush was at the time** not unfounded but it hasn't been borne out with 2007-on only showing a slow downward trend in the Arctic SIE minimums.
(** I remember at the time the widespread incredulity given to 'official' projections which were suggesting ice-free Arctic summers would arrive more slowly, sometime 2027-50. We are now not far off from the start of that period and no ice-free event yet.)
The other bit of criticism of in the undergrad thesis looks at economic forecasting. This is perhaps off-topic (the numpty Clauser is the topic here & he is a science guy) so I'll try not to wax too lyrically.
I don't think the thesis really scratches the surface in its descriptions of what I consider ligitmate criticism of the pretty awful work in this field. The idea that timely AGW mitigation would (according to denialists) crash the global economy and pauperise the less-developed world but AGW itself would do no more than slow economic growth marginally (global growth reduced by just a third under +4ºC AGW in the doomiest projection here) I find utterly unbelievable. (My usual example is to imagine Madagascar melted into the sea. The loss to global economy would be 0.014% but would the 30M souls who live there just go down with the ship?)
But with the numpty Clauser as the topic here & he a science guy, economic forecasting is not on-topic here. - The difference between land surface temperature and surface air temperature
Jim Hunt at 08:01 AM on 6 August, 2023"People who create and/or circulate such myths are denying plain reality."
There's a lot of it about at the moment John! My own recent article on the creation and circulation of similar myths takes a look at some theory whilst also debunking some specific "skeptical" memes:
https://GreatWhiteCon.info/2023/08/the-information-war-with-the-fossil-fuel-industry/
By way of just one example, if you can spot the difference between these two graphs of Arctic sea ice extent you may well wonder why a certain "Steve Goddard" has been continuously blasting the former data at his flock of faithful followers rather than the latter?
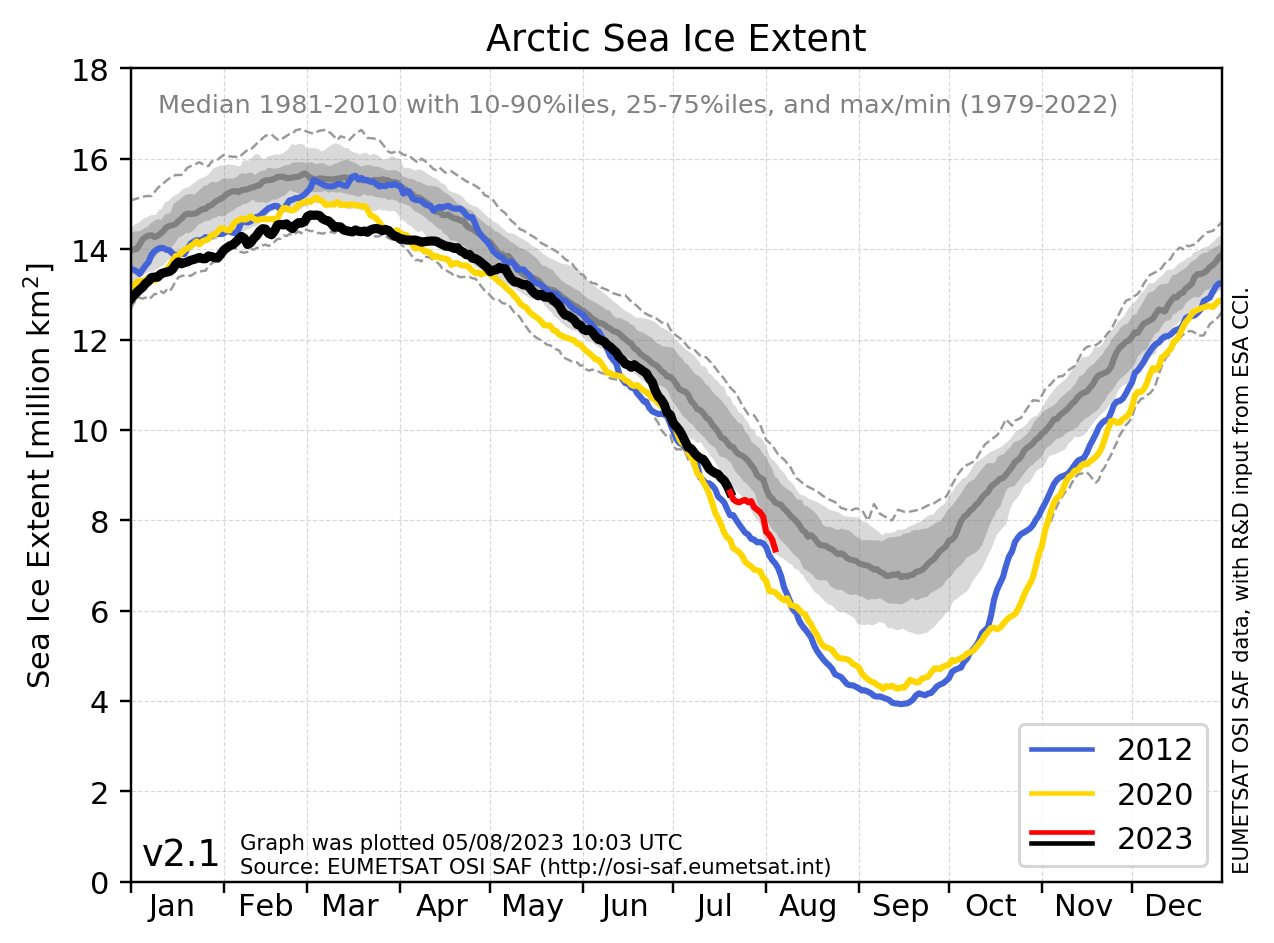
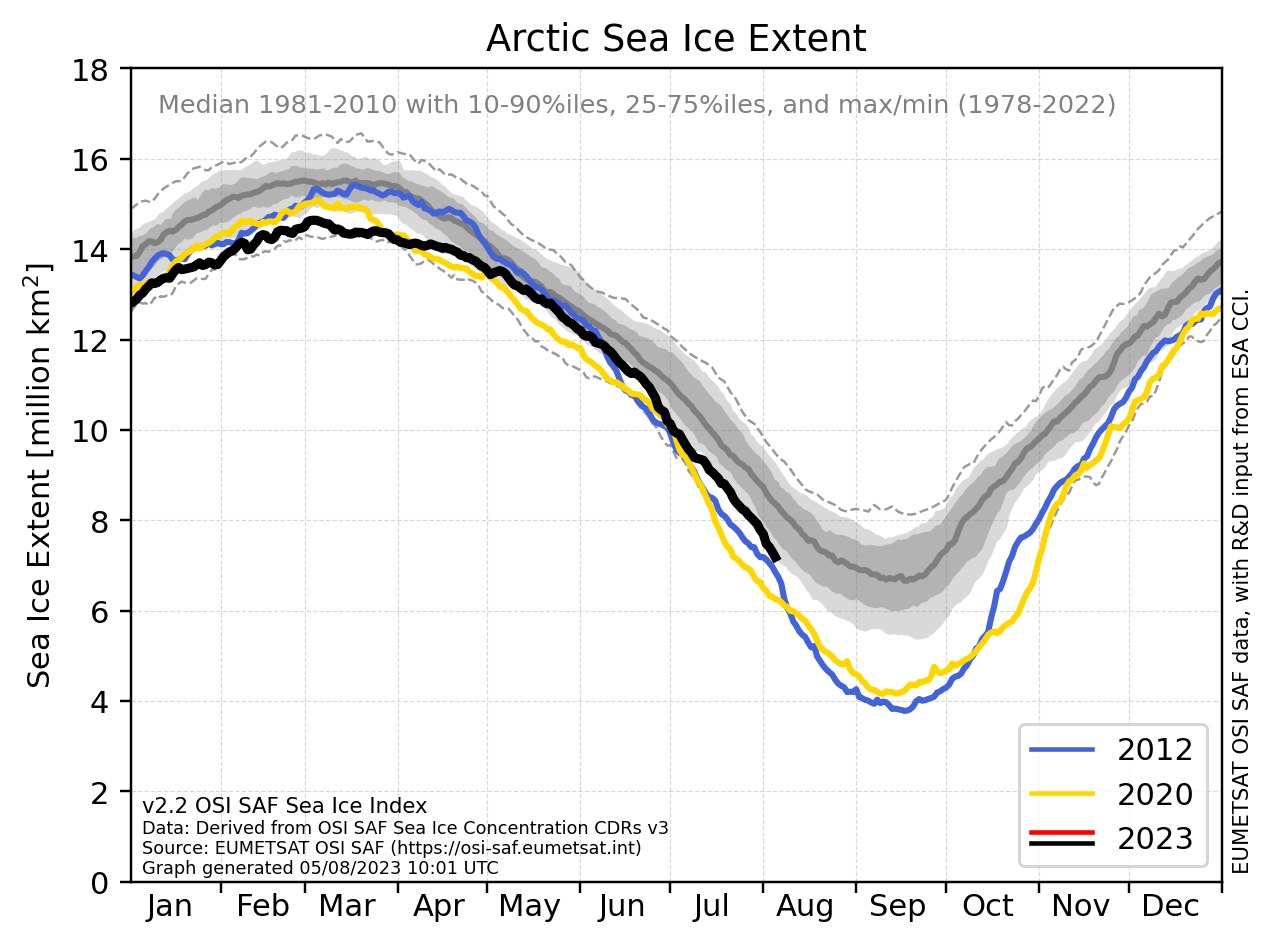
Events, dear Tony, events!
- How big is the “carbon fertilization effect”?
daveburton at 01:45 AM on 14 July, 2023Eclectic wrote, "Daveburton @22 ~ Please explain more of your first chart [ IPCC's decadal Carbon Flux Comparison 1980-2019 ]. The natural sink flux figures… show a rather steady proportionality to the total carbon emissions."
Glad to. Any two things which steadily increase are thereby correlated. There's only a possibility that the relationship might be causal if there's a possible mechanism for such causality.
There's no possible mechanism by which the rate at which CO2 emerges from chimneys could govern the rate at which CO2 is taken up by trees & absorbed by the oceans, or vice-versa, so the relationship cannot be causal — just as this famous relationship is not causal:

Eclectic wrote, "The land sink shows about 30-35% of total emissions, while the sum of land & ocean remains around 55-60%."
Yes, I usually say "about half," as in, "If our CO2 emissions were cut by more than about half then the atmospheric CO2 level would be falling, rather than rising."
It is important to recognize that the relationship is merely coincidental, not causal.
Eclectic wrote, "as the decades progress, the natural carbon sink flux in absolute terms rises with the rising emissions ~ but does not show a proportional increase."
The rate at which natural processes, such as ocean uptake, uptake by trees and soil ("greening"), and rock weathering, remove CO2 from the air, is affected in minor ways by many factors, but in a major way by only one: the current amount of CO2 in the air.
Our CO2 emission rate does not and cannot affect the natural removal rate, except indirectly, in the long term, by being one of the most important factors which affect the amount of CO2 in the air.
Eclectic wrote, "looking back in time ~ as the atmospheric CO2 level decreases, the size of the natural sink flux decreases also."
That is correct. It will also be correct looking forward in time, when CO2 levels are falling, someday.
Eclectic wrote, "this directly contradicts your hypothesis of 'if emissions were halved ... atmospheric CO2 level would plateau.'"
If you'll allow me to use "halved" as a shorthand for "reduced to the point at which emissions merely equal current natural removals, rather than exceed them," then those two statements are both correct, and perfectly consistent. It's pCO2 (level), not the rate of CO2 emissions, which (mostly) governs the rates of all the natural CO2 removal from the atmosphere.
Of course there are also minor factors which affect the removal rates. For instance, as we've already discussed, a 1°C rise in water temperature slows ocean uptake of CO2 by roughly 3%. Conversely, a rise in air temperature accelerates CO2 removal by rock weathering. (Sorry, I don't have a quantification of that.) But the main factor which controls the rate of CO2 removals is pCO2.
Eclectic wrote, "While the nutritive components of some food crops may reduce slightly as CO2 rises…"
Oh boy, another rabbit hole! That's the Loladze/Myers "nutrition scare."
It is of little consequence. That should be obvious if you consider that crops grown in commercial greenhouses with CO2 levels as high as 1500 ppmv are as nutritious as crops grown outdoors with only 30% as much CO2.

≥1500 ppmv CO2 is optimal for most crops. That's why commercial greenhouses typically use CO2 generators to raise daytime CO2 concentration to well above 1000 ppmv. It is expensive, but they go to that expense because elevated CO2 (eCO2) makes crops much healthier and more productive. (They don't typically supplement CO2 at night unless using grow-lamps, because plants can't use the extra CO2 without light.)
If elevating CO2 by >1000 ppmv doesn't cause crops to be less nutritious, then elevating CO2 by only 140 ppmv obviously doesn't, either.
Better crops yields, due to eCO2 or any other reason, can cause lower levels (but not lower total amounts) of nutrients which are in short supply in the soil. But that doesn't happen to a significant extent when agricultural best practices are employed.
I had an impromptu online debate about the nutrition scare with its most prominent promoter, mathematician Irakli Loladze, in the comments on a Quora answer. If you're not a Quora member you can't read it there, so I saved a copy here. He acknowledged to me that food grown in greenhouses at elevated CO2 levels is as nutritious as food grown outdoors.
Faster-growing, more productive crops require more nutrients per acre, but not more nutrients per unit of production.
Inadequate nitrogen fertilization reduces protein production relative to carbohydrate production, because proteins contain nitrogen, but carbohydrates don't. Likewise, low levels of iron or zinc in soils cause lower levels of those minerals in some crops. So, it is possible, by flouting well-established best agricultural practices, to contrive circumstances under which eCO2, or anything else which improves crop yields, causes reduced levels of protein or micronutrients in crops.
But farmers know that the more productive crops are, the more nutrients they need, per acre. Competent farmers fertilize accordingly.
Or, for nitrogen, they may plant nitrogen-fixing legumes — which benefit greatly from extra CO2.
If you don’t fertilize according to the needs of your crops, negative consequences may include reductions in protein and/or micronutrient levels in the resulting crops. The cause of such reductions isn't eCO2s, it's poor agricultural practices.
The nutrient scare is an attempt to put a negative "spin" on the most important benefit of eCO2: that it improves crop yields.
Eclectic wrote, "it is (as you state) beyond argument that higher CO2 benefits overall crop yield & plant mass."
That's correct. Moreover, agronomy studies show that for most crops the effect is highly linear as CO2 levels rise, until above about 1000 ppmv (which is far higher than we could ever hope to drive outdoor CO2 levels by burning fossil fuels). That linearity is obvious in the green (C3) trace, here:

That improvement is one of several major reasons that catastropic famines are fading from living memory.
If you're too young to remember huge, catastrophic famines, count yourself blessed. Through all of human history, until very recently, famine was one of the great scourges of mankind, the "Third Horseman of the Apocalypse." But no more. This is a miracle!
https://ourworldindata.org/famines

Ending famine is a VERY Big Deal, comparable to ending war and disease. Compare:
● Covid-19 killed 0.1% of world population.
● 1918 flu pandemic killed about 2%.
● WWII killed 2.7%.
● The near-global drought and famine of 1876-78 killed about 3.7% of the world population.
Eclectic wrote, "other CO2/AGW concomitant effects of increased droughts /floods /heat-waves can be harmful to crop yields in open-field agriculture. [And especially so for the staple crop of maize.]"
Well, let's examine those one at a time.
Heat-waves. Overall, temperature extremes are not worsened by the warming trend. Heat waves are slightly worsened, but by less than cold snaps are mitigated. That's because, thanks to "Arctic amplification," warming is disproportionately at chilly high latitudes, and it is greatest at night and in winter. The tropics warm less, which is nice, because they're warm enough already.
1°C is about the temperature change you get from a 500 foot elevation change. (That's calculated from an average lapse rate of 6.5 °C/km.)
On average, 1°C is similar in effect to a latitude change of about sixty miles, as you can see by looking at an agricultural growing zone map. Here's one, from the Arbor Day Foundation:

From eyeballing the map, you can see that 1°C (1.8°F) = about 50-70 miles latitude change.
James Hansen and his colleagues reported a similar figure: "A warming of 0.5°C... implies typically a poleward shift of isotherms by 50 to 75 km..."
1°C is less than the hysteresis ("dead zone") in your home thermostat, which is the amount that your indoor temperatures go up and down, all day long, without you even noticing.
In the American Midwest, farmers can fully compensate for 1°C of climate change by adjusting planting dates by about six days.

Floods. Theoretically, by accelerating the water cycle, climate change could increase the frequency or severity of floods. But the effect is too slight to be noticeable. AR6 says no change in global flood frequency is detectable:

Droughts. Droughts have not worsened. In fact, the global drought trend is slightly down. Here's a study:
Hao et al. (2014). Global integrated drought monitoring and prediction system. Sci Data 1(140001). doi:10.1038/sdata.2014.1

Here's the U.S. drought trend (the bottom/orange side of the graph):
https://www.ncei.noaa.gov/access/monitoring/uspa/wet-dry/0

Not only does climate change not worsen droughts, it has long been settled science that eCO2 improves plants' water use efficiency (WUE) and drought resilience, by improving CO2 stomatal conductance relative to transpiration. So eCO2 is especially beneficial in arid regions, and for crops which are under drought stress.
Maize (corn) has been very heavily studied. Even though it is a C4 grass, it benefits greatly from elevated CO2, especially under drought stress. Here's a study (one of many):
Chun et al. (2011). Effect of elevated carbon dioxide and water stress on gas exchange and water use efficiency in corn. Agric For Meteorol 151(3), pp 378-384, ISSN 0168-1923. doi:10.1016/j.agrformet.2010.11.015.
EXCERPT:
"There have been many studies on the interaction of CO2 and water on plant growth. Under elevated CO2, less water is used to produce each unit of dry matter by reducing stomatal conductance."
Here's a similar study about wheat:
Fitzgerald GJ, et al. (2016) Elevated atmospheric [CO2] can dramatically increase wheat yields in semi-arid environments and buffer against heat waves. Glob Chang Biol. 22(6):2269-84. doi:10.1111/gcb.13263.
However, I agree with you that putting a monetary value on the benefits of CO2 for crops is difficult. In part that's because the price of food soars when it's in short supply, and plummets when it's plentiful. So, for example, if we were to attribute, say, 15% of current crop yields to CO2 fertilization & CO2 drought mitigation, and value that 15% using current crop prices, we would be underestimating the true value, because absent that 15% boost the prices would have been much higher.
- Antarctica is gaining ice
scaddenp at 07:41 AM on 25 May, 2023Just for clarification for other readers, as I pointed out above, Bart's conjecture "reduced sea ice mean more snowfall" is not expected given very low sea surface temperatures. To demonstrate that, Bart would need to show that precipatation varies in sync with sea-ice (which has both increased and decreased in recent history). By contrast, there is evidence for variations being due to multiyear weather cycles.
As to ice loss (overwhelmingly calving since most of Antarctica is too cold for melt), while the SAM is positive then continued basal erosion of the ice shelves is expected from warm deep water (eg see "The circum-Antarctic ice-shelves respond to a more positive Southern Annular Mode with regionally varied melting" ) and a useful summary here.
Loss of ice shelves leads to increased calving (see here with its links to relevent papers) as does loss of sea ice. That is why my money is on continued ice loss despite some weather noise. Let's see what an El Nino will bring after three La Nina years.
- Antarctica is gaining ice
Bart Vreeken at 19:51 PM on 24 May, 2023Thank you very much, scaddenp #579
So text was just removed, which is very annoying! I wasn't sure if I had done anything wrong myself.
But indeed, a rising air temperature and reduced sea ice mean more snowfall and a higher Surface Mass Balance according to multiple models. The question is how that relates to the increased melting and calving along the edges. Nobody knows exactly, and therefore it's good to have a close look on what happens.
BL #577 "He's made a big thing about NASA's 149 Gt/yr value"
Huh ...? I simply changed the number, for it was wrong. Bob Loblaw was the one who kept talking about it. And yes, "it ignores all the data in between." But that's not what the discussion was about. Replacing the 'last-first' by 'regression' doesn't make it better, for that still ignores all the data in between.
- Antarctica is gaining ice
scaddenp at 12:51 PM on 24 May, 2023Before Bart was moderated, he made some speculative comments about the contribution from loss of sea ice. At first glance this doesnt sound like something that would have a big effect. The ocean surface temperatures are still very cold so not a lot of scope of increased evaporative water content, especially compared to incursions of moist air due to positive SAM. However, this seems a very testable hypothesis since different parts of Antarctica would have different response to changes in air circulation, whereas arctic seaice has varied a lot (up and down) over past 20 years and if it was a factor, then expect precipation to vary accordingly (and in the regions where change happens).
- Antarctica is gaining ice
scaddenp at 07:54 AM on 23 May, 2023"Nobody knows.." Hmm. Certainly investigated. See "Interannual ice mass variations over the Antarctic ice sheet from 2003 to 2017 were linked to El Niño-Southern Oscillation"
Shows correlation of AP and WAIS with ENSO and anticorrelation of EAIS.

Hmm. ok, only 2017. What about GFO and recent records. There is some detailed analysis in "Spatially heterogeneous nonlinear signal in Antarctic ice-sheet mass loss revealed by GRACE and GPS (2023)"
and another study of links with other quasi-periodic cycles in Antarctica in "Antarctica ice-mass variations on interannual timescale: Coastal Dipole and propagating transports"
Evidence to date - based on correlations of where the changes in ice mass are occurring - links interannual change to short term (2-8 year) quasi-periodic weather cycles (ENSO, Antarctic Circumpolar Wave, Antarctic Occillation) influencing Antartica.
My money (literally) would be on continued long term ice loss. Short term variation as observed here to date would certainly NOT be a reason for change in climate mitigation policy.
- Antarctica is gaining ice
Bart Vreeken at 01:41 AM on 23 May, 2023"Are you suggesting the most recent changes in ice mass are indicative of a substantive change in the trend? And if so, what do you think is driving such a change?"
That might be, yes. The driving force could be the low amount of sea ice, and the rising temperatures. Both of them can produce more snowfall. The question is: how will the discharge of the ice along the edge of the ice sheet react? And how is the balance between these two? Of course, things can be less positive when the climate change goes on. More precipitation can fall in the form of rain than, and the discharge can overrule the gain of ice again. Nowbody knows, that's why it's so interesting to have a close look on what happens.
- Antarctica is gaining ice
Bart Vreeken at 18:50 PM on 20 May, 2023 After three months, there is another update of the gravitational measurements of the Antarctic ice sheet. The series now runs until February 13, which includes most of the Antarctic summer. Often in February there is a minimum in the amount of ice, but the pattern is not very tight.
We still see that Antarctica as a whole has a better period. Over the last three years, there has been no net decrease in land ice. The small amount of sea ice must play an important role in this. As a result, more snow falls. Apparently, that was enough to compensate for the increased melting and calving along the edge.
Changes to the floating ice shelves cannot be measured in this way. - CO2 lags temperature
Daniel Bailey at 01:46 AM on 19 May, 2023For a longer view of the correlation between CO2 concentrations and global temperatures, look no further than this reconstruction of the past 540 million years of such from Scotese (Scotese 2021 - Phanerozoic paleotemperatures: The earth’s changing climate during the last 540 million years):

Link to paper
And leaving the last word on the subject to Scotese, a true expert in the field:
"It has been long recognized that the Earth’s climate, in particular the average global temperature, has alternated between ”icehouse” and “hothouse” states. More than 70 years ago, studies recognized that these climatic “modes” varied on short-term, medium-term, and long-term timescales. During the past 20 years, due to much outstanding research, we now stand at the threshold to a deeper, more complete understanding of both the tempo and mode of global temperature change during the Phanerozoic.
The Earth’s long-term temperature change is controlled by multiple tectonic and environmental processes that drive the Earth’s climate from icehouse to hothouse conditions, and vice versa. Many of these factors are interconnected by a complex network of positive and negative feedback loops that can accelerate or decelerate changes in long-term global temperature.
We are currently about halfway through a typical glacial/interglacial cycle. If humans did not inhabit the Earth, about 20,000 years from now, global temperatures would have once again begun to fall and ice sheets would have expanded into the oceans surrounding Antarctica and would have descended from the Arctic to begin a slow and steady march across the northern continents. However, this will not happen. The Earth has entered a “super-interglacial”. The injection of CO2 into the atmosphere as a consequence of the burning of fossil fuels has warmed the Earth more than 1°C and will continue to warm the Earth for another 300 years (~2300 CE).
In conclusion, we are leaving our Ice Age heritage behind. A new, warmer world awaits us. The problem we face is not so much where we are headed, but rather how we will get there."
- Arctic sea ice has recovered
One Planet Only Forever at 14:53 PM on 21 April, 2023Albert started an interesting discussion with their comment @120.
I have an update of my questioning comment @124.
My updated question for Albert is "What explains the recent reduced rate of Arctic Sea Ice loss given that global ice mass loss has continued to occur?" (in addition to the links @124 see the EGU "Review article: Earth's ice imbalance" here which has the following in its Abstract "The rate of ice loss has risen by 57 % since the 1990s – from 0.8 to 1.2 trillion tonnes per year")
Similar to my question @124, the answer is not that human impacts have stopped significantly affecting the climate. And, as has been painstakingly pointed out by others, the recent lack of rapid reduction of Arctic sea ice does not mean that the recent rapid reduction of Arctic sea ice due to human induced global warming has ended.
That raises another question. "Why is the admittedly unusual temporary reduction of the rate of Arctic Sea Ice loss being focused on so relentlessly when global ice loss has continued to occur rapidly?"
- Arctic sea ice has recovered
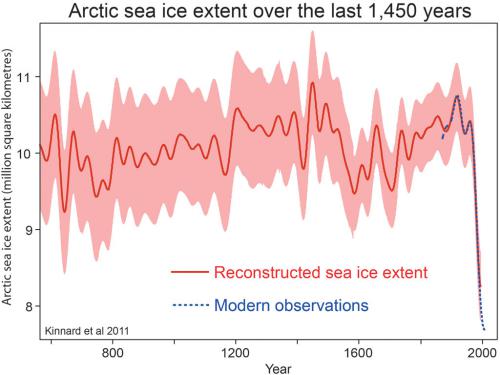
Albert at 17:00 PM on 20 April, 2023The Kinnard has Arctic ice extent increasing from about 750 to 1500 which is an absurdity. Vikings colonised Greenland about 980 and farmed some areas that today are permafrost.
But the graph shows 980 ice extent to be about the same as 1700 and by that time the areas farmed were permafrost.
The graph shows ice extent dropping dramatically from about 1400 but the little ice age was ramping up in 1400, not down.
The graph shows ice extent increasing dramatically from about 1600 but the LIA peaked around 1650-1700 and temperatures have risen sporadically ever since. The Central England Temperature database correlates well with this.
Here is a different reconstruction that shows 1940 Arctic ice to be about the same as
[LINK]
See figure 1b
But the guy was italian and what would they know? See, I can be sarcastic as well.
- Arctic sea ice has recovered
Rob Honeycutt at 15:42 PM on 20 April, 2023"The graph above showing Arctic ice just shows reconstructions because there was no accurate way to measure total Arctic ice before satellites."
Oh ye of little faith is the cleverness of smart researchers.
- Arctic sea ice has recovered
MA Rodger at 23:43 PM on 19 April, 2023Albert @133/134,
Simply accepting anecdotal evidence from newspapers is not the way to determine historical Arctic ice conditions.
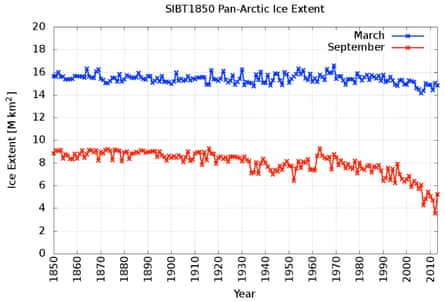
There are serious attempts to create records running back before the instrument era, like Walsh et al (2017) 'A database for depicting Arctic sea ice variations back to 1850' which is the subject of the CarbonBrief article linked @131 with the graphic @132. A little more recently there is Schweiger et al (2019) 'Arctic Sea Ice Volume Variability over 1901–2010: A Model-Based Reconstruction' which reaches similar conclusions, the graphic below from that paper showing rolling annual averages of Arctic SIV and annual red dots.

I would suggest you read the comment @123 if you feel that "no one has challenged the fact that Arctic ice thickness or extent has not dropped since 2012." And I do look at JAXA data and it evidently has "decreased since 2006" in that the JAXA annual average SIE 2006-22 has a linear trend of -0.032M sq km/y, a smaller decline than for the earlier part of the record (-0.51Msq km/y) but still a decline. So it has "dropped."
- Arctic sea ice has recovered
Albert at 21:24 PM on 19 April, 2023"The NASA presentation of Arctic Sea Ice Extent from 1851 to 2017 does not show an 80 year cycle. It shows a fairly significant recent decline of extent of sea ice."
there is an abundance of evidence from newspapers and other sources that Arctic ice extent in the 1940s was low. If i did provide the evidence I suspect that you would just ignore it.
But I will if you request it.
- Arctic sea ice has recovered
MA Rodger at 17:47 PM on 19 April, 2023The pertinent graphic in scaddenp's link @131 cannot be 'hot' linked directly from CarbonBrief but it is available elsewhere online.
It does show the 1940's being as melty as say 1990 but there is no significant 80-year cycle to be seen. The more usual talk of 'cycle' is seen in Arctic temperature records but the same is also seen outside the Arctic and all across the northern hemisphere. GISTEMP zonal data suggests that up in the Arctic the 1940's were as warm as 2000 but the record 1880-on is not long enough to show the presence of any 80-year cycle. However the Berkeley Earth data for Svalbard dates back to 1800 but shows no sign of such a cycle.
And the assertion that in 2023 we are about to see the Arctic plunge back into some cold icy condition for decades is not born out by any SIE or SIV record. The future of Arctic SIE in a warming world may be one of 'difficult-to-reach' ice hanging on or it could be one of it 'going with a rush'. Take your pick. It will likely be a bit of both. But a reversal of recent declines in ice is no more than wishful thinking.
- Arctic sea ice has recovered
scaddenp at 15:38 PM on 19 April, 2023A better link for extent from 1850 is:
www.carbonbrief.org/guest-post-piecing-together-arctic-sea-ice-history-1850/ Same dataset - Arctic sea ice has recovered
One Planet Only Forever at 14:52 PM on 19 April, 2023Albert @126,
What is the evidence for an 80 year cycle of warm waters being brought to the Arctic?
The NASA presentation of Arctic Sea Ice Extent from 1851 to 2017 does not show an 80 year cycle. It shows a fairly significant recent decline of extent of sea ice.
- Arctic sea ice has recovered
Albert at 13:42 PM on 19 April, 2023Looking at the graph should indicate quite clearly that there is definitely no decline since 2012 and your tabulated data also clearly shows this.
Average Arctic ice extent has also plateaud since 2012 (SII) or 2006(MASIE).
If you look at yearly averages since 1979, Arctic ice has only reduced by about 15% and as I wrote above, all this was prior to 2012.
DMI, JAXA, Bremen uni, and others all say the same.
"i would be curious to learn what you believe explains the observed Arctic Sea Ice Mass changes since 2012."
My guess is the cyclic currents that bring warm waters to the Arctic have reached the top of their cycle and are changing to a cooler mode.
Evidence seems to suggest that the cycle is around 80 years and we know that Arctic ice extent was also low around 1940.
- Arctic sea ice has recovered
Bob Loblaw at 05:12 AM on 19 April, 2023Albert @ 120 is doing an Arctic sea ice volume analysis using the standard "skeptic" analysis techniques that go into The Escalator:

- Arctic sea ice has recovered
One Planet Only Forever at 03:16 AM on 19 April, 2023Albert @121, 122, 123,
I would be curious to learn what you believe explains the observed Arctic Sea Ice Mass changes since 2012.
In addition to MA Roger's clarification that Arctic Sea Ice volume is not 'trending up', the lack of statistically significant decline since 2012 needs to be considered along with other evidence like the continued significant decline of Antactic Ice Mass (NASA presentation here) and Greenland Ice Mass (ESSD Article here - see figure 4).
The lack of significant continued decline of Arctic Sea Ice Mass (volume) requires an explanation. But the explanation is unlikely to be that 'global warming impacts of human activity have not been significant since 2012'.
- Arctic sea ice has recovered
MA Rodger at 00:19 AM on 19 April, 2023Albert @121,
I don't think it is true to say "Arctic ice volume has been trending upwards since 2012," certainly not on the basis of PIOMAS data. The 12-month averages (Apr-to-Mar, so bang up-to-date) run like this:-
2011 - 2012 ... ... 13.83 M sq km
2012 - 2013 ... ... 13.44 M sq km
2013 - 2014 ... ... 14.57 M sq km
2014 - 2015 ... ... 15.62 M sq km
2015 - 2016 ... ... 15.00 M sq km
2016 - 2017 ... ... 13.07 M sq km
2017 - 2018 ... ... 13.22 M sq km
2018 - 2019 ... ... 14.11 M sq km
2019 - 2020 ... ... 13.47 M sq km
2020 - 2021 ... ... 13.40 M sq km
2021 - 2022 ... ... 13.98 M sq km
2022 - 2023 ... ... 14.24 M sq km
And a regression through that lot, even starting 2012-13**, gives a negative (thus decreasing) trend although lacking statistical significance. The PIOMAS anomaly graph you link-to @120 is using the same data. Mind, you could get an upward trend (still statistically insignificant) for a different 12-year period (again Apr-Mar); 1982-93 +0.050M/y +/- 0.125M/y.
(**2012 to 22 -0.064M/y +/- 0.156M/y)
- The Big Picture
One Planet Only Forever at 06:34 AM on 22 March, 2023Bart Vreeken @131,
There was no question. I was presenting an understanding based on observations of evidence in your comments. Your presented interpretation of my comments appears to support my observation in my comment @99 that:
"There is a wealth of evidence in Bart’s comment history that appears to indicate that their interests are not Big Picture. Their interests appear to be much smaller/narrower. They appear to be seeking ‘positive perceptions from the perspective of short-term regional interests’."
I have made other comments about the harm of pursuing positive perceptions because it delays learning the Truth about the Big Picture harm being done to the future of Humanity. Arguing for a 'positive, less panicked, perspective' has produced the current serious harm, and risk of more significant harm, to the future of humanity that is presented in the article I pointed to in my comment @130. Another report on that same topic is by NPR "Cut emissions quickly to save lives, scientists warn in a new U.N. report".
The harmful reality you appear try to avoid understanding, even if you present global interpretations, is not altered by speculation based on one year of heavy snow fall on Antarctica and an unsubstantiated perceived correlation between snowfall and sea ice extent, or because Greenland may only melt on its east coast (conclusions you appear to be interested in jumping to).
Also, as I presented in my comment @68, the very negative (panic level severity) of possible outcomes is what the people who benefit most from the harm need to 'mitigate'. It is important to understand that what is referred to as 'climate change impact adaptation' is mitigation required by others because of a failure of harmful people (success from their short-term limited regional interest perspective) to mitigate their harmfulness. And part of how the harmful try to justify being more harmful is by claiming that "It's not that Bad = positive perceptions that the harm is not very significant" or "Harm done is worth it because of the Perceived Positives".
The Big Picture understanding is that it is generally unacceptable to use benefits or potential benefits to excuse harm done or potential harm done. The only case where that 'may be' acceptable is a case where the individual pursuing or obtaining the benefit will be the only one suffering any harm. It does not even apply to a group because different members of a group may obtain different degrees of harm and benefit.
In spite of that undeniable Big Picture understanding regarding the importance of learning to minimize harm and help those who have been harmed, many people today try to excuse continuing to pursue more benefit from being more harmful. And part of their harmful effort is the pursuit of harmful misunderstandings or a focus on 'positive perceptions that minimize the need for helpful mitigation by reducing the perceptions of severity of harm being done' (like claiming that less fortunate people deserve to be less fortunate, or being dismissive of what is happening to places like Bangladesh).
- The Big Picture
Rob Honeycutt at 03:12 AM on 20 March, 2023Bart... At this point I would highly suggest you thoroughly read the paper you're citing because you're just not grasping what they're discussing. In particular take note of the scale of the maps. They're talking about fractions of a millimeter per year. So, at maximum, they're saying the effect around Greenland (deep blue) over the course of the next century would be on the scale of 5 cm, out of a potential of 1-2 meters of SLR.
The region they refer to (northern Europe including the Netherlands, Atlantic coastline of Germany and along theArctic coastline of Russia [Fig. 2a]) would have a negligible effect, meaning neither net positive nor net negative. In other words, no effect.
Here is a link to the paper so you don't have to look it up again. Please read it thoroughly and carefully.
- The Big Picture
One Planet Only Forever at 13:33 PM on 19 March, 2023I find Bart Vreeken’s comments interesting, but not in the same way that Bart appears to be interested.
My interest is the Big Picture of the future of humanity and the development of sustainable ways for humans to share the limited capacity of this planet to be lived on sustainably, to not be compromised by the impacts of human activity. A significant part of that interest is understanding the possible peak effects of the harmful accumulating impacts of continued fossil fuel use.
Bart @84, starts with: “MA Rodger @82 your quote is about the global sea level rise, not the local SLR.” The set of images Bart presents are about ‘global sea level impacts’ of the loss of ice due to global warming. But Bart’s interest is limited to the impact on the Netherlands of ice loss from Greenland. The other presented ice loss evaluations do not ‘interest’ Bart as much. This selective regional, rather than Big Picture, interest can be observed in many of Bart’s comments.
Bart’s comments @533 and @537 on the recently updated SkS Climate Myth “Is Antarctica losing or gaining ice?” appear to be their first presentation (March 9, 2023) of what they find ‘interesting’. It is essentially the following: The most recent heavy snow fall on Antarctica, rather than all the other history of events on Antarctica, may be indicating the future of Antarctica. Why would that be ‘interesting’? Maybe because of what happens to the Netherlands due to ice loss from Antarctica as shown in the image set of Barts’s comment @84 referred to above.
And in Bart’s comment @560 indicates they live in the Netherlands and are concerned about sea level rise but “We have to monitor Antarctica very well, try to understand how it works, try to predict what will happen. But not with panic, that won't help us.” Their ‘interest’ in the potential that the most recent year of heavy snowfall on Antarctica indicating a very different future is like the claims that the lack of warming after 1998 indicated a very different future than the ‘panic about ending the harmful impacts of fossil fuel use, especially the global warming impacts. Many people tried to claim that post 1998 temperatures indicated ‘the end of the warming that some people were panicking about’. And Bart appears to be doing a similar thing by trying to claim that this recent year in Antarctica is a turning point of behaviour in Antarctica (as Bob Loblaw tried to point out in his comment @534 in response to Bart’s comment @533).
There is a wealth of evidence in Bart’s comment history that appears to indicate that their interests are not Big Picture. Their interests appear to be much smaller/narrower. They appear to be seeking ‘positive perceptions from the perspective of short-term regional interests’.
They may be correct about the interpretation of the Green lines of the images in their comment @84 and @87 ... but their lack of interest regarding the potential peak impacts (way beyond 2100 levels) on places like Bangladesh is what I find “Interesting” (and not in a Good Way). See My comment @68.
- The Big Picture
MA Rodger at 21:42 PM on 18 March, 2023Bart Vreeken @80,
That is a curious quote about the Greenland contribution to Netherland SLR given the KNMI Report also says on P22:-
The mass loss of the ice sheets of Antarctica and Greenland and glaciers continues unabated. Since 1993, this component has been the largest contributor to sea level rise.
The idea that the melt water from Greenland, part of the largest contribution to SLR, should somehow choose to avoid the seas off the Netherlands is somewhat silly. I think the idea being expressed is that (as explained within the KNMI Report) SLR is not appearing so much off Netherlands due to altered weather in the North Sea and so the 'Greenland melt' is being used in your quote synonymously for SLR.
- The Big Picture
Bart Vreeken at 20:35 PM on 18 March, 2023Bob Loblow @75 you said:
"Another clue for you: losing ice at lower altitudes around the perimeter of the ice sheet, and gaining ice at the higher altitude is Business As Usual for continental ice sheets. There is this thing called "glacial flow" that moves ice from the accumulation zone to the ablation zone"
Well, that's great. Do you really think I would write about Greenland when I didn't know how it works?
My turn then. The mass change of Greenland by year. Cherry-picking? Maybe, but I use all the available data of GRACE. Over a longer period (altimetry data) there is an increase of mass loss. Don't pay too much attention to the trendline, for the data have a lot of noice. But there is a similarity with Antarctica: more snowfall in the last years, caused by less sea ice.

- The Big Picture
Bart Vreeken at 19:48 PM on 18 March, 2023Thank you michael sweet @72 for the map of Greenland, based on altimetry. I didn't know this one, it's different from what I expected. I was too quick with my map of the SMB anomaly of only this year, it turns out to be untypical. Never the less we don't expect so much contribution from Greenland here. From the KNMI-report we discussed before:
"Many factors have been taken into account in the calculation of sea level rise on the Dutch coast, including the expansion of the oceans due to warming, self-gravitation, the changes in salinity, and the mass loss of glaciers and ice sheets in Greenland and Antarctica. Because the melting of the Greenland Ice Sheet hardly contributes to the sea level rise off the Dutch coast, we expect that the increase here will lag slightly behind the world average."
- The Big Picture
michael sweet at 12:36 PM on 18 March, 2023It is a real phenomenom that when the great ice sheets in Greenland and Antarctia melt that means there is less gravity there and the sea flows away. I remember that around Greenland itself that could be tens of meters less water and more around Antarctia. There are papers describing where in the globe there will be less water and where there will be more water (ths article describes the affect). By looking at the pattern of sea level rise (upthread I posted a map of sea level rise) and seeiing where it is higher and where it is lower scientists can get an idea of where the water is coming from.
Bart Vreeken posted a map upthread, it is probably accurate. They suggested that melting in the Antarctic will result in higher sea level rise than the global average but melting in Greenland will result in less sea level rise than the global average in Holland. Different parts of Greenland affect Holland differently.
There are other effects on sea level rise that are not intuative. The Gulf Stream carries water from North America to Europe. Sea level in Europe is about 1 meter (!!!) hgher than off North America. If the Gulf Stream stopped, sea level in Europe would decrease substantially while the East coast of the USA would flood. Who wudda thunk.
- The Big Picture
Bob Loblaw at 11:28 AM on 18 March, 2023Bart @ 62:
In addition to pointing out what Rob said to you at comment 64 about the error in using Surface Mass Balance, I note that you have also given a map of SMB for a single winter season. Do you not bother looking at the ful captions of the figures you pick up? This one does not need translation from Dutch - it is dated March 16, 2023, and states "Accumulated anomaly since Sep 1, 2022".
You're back to the same basic error that you made in your very first post here at SkS on March 9, regarding Antarctic ice. Treating a single year of data as if it represents a long term trend.
At least you honestly say "...how the Greenland Icesheet reshapes at the moment..." Now all you need to figure out is that "the moment" is not enough to make predictions about the future.
Another clue for you: losing ice at lower altitudes around the perimeter of the ice sheet, and gaining ice at the higher altitude is Business As Usual for continental ice sheets. There is this thing called "glacial flow" that moves ice from the accumulation zone to the ablation zone. You should read about it some time.
- The Big Picture
One Planet Only Forever at 08:58 AM on 18 March, 2023The comments have improved my understanding of sea level rise.
Thank you Rob, Bob and Michael.
Though I lack detailed background knowledge regarding sea level rise I feel confident about pointing out that the 'peak sea level rise', not 'sea level rise by 2100', is what the future of humanity will have to deal with.
From an ethical and moral perspective, the people who benefit(ed) most from causing the harmful result should be responsible for paying for the required mitigation and adaptation. The more that they suffer because of the 'mitigation actions to rapidly end the harmful impact' the less they will have to pay in advance for the required adaptations. This avoids the problem of 'benefiting from harm done while evading the consequences of the harm done'.
What is happening today is serious unethical and immoral attempts to make the future impacts worse and avoid paying for the required repairs and adaptations. The 'highest harming' portion of the global population is not building CO2 removal devices now required to bring harmful impacts back down to 1.5 C levels of warming. And that group is also not planning to pay for the required adaptation in places like Bangladesh (or the island nations being submerged).
I will go one step further on the point of the real problem being the peak impact that has to be adapted to. There is uncertainty regarding how much adaptation is 'enough'. As a structural engineer I am very familiar with the requirements for all load resisting aspects of a structure to have a very low probability (less than 2%) that very severe potential future impacts would exceed the performance capability of the aspects of the structure. And aspects of the structure that are Primary, where their failure would cause significant overall structure failures, would have redundant mechanisms that would keep the structure system from collapsing due to the failure of a Primary element.
Sea level rise impacts would be equivalent to impacts on Primary Structure elements. So the sea level rise that the biggest beneficiaries of fossil fuel use in the current generation are ethically obligated to build globally, for all of the inhabited areas affected by the future sea level rise that they benefited from causing, would be the 'peak sea level increase' that has far less than 2% chance of being exceeded.
The big question is not the different evaluations (uncertainty) regarding the ways that Greenland and Antarctica will respond to human caused global warming. The big question is: What level of warming is almost certain to be the maximum level of the harmful human impacts.
- The Big Picture
michael sweet at 00:27 AM on 18 March, 2023Bart Vreeken:
According to the Dutch Weather Institute (KNMI),
"sea levels will rise 1.2 to 2 meters (3.3 feet-4 feet) over the next 79 years if greenhouse gas emissions are not reduced immediately and the melting of the Antarctic ice sheet accelerates."
I found a description of the Dutch Weather Institute as the national weather authority in the Netherlands. Certainly there are projections of up to 2 meters of sea level rise in the Netherlands. Can you provide a link to support your claims? I cannot read most of your graph but it appears to be dated 2005. More recent projections have been much higher than older projectins.
- Antarctica is gaining ice
Bart Vreeken at 02:57 AM on 17 March, 2023Pfff, it looks like knowledge of psychology is more useful here then knowledge of Antarctica and climate change. How to react? A person called 'One Planet only forever' makes his or her own analyzation about 'people like me'. But isn't even willing to tell his or her own name. Why is that? I think an open discussion without hide-and-seek is more effectful and respective. About my motivation: my only motivation is trying to understand Antarctica and sharing information on that. And discussing that, but in a positive way. OK, lets stay on topic.
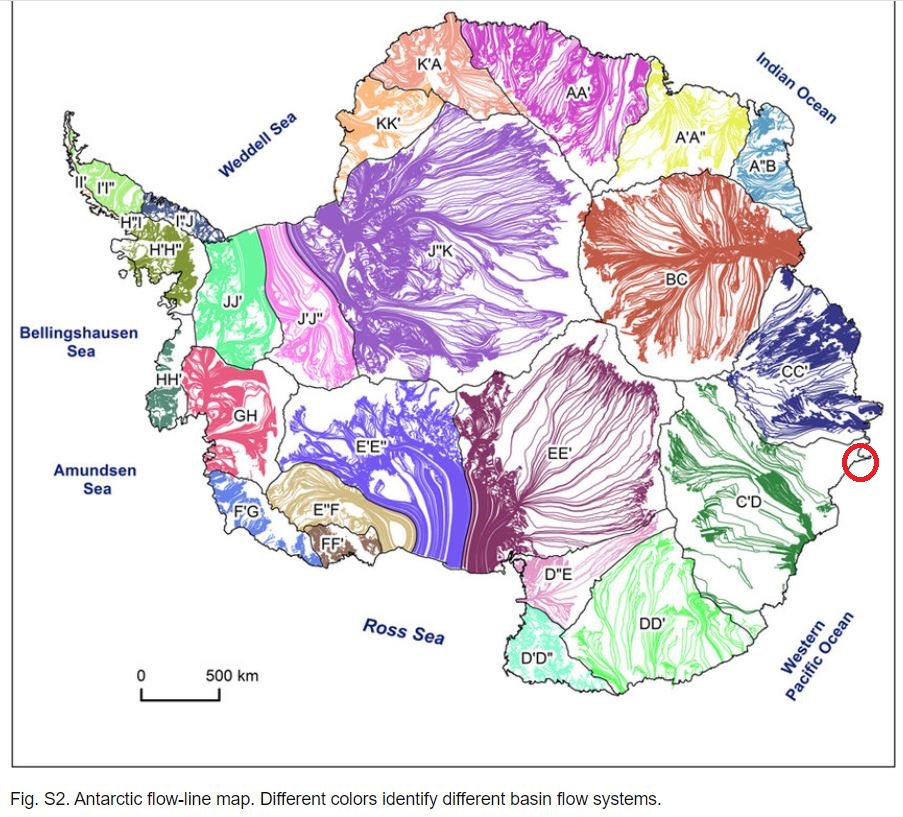
We had a discussion about the the collapse of the Conger glacier's ice shelf. Here's an article on Change in Antarctic Ice Shelf Area from 2009 to 2019. In this period the ice shelves around Antarctica have gained a modest 0.4 %, or 5,304.5 km2 the study says. The study does not include the last three years. A low sea ice extent won't be good for the ice shelves, so I think we can expect that they lost some of there area.
egusphere.copernicus.org/preprints/2022/egusphere-2022-1087/egusphere-2022-1087.pdf
And then a rectification. I made calculations on the total discharge of Antarctica, based on the Surface Mass Balance (SMB) and the GRACE data. But the SMB calculated here also includes the ice shelves, and that part does not count for the mass change of the ice sheet. So, the SMB for the grounded ice will be less, and the discharge of the grounded ice will be less. In the literature I found numbers like 1750 Gt/yr.
- Antarctica is gaining ice
Bart Vreeken at 05:06 AM on 15 March, 2023"Did you happen to notice the title of the article John posted?"
Well I did! I have the strange habit to start with the title when I read an article ;-). And here it's about sea level rise. That item has my attention. I live in The Netherlands, which is a very low lying country. Large parts of it have a certain risk for flooding, by the sea of by rivers. My own house is only at 10 centimetres above sea level! But for centuries, the land is well protected by dikes. So, the risk is not so very high. But we have to be prepared for the future. The land will sink further, the sea level will rise higher, the rainfall will be more irregular and so on. So yes, sea level rise is a big issue here.
About the article. The disappearance of the ice shelf itself is no good news. But when I look at the position of it, I don't see a lot of ice from the ice sheet that will be on the move now. That's my point.
We have to monitor Antarctica very well, try to understand how it works, try to predict what will happen. But not with panic, that won't help us.
- Antarctica is gaining ice
Rob Honeycutt at 04:09 AM on 15 March, 2023Bart... Did you happen to notice the title of the article John posted?
"Why East Antarctica is a 'sleeping giant' of sea level rise"
Don't you think that's interesting?
- Antarctica is gaining ice
Bart Vreeken at 02:09 AM on 15 March, 2023Ah, thank you John Hartz @557
Yes, I noticed the article too. Indeed, the iceshelfs are the missing part of information and indeed, they are more vulnerable when the sea ice extent is low. But when we look at the position of the Conger's ice shelf (it's in the red circle on the map below) there is something strange. There isn't much inflow of ice from the ice sheet above. And when there isn't inflow, an ice shelf will disappear sooner or later. Maybe the pattern of the ice flow has changed during the years?
So, let's hope that the other ice shelfs are doing better. At least, the collapse of the Conger's ice shelf didn't influence the mass balance of the total ice sheet (the non-floating part) too much last year. It showed an increase of mass.
- Antarctica is gaining ice
John Hartz at 12:01 PM on 14 March, 2023Bart @ 556:
"More information" does cometh rather quickly. The following in-depth artice was posted on BBC's Future feature yesterday:
Why East Antarctica is a 'sleeping giant' of sea level rise by Alec Luhn. Future, BBC, Mar 12, 2023
The lede for the above article:
Scientists once thought the East Antarctic ice sheet, which contains enough water to raise sea levels 52m (170ft), was stable. But now its ice shelves are beginning to melt.
A key pragraph from the article related to your comments on this thread:
Usually, glaciers move at a glacial pace. The speedy collapse of the Conger's ice shelf came after some of the most dramatically warm weather ever observed in Antarctica. For the first time since satellite monitoring began in 1979, the sea ice extent around Antarctica dropped below 2 million sq km (770,000 sq miles). Less sea ice means more waves battering the ice shelves in front of the glaciers. Massive fields of sea ice off of Adelie Land, Wilkes Land and Princess Elizabeth Land in East Antarctica completely disappeared.
- Climate Science Denial Explained
michael sweet at 03:40 AM on 14 March, 2023Foster:
Fortunately Dr. Inferno at the Denial Depot site wrote a summary of this issue way back in November 2010. How thngs never change! They just blow up the Y axis and say there is no change.
How To Cook A Graph SkepticalScience.com Style
He even has Skeptical Science in the title of the post!! (Dr. Inferno is a tounge in cheek satire site). Unfortunately, Dr. Inferno has not posted since 2016. If anyone knows who Dr Inferno is tell him that his fans are waiting his next post with eagerness.
This is my favorite graph (link to blog post explaining the tilted baseline) from Dr Inferno showing that Arctic Sea Ice is increasing. Monckton actually used a graph in a presentation that had a tilted baseline like this.

- Antarctica is gaining ice
Bart Vreeken at 07:09 AM on 13 March, 2023As I said, I was hoping for a more serious discussion on this site.
What went wrong: in my first post I wanted to show the graph with the SMB as well. I must have done something wrong, for it didn't came up. Sorry for that. But this information is not so hard to find. MA Rodger succeeded in doing this, Bob Loblaw preferred to show a stupid graph about cherry-picking. Well, that's not the point here.
Anyhow. The correlation between SMB and mass change was not clear, so I put them together in one table. The SMB is calculated over November - November. The original graph gives the anomaly of the SMB. The average mass of the anomaly seems to be some 2700 Gigaton, so I added that to the anomaly. Then the discharge of the ice sheet can be calculated as the difference between the GRACE data and the SMB.
The result is interesting: there don't seem to be much correlation between SMB and discharge. Strange enough, in the last year with little sea ice the discharge was even less then normal.
An important thing could be that GRACE isn't measuring the total amount of ice, but only the amount above the sea level. So, increased calving from floating iceshelfs isn't noticed.

- Antarctica is gaining ice
Bart Vreeken at 03:32 AM on 11 March, 2023Bob @545
I expected a more serious discussion here.
Of course, snowfall is not SMB. There is also surface melting, runoff, wind blow, evaporation. In the figure i posted above you can see the difference between the SMB and the snowfall (dashed line). But of course, there is a big corralation between SMB and snowfall.
And SMB is not the same as the total Mass Balance. I never said the the mass loss has stopped. (OK, last year incidentely).
The SMB of the last seven years is showed in the figure I posted above. Source:
www.climato.uliege.be/cms/c_5652669/fr/climato-antarctica
As you can see, the SMB of season 2022-2023 ended ca 310 Gt above average. And so on.
And yes, its not completly consistent with the diagram in comment 533. The diagram shows the mass change between 2021/11/14 and 14 2022/11/14, based on gravimetry. The SMB is calculated over 2022/03/01 until 2023/03/01 based on weather models.
With a close look to the SMB figure you can also derive a SMB over the same period as the GRACE data.

- Antarctica is gaining ice
Bart Vreeken at 06:01 AM on 10 March, 2023Bob Loblaw @ 539
I don't think focussing on the noise is a good idea ;-)
When we just look at the GRACE data then the year 2022 is one in a row of 20. After last year the average has changed, which is interesting by itself.
But during this 20 years things have changed. The extent of the sea ice has declined. So more water vapour comes to the continent, which gives more precipitation. The question is how this works out. The last year gave us a hint that it can add a lot to the Surface Mass Balance. The next question is: how much will the SMB increase, and how much will the discharge increase. Of course, that's very uncertain. In the paper I called it says in the abstract:
The surface mass balance in SSP5–8.5 simulations shows a pattern of strong decrease on ice shelves, caused by increased melting, and strong increase on grounded ice, caused by increased snowfall. Despite strong surface and basal melting of the ice shelves, increased snowfall dominates the mass budget of the grounded ice, leading to an ensemble mean Antarctic contribution to global mean sea level of a fall of 22 mm by 2100 in the SSP5–8.5 scenario. We hypothesise that this signal would revert to sea-level rise on longer timescales, caused by the ice sheet dynamic response to ice shelf thinning. These results demonstrate the need for fully coupled ice–climate models in reducing the substantial uncertainty in sea-level rise from the Antarctic Ice Sheet.
- Antarctica is gaining ice
MA Rodger at 01:05 AM on 10 March, 2023Bart Vreeken @533,
You appear to be plotting out the GRACE/GRACE-FO data as per this NASA web page (which shows data to Oct 2022). This gravity data does not measure Sea Ice which is floating. And for clarity, it is not Surface Mass Balance which you correctly say had an exceptional year last year (as per this NSIDC post of January 2023, snowfall being high enough to "completely offset recent net ice losses from faster ice flow off the ice sheet for this assessment period. Most of the past decade has seen annual net losses of 50 to 150 billion tons."

So a record year for the 2023 Antarctic Sea Ice Extent minimum as well as a record year for the 2022 Antarctic Surface Mass Balance.
Antarctica doesn't get a lot of attention, compared to the Arctic cryosphere. Certainly for Antarctic Sea Ice, the mechanisms driving the variations is a lot less straightforward in the Antarctic.
- Antarctica is gaining ice
Bob Loblaw at 00:33 AM on 10 March, 2023Bart Vreeken @533:
What exactly is your point? The links between sea ice area and land ice mass are not simple, and have been discussed in the detailed sections of the blog post and earlier comments.
In your graphic, it is obvious that the two major years of land ice gain (2016, 2022) follow several years of strong mass ice loss. This is easily explained as a rebound effect.
This web page on Grace data has an embedded video with data to 2020. Rather than portraying the annual changes it shows the overall trend in the absolute value from year to year. Clearly, Antarctic land ice is losing mass in the long term - with short terms ups and downs.
Are you perhaps over-analyzing the significance of short-term changes, as is often done with temperature changes? (As seen in The Escalator).
- Antarctica is gaining ice
Bart Vreeken at 23:07 PM on 9 March, 2023
It looks like the Antartican Ice Sheet had a very good year, as far as we can see. At least, the mass balance over the period november 2021 - november 2022 was far positive. This can be due to the very low extend of the sea ice. The Surface Mass Balance over the melting period of last year turned out very positive. I don't read much about this, the focus in de media is on the low extent of the sea ice. Any thoughts about this?
I did expect a new update of de GRACE data of December 2022, but it comes late again.
- 2023 SkS Weekly Climate Change & Global Warming News Roundup #2
EddieEvans at 23:30 PM on 17 January, 2023If you are following US politics, you may believe that descent is underway. It would not matter in any case. I refer to history, especially after US President Johnson pointed to the issue in 1965, over half a century ago. I also refer to Jame's Speth "They Knew: The US Federal Government’s Fifty-Year Role in Causing the Climate Crisis," and Juliana vs The United States Government. James Hansen recently co-authored a paper on CO2 in the pipeline, and it was not encouraging. Then there's global dimming and the rest, not to mention Arctic Sea ice melt, which no one has found a way to rectify. I could go on and on. I have not seen research on cooling the global ocean in any short-term scenario. What I'm reading says "hundreds of years," at least. If you have more comforting information, I would enjoy seeing it. We have no idea what we are handing to the next generation. "Nature is very complex to think about, and probably more complex than we can think."
- 2023 SkS Weekly Climate Change & Global Warming News Roundup #1
gerontocrat at 00:22 AM on 9 January, 2023The Antarctic sea ice area has behaved in a very different way in the last 10 years or so. You can see that from the 2022 annual average sea ice area graph which you can see at
https://forum.arctic-sea-ice.net/index.php/topic,1759.msg355482.html#msg355482
- 2023 SkS Weekly Climate Change & Global Warming News Roundup #1
EddieEvans at 22:58 PM on 8 January, 2023Scientists Report a Dramatic Drop in Antarctic Sea Ice
Decades ago I became overconfident that at least the Antarctic remained safe from melting. Somewhere I had read that the Antarctic would take a couple more centuries before the effects of the new climate change would begin to melt the Antarctic, but I misplaced my confidence.
https://youtu.be/m-cyN_sREVc
- What on Earth is a polar vortex? And what’s global warming got to do with it?
Eric (skeptic) at 01:39 AM on 28 December, 2022Thanks for that nicely balanced article. For the recent event the AO index went negative. Negative AO is not necessary for an Arctic outbreak but it's indication of a north-south tendency in the jet stream. Also if negative AO leads to an outbreak, that outbreak could be anywhere in the NH and may not make the U.S. centric news in the U.S.
So a logical question to ask is what is the trend of AO? No trend: www.cpc.ncep.noaa.gov/products/precip/CWlink/daily_ao_index/month_ao_index.shtml. The papers by Francis a few years ago referenced the AO starting late fall and winter. That makes sense because the anomalous heat release from refreezing open water is highest in the fall continuing into winter. Arctic tempeature deviations from normal are highest in winter: ocean.dmi.dk/arctic/meant80n.uk.php. But consistently higher in the fall.
The CPC website provides a rendering of JFM AO: www.cpc.ncep.noaa.gov/products/precip/CWlink/daily_ao_index/JFM_season_ao_index.shtml. Perhaps a positive trend. One paper claiming a jet waviness trend used data ending in 2013. iopscience.iop.org/article/10.1088/1748-9326/10/1/014005 That's not convincing anymore given the newer data with opposite trend.
To show a connection, someone will need to take an index like AO and the temperature data e.g. DMI and look for changes in the index corresponding to increases in fall warmth shown in the temperature data starting around day 250.
It seems likely that we would see some correlation in the winter data from negative AO to the many of the spikes of warming shown in DMI. That would be correlation but would not mean the temperature spikes caused negative AO. More likely the opposite and a careful analysis of timing might tease that out.
- It's a natural cycle
MA Rodger at 23:30 PM on 16 December, 2022Long Knoll @33,
If confusion is sought, the early attempts at creating an Arctic Sea Ice Extent/Area record is a good place to start.
The 'splice' of two of these early attempts was probably not the work of Heller but of a Kenneth Richard shiown in this NoTricksZone post from 2016.
The more recent part of the spliced graph is taken from Fig 7.20a in the first IPCC Assessment Report of 1990. A similar graph appears in the second IPCC Assessment Report of 1995 as Fig 3.8a. These Arctic Ice records do not match later records which begin to appear in Chapman & Walsh (1993). I have plotted out these various records (see here the graph posted 16/12/22) but have not had any success finding an explanation for the dip in Arctic Ice levels 1973-76. (The use of US Navy data is not something considered accurate today, but the decision not to use it or to use it differently is not something I have seen explained.)
The earlier part of the 'spliced' graph is from Vinnikov et al (1980) which isn't on-line but note the graphic in this 2013 slide show by Vinnikov from Vinnikov et al (1999) (abstract on-line) presents a record consistent with the current records. And for good measure Walsh is one of the co-authors of Vinnikov et al (1999). So again we see a major reappraisal of the data which hasn't been explained in the literature. And without access to these early papers, the question remains of what the basis for these early records actually is. (And my assertion back in 2017 that Vinnikov et al (1980) was plotting summer ice levels is probably wrong.)
- It's a natural cycle
Long Knoll at 03:54 AM on 16 December, 2022MA Rodger @30,
I'm confused by this post, and have probably just misinterpreted it. If, as you say "Vinnikov (1980) fig5 is a plot of the annual ice coverage for the months of July, August & September" that would imply ice coverage was similar in 1935-1960 to what it is now; NSIDC data shows that July, August and September mean Arctic ice cover averages at about 6 million square kilometres in recent years, just as the Vinnikov graph does from 1935-1960. That can't be right. In fact, the idea that there was 6 million square miles of coverage for July-August-September over 1935-1960 is contradicted by the recent study Walsh et al 2016, Carbon Brief story In the study, the month September, which obviously has coverage below the July-August-September average, had an average cover of over 7 million square kilometres from 1935-1960.
And what error has Heller made exactly in his attempt to graft the two graphs together? Has he incorrectly aligned them, or are the data between the two graphs simply showing different things?
- Arctic icemelt is a natural cycle
MA Rodger at 20:04 PM on 23 October, 2022stranger1548 @76,
The climate system is a complex beast and because of this it is possible to have issues like the Arctic climate change where there are not just contradictory findings yet-to-be-resolved, but also apparently contradictory findings but which, when examined in detail, are not actually contradictory but looking at slightly different aspects of the same thing.
Thus the 'Intermediate' OP here quotes Notz & Marotzke (2012) 'Observations reveal external driver for Arctic sea-ice retreat' which says there is no correlation between PDO & Arctic SIE while, for instance, this 2016 CarbonBrief post by Screen & Francis says the PDO does impact the Arctic warming.
But digging into the research, Notz & Marotzke are looking at long-term trends in summer Arctic SIE while Screen & Francis (2016) 'Contribution of sea-ice loss to Arctic amplification is regulated by Pacific Ocean decadal variability' are looking at oscillations (so not long-term trends) and winter Arctic climate (so not summer) and are interested in the winter Arctic temperatures and how the PDO impacts temperature at differening SIE levels.
That is not to say that there are contradictory findings in the literature, but if there are such findings they need to be addressed on a paper-by-paper basis.
- No, a cherry-picked analysis doesn’t demonstrate that we’re not in a climate crisis
nigelj at 07:59 AM on 8 October, 2022Sea level rise appears to be following a quadratic (parabolic) curve. Perhaps this is not surprising because steadly increasing and accumulating CO2 levels in the atmophere and known positive feedbacks causing the warming trend, would be consistent with a parabolic function, and not so much a linear or exponential function. But if antarctic ice sheets physically destabilise that could be a local exponential function.
- What’s going on with the Greenland ice sheet?
MA Rodger at 23:09 PM on 3 September, 2022Wayne @4,
I was in two minds on continuing our interchange, but I decided I would continue when I came across coverage of the paper underlying this SkS OP which surprisingly appeared today on the pages of my local rag with the title "Zombie ice to raise global sea level". On-line I see the same story getting into newspapers elsewhere (eg The Washigton Post).
In terms of an SLR-CO2 correlations, I don't recall seeing Hansen provide it. I believe the closest he got was in Hansen et al (2013) 'Climate sensitivity, sea level and atmospheric carbon dioxide' (with its well-used Fig 1) which looked at temperature & SLR but only inferred CO2 levels with very cursory checks to actual CO2 reconstructions.

And for me, Hansen's 5m SLR by 2100 was always a bit of theorising that I struggled with. Even after it appeared properly written up in Hansen et al (2016), which at least answered the energy equations that were my initial objection to such a large SLR projections, for me it still remains more 'discussion document' than a full-blooded argued case. In my view, worrying as it is, the future SLR from Greenland & Antarctica depends on the Precipitation minus Ice-Loss balances and that puts us in the hands of climatologists for the precipitaion and glaciologists for the ice-loss. The application of paleoclimatology and whether Greenland melted out in the Eemian isn't so relevant for our future SLR.
Just to throw in my other SLR bug bear which also becomes relevant here, I've always reckoned SLR ain't gonna stop at 2100. So why do we go on so long about the 2100 SLR when by 2150, 2200, 2300 etc it's going to be seriously bigger? (A total of 2.3m SLR/ºC AGW according to IPCC AR5 fig13.14.)
The SLR-ΔCO2 relationship is of course a paleoclimate thing, so may not be immediately relevant outside the Eemian or now we have a Panama Isthmus connecting N&S America. That said, the SLR-ΔCO2 relationship is usually a step beyond what most graphics provide, but fig 6 of Rea et al (2021) 'Atmospheric CO2 over the Past 66 Million Years from Marine Archives' does provide us a ΔT-SLR-ΔCO2 graphic. Note that they do not attempt to be definitive with this CO2 reconstruction, saying "While each method has uncertainties, these are largely independent, so their broad convergence on similar CO2 histories is encouraging."
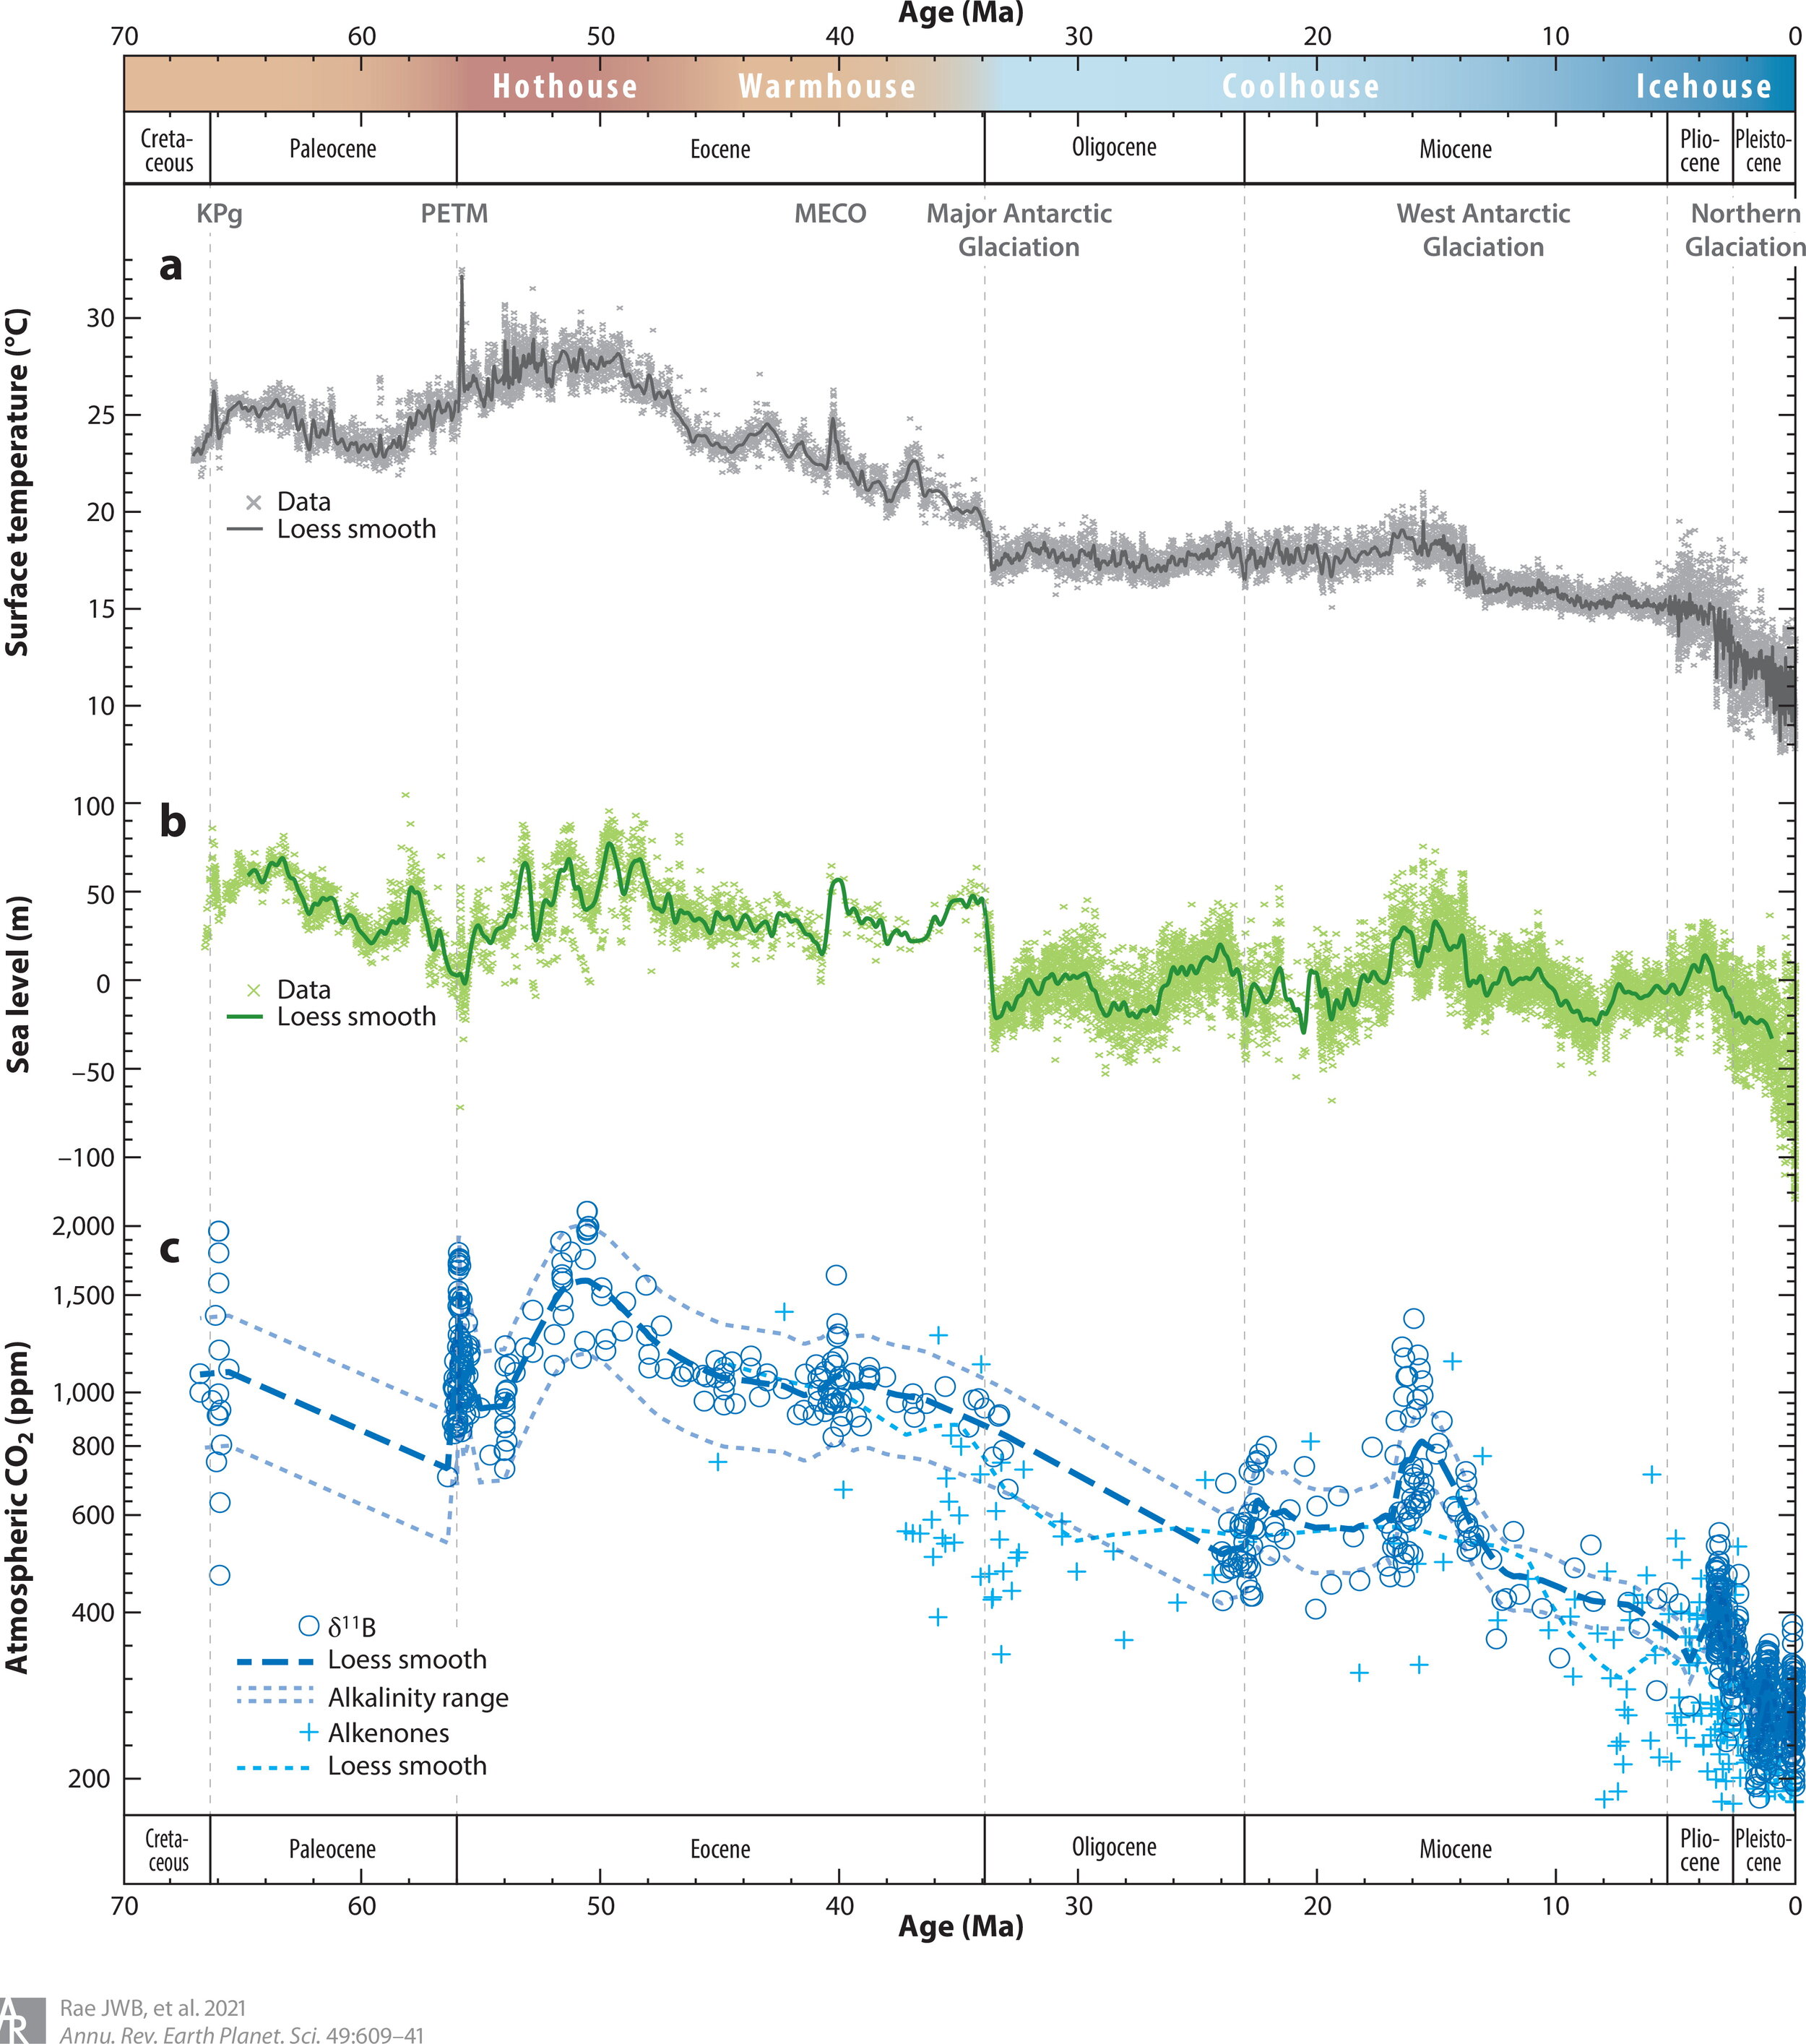
But I stress the idea that paleoclimate stuff should concede precedence to glaciology when it comes to the melting ice caps today and glaciology is where the paper underlying the SkS OP above comes from, Box et al (2022) 'Greenland ice sheet climate disequilibrium and committed sea-level rise'. I read that paper as saying that, as of now (2000-19), Greenland is not tipped over into melt-out mode (which I think was always seen as requiring a little more AGW to do that tipping, but nonetheless is good news to hear said) and that the Greenland melt which we are committed-to will happen in the next several decades, not several centuries, and will be mainly over by 2100.
So at least for Greenland under the AGW so-far, my bug bear (that we are in denial ignoring massive SLR awaiting us post-2100) is assuaged.
Mind, the SLR thus awaiting from Greenland isn't trivial. And there is still Antarctica. And not forgetting we still have the tiny task of halting future AGW.
- What’s going on with the Greenland ice sheet?
MA Rodger at 23:10 PM on 31 August, 2022wayne @1,
I'm not sure of which 'geological record' you are looking at, but I would reckon the tectonocally-changing 'geology' itself had some impact on the relative global temperature & thus sea level back when CO2 was last up at 425ppm.
The last time we saw 425ppm would be back 13 million years ago when the Arctic had no ice caps. The Arctic began getting seriously icy about 3 million years ago, apparently due to the Panama Isthmus forming to connect N & S America. There was also a widening of Drakes Passage at this time. The climate went through some interesting periods at this time 3my ago, with a period of warming with rising CO2 (but not quite back up to 425ppm) leading on to cooling & the icy Arctic.
- What on Earth is up with Heatwaves?
Jan at 01:42 AM on 12 August, 2022The video is a nice example of why even the experts loose the oversight and do not anymore understand what's going on or what's causing this heat to become so much more likely as you have to understand Earth for the complex answer!
(1) higher mean temperatures - so much is clear!
(2) non-linear increase in marine heat waves - neighboring landmasses get cut off from moisture and neighboring warm waters lead to higher temperatures over coastal areas.
(3) the drying out of the atmosphere - relative moisture values decline over the land masses leading to higher temperature increases as evaporation is not buffering temperature increases what is supercharging the drying out of the vegetation what is again reinforcing the drying out of the atmosphere - vicious cycle!
(4) early snow melt leads to dryer springs and summers which become warmer. And receding snow cover now in all seasons.
(5) drying our of rivers which is increasing the drying out of the vegetation and atmosphere. Here the smaller glaciers that are vanishing are important, as many small streams are now vanishing.
(6) higher water vapor content in the tropics leads via extreme convection in the tropics over the expanding warm water surfaces to an increased release of latent heat - condensation - and when the dry but extreme energetic air descends it gets extremely warm again on its way down (gets compressed again) where it causes extreme heat waves - across the subtropics where the air of the tropics normally descends. Further, the dry air descends into drier air thus no clouds forming.
(7) the meridional heat transfer in the Earth system in speeding up thus warmer waters and warmer air masses move farther away from the poles which are then contributing to extreme heat waves.
(8) As the tropical oceans are warming fast - e.g. indo-pacific warm water pool is expanding fast - extreme convection is intensified thus the brian dobson circulation in the stratosphere is enhanced - the air raises from the surface oceans ou into the stratosphere from where i risies further up on its way to the poles only to come down again in the mid to high latitudes. And where the air from the stratosphere descends it can reinforce heat waves (high pressure systems) across the mid and high latitudes. Further, the descending air from the stratosphere brings high Ozone loads to the surface what is also contributing to the heat at the surface.
(9) then we have a changing planetary circulation - the meridional direction (north/south) is increasing and the zonal direction (east/west) is weakening. The main cause is here that the zonal air flows are increasingly disturbed and redirected into a meridional direction by blocking systems.
(10) the increasing transport of cold air equatorward and warm air poleward leads to increasing zonal temperature differences which reinforce north/south air movements. And tropical/subtropical air moving poleward causes more heat waves.
(11) vanishing sea ice disturbs the jet around the Arctic and Antarctic now which is meandering more thus also contributing to an increasing meridional air transport leading to more heat waves.
(12) next dryer air leads to lesser clouds - and as we observe now large areas of the continents drying out the cloud feedback in heatwave-affected areas is getting stronger. Further, we observe now over heatwave regions and marine heat wave regions a decline of cloud cover thus we have here also a vicious cycle.
As a concluding remark: the emergence of large-scale exceptional heat waves is in many aspects a vicious cycle that will have an extreme impact on the carbon cycle and its subcycle the methane cycle now becoming an important driver for global warming - in short: we have now entered self-amplifying warming!
And sorry for the mistakes i have made, but this was only a short improvised oversight of the factors driving the recent emergence of extreme heat waves long before we anticipated them!
- It's the sun
MA Rodger at 22:04 PM on 3 August, 2022cgfree59 @1301,
The best initial assessment of any work by the Connolly brothers or Willie Soon is to assume it is yet another pile of their usual nonsense (I was much surprised recently seeing an NSIDC blog actually citing one of their papers for real!!) and given the lengths they go in obfuscating and misdirecting folk, this is not entirely a falacious use of an ad hominem argument.
There are responses to this particular serving of nonsense Connolly et al (2021) 'How much has the Sun influenced Northern Hemisphere temperature trends? An ongoing debate' (thus a layman's efforts or a reply from the numpties themselves to a criticism of press coverage of their paper) but I do not see anything here at SkS.
The conculsions of Connolly et al (2021) are to assert that the IPCC is premature with its conclusions as it ignores certain estimates of TSI and thus solar forcing which provide radically different results to the global warming attribution reached by the IPCC.
"Different TSI estimates suggest everything from no role for the Sun in recent decades (implying that recent global warming is mostly human-caused) to most of the recent global warming being due to changes in solar activity (that is, that recent global warming is mostly natural)."
You could expend time and effort trawling though Connolly et al (2021), picking out the obfuscation and misdirection they employ but the crux of it is the crazy method they use. That is they the employ blind curve-fitting of their preferred solar-caused climate forcing onto some crazy NH temperature estimates and only after this first-step into the lunatic asylum do they then get to attributing the left-overs of any temperature trends to anthropogenic forcings.
So the results are pure nonsense.
Further a rather telling observation is that of these TSI estimates which they claim are being ignored (TSI High Variability Estimates all plotted out in their Fig 3), only two would allow any naive correlation between rising global temperature with TSI through the all-important "recent decades."
One of these two exceptional TSI estimates was scaled from a postage-stamp-size graphic in Ammann et al (2007), a paper which contradicts the muppets in that it concludes:-
"Although solar and volcanic effects appear to dominate most of the slow climate variations within the past thousand years, the impacts of greenhouse gases have dominated since the second half of the last century.
The second is cherry-picked TSI estimate is from yet another tiny graphic (Fig 5b of Egorova et al 2018) in turn the trace being based on Muscheler et at (2016) which employs proxy data to create estimates of TSI, so not a precise method you would want to put much faith in.
The numpties offer no comment on such an obvious problem with their grand thesis, that it has such a narrow and less-than-reliable basis for the singularly important calculation within their account. Such an omission is a sign that you have strayed from reasonable analysis and entered the lunatic asylum. - Antarctica is gaining ice
Philippe Chantreau at 09:09 AM on 20 June, 2022Andrew,
Your accusations are unwarranted. The recent exchange on this thread is a shining example of how some will believe assertions that are false, and will continue to believe them even after being shown without a shadow of a doubt that they are false. This behavior is contrary to a sincere scientific approach. It is not widespread among those who participate regularly on this site. The allusion to government bla-bla is rather ironic for 2 reasons. One is that you used a government agency as a source for your argument, and said government agency was publicizing scientific work headed by a government employee (Jay Zwally), pretty much the boss of glaciology at NASA. How did that irony escape you?
Second, because governments have taken so far no significant action and most of them can even be described as actively resisting change. Some may pay lip service and have plenty of nice sounding declarations, but actions are more important than words, and governmental actions have so far been tepid, at best.
I note that NASA has updated their position since publicizing the Zwally study, as well they should, because knowledge and understanding evolve and what matters is the weight of the evidence. I have no doubt that Dr Zwally thinks no different.
The Zwally study (full paper with that link) is a well known outlier. It was a surprising outlier back in 2015 when published and generated a lot of interest. In the 7 years since publication, it has been contradicted by numerous subsequent studies that benefited from the data from IceSat2 launched in 2018.
Because of that 2015 paper, there has been more scientific enquiry into this problem, which led to multiple publications. That is science at work. The Rignot et al (2018) paper is arguably one of the best researched, but there are plenty more:
wwhttps://www.science.org/doi/10.1126/science.aaz5845w.science.org/doi/10.1126/science.aaz5845
www.researchgate.net/publication/233806259_A_Reconciled_Estimate_of_Ice-Sheet_Mass_Balance (full article accessible as pdf)
About sea level:
I have worked in various areas involving science and engineering. Anecdote is no substitute for data and rigorous analysis.
Careful data gathering and analysis has been performed by numerous teams and, once again, there is an unmistakable convergence of results. Multiple scientific works can be fond in literally seconds on this subject.
It is entirely expected that see level not be uniform and that sea level changes vary by region. That variability itself is the subject of multiple studies.
- Antarctica is gaining ice
Andrew LB at 07:26 AM on 20 June, 2022
"Over the last two decades, the Greenland and Antarctic ice sheets have been losing mass, glaciers have continued to shrink almost worldwide, and Arctic sea ice and Northern Hemisphere spring snow cover have continued to decrease in extent (high confidence) (see Figure SPM.3). (4.2-4.7)"
NASA Study in 2015 clearly states Mass Gains of Antarctic ice sheet are greater than losses. I'll quote it.
A new NASA study says that an increase in Antarctic snow accumulation that began 10,000 years ago is currently adding enough ice to the continent to outweigh the increased losses from its thinning glaciers.
The research challenges the conclusions of other studies, including the Intergovernmental Panel on Climate Change’s (IPCC) 2013 report, which says that Antarctica is overall losing land ice.
According to the new analysis of satellite data, the Antarctic ice sheet showed a net gain of 112 billion tons of ice a year from 1992 to 2001. That net gain slowed to 82 billion tons of ice per year between 2003 and 2008. https://www.nasa.gov/feature/goddard/nasa-study-mass-gains-of-antarctic-ice-sheet-greater-than-losses
On a separate personal note, having lived less than a 2 minute walk from the pacific ocean for the past 40 years, i have yet to see any rise in sea level. One of the docks near my home has pole marked to indicate the current tide height and it's been there for at least 30 years, and a zero foot tide is still indicated spot on all these years later.
I think a lot of the people on this site are unaware of their own motivations and almost religious adherence the government mandated narraitive. It's usually a good idea to actually listen to the people in charge of international climate policy and you'll realize it's all a lie. United Nations climate official Ottmar Edenhofer said the following just a couple years ago.
"One has to free oneself from the illusion that international climate policy is environmental policy. This has almost nothing to do with the environmental policy anymore, with problems such as deforestation or the ozone hole,"
And just a few years prior to that he said:
"the next world climate summit in Cancun is actually an economy summit during which the distribution of the world's resources will be negotiated."
And a bit more insight:
"This is the first time in the history of mankind that we are setting ourselves the task of intentionally, within a defined period of time, to change the economic development model that has been reigning for at least 150 years, since the Industrial Revolution,"
"This is probably the most difficult task we have ever given ourselves, which is to intentionally transform the economic development model for the first time in human history."
And my favorite is how they went on to say that in order to make this happen, they must plunge the world economy into a depression in order to force the end of capitolism.
- Antarctica is gaining ice
Eclectic at 11:09 AM on 19 June, 2022Philippe & MAR, thank you for the detailed info.
Shalom Wulich , your initial assertions are completely wrong. Demonstrably. Nevertheless, you are an intelligent guy and presumably are aware of your own motivations in questioning the climate science. It would be helpful to readers (and to yourself) if you would clarify your underlying thoughts in this whole area.
(For it seems unlikely that you simply awakened one morning and found yourself racked with doubts about the peculiar nature of Antarctic sea-ice extent. )
- Antarctica is gaining ice
MA Rodger at 03:57 AM on 19 June, 2022Shalom Wulich @518,
You ask "Where is the other trend?" given the passage you quote makes no mention of Antarctic SIE.
You are actually quoting the header of Section B.3 from the SPM of AR5 WG1 2013. The section you quote is repeated word-for-word within the AR5 Synthesis Report 2014 Secrtion 1.1.3 but the WG1 SPM you actually quote does head a series of eight bullet points, one of which is specifically describing Antarctic SIE and references Section 4.2 of the main AR5 WG1 report which in Chapter 4 Section 4.2.3 Antarctic Sea Ice provides coverage of your missing "other trend." If you would but look this is all fully referenced.
- Antarctica is gaining ice
Philippe Chantreau at 03:32 AM on 19 June, 2022You see what you want to see even it if it's not there and do not see what you don't want to see, even if it is there.
Your did not link AR5, so I went directly to the source.
From AR5 synthesis report, Topic 1: Observed changes and their causes, section 1.1.3, page 42 (58 in the pdf counter), Cryosphere: "There is high confidence that there are strong regional differences in the trend in Antarctic sea ice extent, with a very likely increase in total extent."
Further down, it reads " It is very likely that the annual mean Antarctic sea ice extent increased in the range of 1.2 to 1.8% per decade (range of 0.13 to 0.20 million km2 per decade) between 1979 and 2012."
Is that obvious enough? How else could it be written? How did you miss it?
Synthesis Report here.
Earlier you mentioned the Summary for Policymakers. So I went to that part and looked at what it said about the cryosphere. Unsurprisingly, it said almost verbatim the same words as in the synthesis report. Quote from AR5 Summary for Policymakers: " It is very likely that the annual mean Antarctic sea-ice extent increased in the range of 1.2 to 1.8% per decade between 1979 and 2012. However, there is high confidence that there are strong regional differences in Antarctica, with extent increasing in some regions and decreasing in others."
Those familiar with IPCC know that specific ranges of probability correspond to "likely" or "very likely." As usual, that can be found in the the report.
Not only AR5 mentions the increase of Antarctic sea ice in the body of the report and in the summary for policymakers, but it even quantifies the size of the increase and the level of confidence in the finding. It also lists scientific references. If that is your idea of sweeping under the rug, you can't be helped.
You asked the question "Where is the other trend?"
The answer is: in the synthesis report and in the summary for policymakers. Read them. For all your talk about what's in the reports, you seem surprisingly ignorant of their actual content.
The accusation that the IPCC was trying to hide the small increase in Antarctic sea ice that existed at the time of AR5 is baseless, as can be easily verified from examining the report you cited. This suggests that you did not read the material you used for your own argument.
This: "Ice is decreasing dramatically all over. Measured data is aligend with models, we go to do something, IPCC is totally right !" would certainly qualify as a strawman argument but it is so grotesque that a better name would be a straw clown.
In the actual IPCC material, what policymakers find is language like this: " In the Synthesis Report, the certainty in key assessment findings is communicated as in the Working Group Reports and Special Reports. It is based on the author teams’ evaluations of underlying scientific understanding and is expressed as a qualitative level of confidence (from very low to very high) and, when possible, probabilistically with a quantified likelihood (from exceptionally unlikely to virtually certain). Where appropriate, findings are also formulated as statements of fact without using uncertainty qualifiers."
You also do not seem to understand how models are made, validated and used, what ensemble means are and a number of other elements. I have never seen before the expression "approval model." From what you have produced so far, I doubt that there is much point getting into a discussion of these issues.
- Antarctica is gaining ice
Shalom Wulich at 22:11 PM on 18 June, 2022Hi Philippe,
So following the fact that measured data wasnt aligend with the CMIP5 model, now there is new explantation - Good for science!
CMIP6 - you are king !
Were Policy makers aware that in 2014 IPCC CMIP5 got it wrong and now there is a correction with new explanation ? Are they being told of all the corrections ? if so where in the SPM ?
Additionally , if the models then were wrong and now fine tuned, how can we be sure that now they are ok ? what new findings might finetune future models ?
So while we rely on these models to drive policy it might be that in the future, due to these model coming out wrong, we might find ourselves regreting actions we took based on wrong predictions ?
If we go back to 2014 AR5 and review the SPM this is what I make of it:
IPCC - the model predicting Antarctic sea ice got it wrong, lets not include it in the report. If we do include it, it might raise concerns on the validity of the other models we used. Why raise this doubt to begin with ?
Policy makers understanding- Ice is decreasing dramatically all over. Measured data is aligend with models, we go to do something, IPCC is totally right !
Attaching the 2 links showing the Arctic and Antarctic trends measured vs. model and the CMIP5.
The approval CMIP5 model got it wrong
The IPCC used models
and again qouting the key section from IPCC AR5 2014 report:
B.3 Cryosphere
"Over the last two decades, the Greenland and Antarctic ice sheets have been losing mass, glaciers have continued to shrink almost worldwide, and Arctic sea ice and Northern Hemisphere spring snow cover have continued to decrease in extent (high confidence) (see Figure SPM.3). (4.2-4.7)"
Where is the other trend ? The Antarctic sea ice ???? Ohhhh. That. It's not relevant now.
- Antarctica is gaining ice
Philippe Chantreau at 06:12 AM on 18 June, 2022Shalom,
You are launching accusations of nefarious intent. However, you are not producing anything even close to evidence that would support such accusations. In fact, the accusations thenselves are about actions that have not taken place and facts that are imaginary.
The treatment of polar regions in the 6th assessment is summarized here. It says: "For Antarctic sea ice, there is no significant trend in satellite-observed sea ice area from 1979 to 2020 in both
winter and summer, due to regionally opposing trends
and large internal variability." The trend is not significant because it is less than the uncertainty. Antarctic sea ice is not ignored or swept under the rug. As usual with IPCC reports, the full treatment of the polar regions is accessible online.
Not only does it not ignore Antarctic sea ice, it provides numerous references for it:
Turner et al., 2017
Kusahara et al., 2018
Meehl et al., 2019
Wang et al., 2019
Before asserting that a trend is being ignored, it would also make sense to ensure that there is really a trend to speak of. Turns out that there isn't: "Total Antarctic sea ice cover exhibits no significant trend over the period of satellite observations (Figure 3.3; 1979–2018) (high confidence) (Ludescher et al., 2018)."
Interestingly, this was compiled before the lowest extend on record, which was in 2022.
Last point, about models. Another quote from same AR6: "Coupled climate models indicate that anthropogenic warming at the surface is delayed by the Southern Ocean circulation, which transports heat downwards into the deep ocean (Armour et al., 2016). This overturning circulation (Cross-Chapter Box 7 in Chapter 3), along with differing cloud and lapse rate feedbacks (Goosse et al., 2018), may explain the weak response of Antarctic sea ice cover to increased atmospheric greenhouse gas concentrations compared to the Arctic (medium confidence). Because Antarctic sea ice extent has remained below climatological values since 2016, there is still potential for longer-term changes to emerge in the Antarctic (Meehl et al., 2019), similar to the Arctic."
- Antarctica is gaining ice
Eclectic at 05:06 AM on 18 June, 2022Sorry, Shalom Wulich , I apparently have cross-posted with you.
I hope my above post has answered both of your concerns.
You are therefore quite right in saying that the Antarctic sea-ice extent is not worth you bothering yourself about. The southern sea-ice extent trend, and the modelling of it, is only of real interest to the specialists who study that issue. Nothing for you to get excited about. Almost zero relevance to your own AGW concerns.
- Antarctica is gaining ice
Eclectic at 04:49 AM on 18 June, 2022Shalom Wulich @510 , it would be helpful if you would explain why you think the conditions at the two polar regions are comparable.
To me, the two cases seem so very different ~ so much so, as to make trend comparisons very difficult. How can even the sea-ice comparisons be relevant?
Arctic sea-ice is a thin film ~ 1 meter up to 5 meters thick, depending on temperature conditions. Antarctic sea-ice is similarly thin, but is "fed" by ice melting off the periphery of the permanent massive ice sheet that covers the Antarctic land. The extent of the antarctic sea-ice is influenced by air temperature and ocean temperature; and by the melting rate of the ice sheet periphery; and by the local surface oceanic salinity; and by the local strength of the katabatic winds coming down off the mass of Antarctica itself. Quite different to the Arctic situation.
(The Antarctic ice sheet is about 2,000 meters thick, and has a mass of approx 26 million gigatons . . . that is, 26 million cubic kilometers. So large, that most of it will persist for many thousands of years despite whatever multi-degree global warming we humans produce over the coming centuries. And the temperature conditions near the south pole's position will remain at the same frosty level, on top of such a huge block of ice ! )
West Antarctic (and peripheral East Antarctic) amount of melting will of course have a major effect on global sea level rise.
So if you are looking at Antarctic sea-ice extent only, then a comparison with the Arctic sea-ice extent has little relevance. No need to get excited about the trend comparisons you mention @510.
- Antarctica is gaining ice
Shalom Wulich at 04:44 AM on 18 June, 2022Hi Philippe,
If your replly was to me then:
1. What is significant is irelevant to my questions since I'm raising 2 concerns. Why a when a wrong model trend of Antarctic sea ice is not mentioned and why Arctic sea ice is ? Why arent the the full picture of trends is discussed.
2. Alternatively why was it so important to show a model forcasting dramatical reduction of Antarctic sea ice (also if it's irelevant, why bother) but once measured data arrives and it doesnt fit the model abandon this Antarctic sea ice and dont mention it in the SPM ?
- Antarctica is gaining ice
Philippe Chantreau at 01:26 AM on 18 June, 2022When this myth was addressed, there was a small upward trend of Antarctic sea ice, that was squeaking by the statistical significance criteria.
As of now, the Antarctic sea ice long term trend in the satellite record is difficult to distinguish since the margin of error is more than twice as large as the trend(!): 0.6% +- 1.6% per decade.
Incidentally, 2022 saw the lowest Antarctic sea ice extent in the satellite record.
https://nsidc.org/data/seaice_index
None of this really affects the basic argument in this myth rebuttal, which is that the loss of land based sea ice is a concern for sea level rise, whereas variations in sea ice are not.
The data does not allow to identify any significant long term change at this time, although what has been happening since 2014 certainly seems interesting.
- Antarctica is gaining ice
Shalom Wulich at 23:35 PM on 17 June, 20221. You mentioned that Antarctic sea ice is irrelevant. As if saying "Lets focus on the Antarctic land ice we are losing".
rn
2. I'm wondering why is this trend not relevant but other are. Why dismiss any trend that shows different behaviour than expected.
3. By saying expectedI see that the models for arctic sea ice fit well with measured trend while models for Antartic sea ice got it wrong. So can you comment on why the model for Antartic sea ice got it wrong and is the same model used also for Arctic ?
4. Comment 3 is also is clearly inline with Key section from IPCC Assesment Report "AR5", 2014 where it accuratly reports trends of sea ice in Arctic but dont mention the different trend in sea ice in Antartic. Why did IPCC include the Arctic sea ice (i.e. it's relevant) but omitted the Antartic sea ice (i.e. you seem to claim it's irelevant). Do you thing it's because it interfers with the main message which implys that "ice is melting dramatically"
rn
rn
Thanks,
rn
Shalom
- Antarctica is gaining ice
Shalom Wulich at 23:35 PM on 17 June, 20221. You mentioned that Antarctic sea ice is irrelevant. As if saying "Lets focus on the Antarctic land ice we are losing".
2. I'm wondering why is this trend not relevant but other are. Why dismiss any trend that shows different behaviour than expected.
3. By saying expectedI see that the models for arctic sea ice fit well with measured trend while models for Antartic sea ice got it wrong. So can you comment on why the model for Antartic sea ice got it wrong and is the same model used also for Arctic ?
4. Comment 3 is also is clearly inline with Key section from IPCC Assesment Report "AR5", 2014 where it accuratly reports trends of sea ice in Arctic but dont mention the different trend in sea ice in Antartic. Why did IPCC include the Arctic sea ice (i.e. it's relevant) but omitted the Antartic sea ice (i.e. you seem to claim it's irelevant). Do you thing it's because it interfers with the main message which implys that "ice is melting dramatically"
Thanks,
Shalom
- Why and How to Electrify Everything
michael sweet at 11:40 AM on 7 May, 2022John S.:
When I Goggled "how cold can heat pumps work" I found this quote
"In fact, heat pumps are now the best heating option just about everywhere on the planet. Below 0° Fahrenheit, heat pumps can still heat your home with more than twice the efficiency of gas heating or standard electric heating (such as electric furnaces and baseboard heaters). They’ve been tested and approved as far north as the Arctic Circle, and are popular options in very cold countries like Finland and Norway." my emphasis. source
Please provide a reference to support your wild claim that heat pumps are not efficient in cold weather. My source says they are still efficient but not as efficient as during normal weather. Where I live heat pumps have an "emergency heat" switch for even colder weather. I use it about 2 days every other year. (My heat pump is in Florida and is designed to cool better than heat). As heat pumps continue to be developed we can expect efficiencies to improve across the board.
Most plans I have seen try to use as much district heating as possible because large installations can utilize energy more efficiently. Heat pumps are recommended for people who are not able to obtain district heating.
- SkS Analogy 1 - Speed Kills: How fast can we slow down?
Evan at 21:42 PM on 20 February, 2022Santalives you ask "... is there a problem here?"
Coming out of the last ice-age cycle temperature rose 5C, causing a sea-level rise of 400'. Temperatures have already risen 1.2C and there is enough carbon in the atmosphere, already, to take us to 1.7C. There is over 200' of sea-level rise locked up in the world's ice.
We know that ice melts when it gets warmer and scientists are witnessind destabilization of the big ice sheets in Antarctica and Greenland.
More carbon -> higher temperatures -> more ice melting -> higher sea-level rise -> problem
This is just one of many problems.
- How 2022 could be a national and global pivot point for carbon emissions
nigelj at 06:29 AM on 16 February, 2022Knaugle
Yes agreed, and there is another angle on all this. Firstly there is indeed some evidence that the rate of use of coal is declining and reserves are more limited than previously thought and this might suggest that 5 degrees is no longer plausible. Refer:
www.nature.com/articles/d41586-020-00177-3
However, there are also signs that ice sheet stability is under serious threat even at about 1.5 degrees of warming (there is plenty or recent commentary on western antarctic ice sheet easily googled) and plenty of recent attribution studies on extreme weather showing huge issues. This might suggest that sea level rise and how weather extremes are changing is more sensitive to warming than previously thought. So even if 5 degrees is now very unlikely, it might not make things better and could create a false sense of security.
And it is worth looking at Pielkes background: "Roger Pielke Jr has degrees in poltical science and maths. "While Pielke Jr. argues that he is not a climate change skeptic, and accepts that man-made climate change is a real problem, he has consistently opposed the idea that extreme weather events and climate change are connected. [5Grist writer David Roberts wrote that Pielke Jr. has “been playing footsie with denialists and right-wing ideologues for years; they’re his biggest fans,” and critics have noted that Pielke Jr.’s work has often been cited by climate change deniers. [2], [3]"
- How weather forecasts can spark a new kind of extreme-event attribution
wilddouglascounty at 01:26 AM on 15 January, 2022#18 Eclectic,
Thank you again for your continued discussion, which on the whole has been much more extensive on this thread than I ever expected. I agree that "global warming" and "climate change" have become extremely recognizable in the media and the public around the world, and wanting to replace it with a mouthful of words with nearly the same meaning has questionable merit, so I understand why you are wondering why I want to shift it to what seems to be a subtle point which might be lost on most people. And you may be right.
But there are a couple of points I want to bring up for consideration. The first point is that do you remember when the phrase "global warming" was first popularized, the denialists got a lot of coverage whenever a greenhouse gas turbocharged polar vortex came barreling down from the arctic? Or when the north Atlantic cooling and salt dilution from all the ice melt from Greenland became a thing, potentially causing colder weather for northern Europe, as another example? The climatological community quickly realized that "global warming" did not adequately capture the complexity of changes that were occurring as a result of the changing atmospheric chemistry that were being observed. So "climate change" became the new replacement mantra, at least in the US community. This is an example of how popular terms are changeable, and made more accurate, thereby short circuiting misinformation in the process.
The second point to consider is how the use of steroids has played out in the sporting world. I've used baseball as an example, but steroid use clearly has had its impact across all sports as is evidenced in the Olympics Committee rules development and the increasingly complex monitoring of athletes across all sports. If the conversation in the sporting community just focused on homerun inflation, or increasing serving speeds in tennis, or other sports specific measures, then it would perhaps be harder to connect the dots to reveal the larger cause: steroid use. As we know, climate science has had to look at the much larger net of causality and relationships that impact and are impacted by the increase in the atmospheric greenhouse gas component. The ocean has increased CO2 absorption rates, resulting in acidification. The oceans themselves, not just the atmosphere, is warming, which contributes to sea level rise. The bottom line is that there are several monitoring indexes that are important to watch to understand the impact of greenhouse gas composition in the atmosphere. So just as the sporting community has focused on steroid use as the source of the myriad changes occurring in the sporting community, it makes sense to me to focusing on the source of ocean acidification, sea level rise relating to ocean water temperature, etc. AND climate change: greenhouse gases. It leaves the conversation about whether humanity is causing the problem behind us so we can move ahead with the next steps.
Thanks again for persisting, and I hope that this clarifies why I think it is worth considering this.
- It's the sun
cph at 22:01 PM on 9 November, 2021HK@1292 - "BTW, if clouds and snow/ice changed by themselves and not as a feedback to warming caused by GHGs, we wouldn't get a cooling stratosphere..."
--- I did not understand your last sentence. I am of the opinion that, for example, a changed cloud albedo cannot be explained by a rise in temperature alone. Changes and anomalies in global mean cloud cover can also be caused by fewer (sulfate) aerosols or expanding deserts (dry regions become drier).
https://www.carbonbrief.org/satellite-data-reveals-impact-of-warming-on-global-water-cycle

Evaporation increases by + 2.3 mm / year, which is not fully compensated for by increased precipitation of + 1 mm / year. A decreasing runoff through the rivers of -1.01 mm / year and a falling groundwater level of -0.75 mm / year quantify the drainage of the continents. This drainage (through drained bogs, wetlands, groundwater, aquifers, canalization of rivers and a constantly growing sealing of urban areas) is just as man-made as the CO² emissions, rising temperatures and the resulting higher evaporation. Too little H²O in desert regions and the earth's atmosphere, which in summer extend through droughts up to the Arctic Circle, are a temperature driver. Too much CO² is just as warming as too little H²O. Less evapotranspiration -> less cloud albedo -> higher incoming radiation energy and record temperatures on the earth's surface -> even faster drying out with even higher temperatures - imho, similar to the ice-snow albedo, form a vicious circle.
The authors estimate a "statistically significant" increase in evapotranspiration of around 10% above the long-term mean (corresponds to a temperature increase over land areas of ~ + 1.44 ° C). During the same period, precipitation only increased by 3% and global river runoff decreased by 6%.
---
What is noticeable here is a simultaneous decrease in relative humidity and cloudiness, which certainly correlates with a general increase in the number of hours of sunshine.

")
- Climate's changed before
Daniel Bailey at 01:05 AM on 14 July, 2021IIRC, the Last Glacial Maximum saw a greater buildup of land-based ice than in previous glacial phases. By the time maximum warming in the Holocene had been achieved and a natural cooling initiated, a great deal of ice remained in Greenland and Antarctica that had already been lost by that same point in previous interglacials.
Given time to reach equilibrium with the modern forcing, global sea levels will eventually surpass any levels achieved in previous interglacials spanning the previous 800,000 years+, and likely far longer than that.
From Dutton 2015, Figure 5:
- Deciphering the rise and fall of Antarctic sea ice extent
Daniel Bailey at 04:10 AM on 8 July, 2021Global sea ice, showing both Arctic and Antarctic sea ice extent changes over time in the satellite observational record:

Arctic sea ice extent continues its multidecadal decline and Antarctic sea ice extent is currently at normal, average values.
Source: NSIDC
- Deciphering the rise and fall of Antarctic sea ice extent
MA Rodger at 23:07 PM on 7 July, 2021gerontocrat @1/2,
For clarity, I have snatched your 'graphic of JAXA's VISHOP Antarctic SIE 1980-to-date' from Neven's Forum and installed it below.
- Deciphering the rise and fall of Antarctic sea ice extent
gerontocrat at 21:16 PM on 7 July, 2021Whoops - address is
https://forum.arctic-sea-ice.net/index.php/topic,1759.msg314913.html#msg314913
- Deciphering the rise and fall of Antarctic sea ice extent
gerontocrat at 21:15 PM on 7 July, 2021As of now, 365 day trailing average of sea ice extent is now above the (meaningless) linear trend by 60k km2. You can see the image here...
- Antarctica is gaining ice
John Hartz at 02:01 AM on 5 July, 2021Suggested supplemental reading:
Deciphering the rise and fall of Antarctic sea ice extent, Guest Post by Clare Eayrs & David Holland, Carbon Brief, June 29, 2021
- Skeptical Science New Research for Week #25, 2021
Daniel Bailey at 06:51 AM on 26 June, 2021Reading the research paper and the Nature commentary on it, they are pretty much in-line with the recent 2019 SROCC (Chapter 4 is most relevant). Table 4.4 gives these numbers:

Don't take my word on it, though. There's a number of discussions out there already (like here and here) saying pretty much the same thing.
For me, the main thing is that they look at the recent research, both the early research by DeConto and the later stuff, which shows that some of the early concerns about marine ice cliff instability were not as bad as originally feared.
“What we found is that over long timescales, ice behaves like a viscous fluid, sort of like a pancake spreading out in a frying pan. So the ice spreads out and thins faster than it can fail and this can stabilize collapse. But if the ice can’t thin fast enough, that’s when you have the possibility of rapid glacier collapse.
There’s no doubt that sea levels are rising, and that it’s going to continue in the coming decades. But I think this study offers hope that we’re not approaching a complete collapse – that there are measures that can mitigate and stabilize things. And we still can change things by making decisions about things like energy emissions, methane and CO2.”
Does this mean that the land-based ice sheets of Antarctica and Greenland may not hold some SLR surprises in store for us? Of course they might. But without a magic crystal ball or a time machine to know with certainty what emissions pathways society will follow in the future, we have to go with what they physics of ice sheets informs us. This research does not rule out worse results this century than the SROCC delineates.
As scientists Joelle Gergis and Richard Alley told a group of us at a recent AGU meeting, the current models (CMIP3 and CMIP5) treat the land-based ice sheets of Greenland and Antarctica as "like rocks, but painted white". Meaning that they were not coupled or interactive with their surroundings in any climate-related way. The CMIP6 models, however, look to more fully couple those ice sheets with their surrounding ocean regimes.
Society will have an enormous difficulty in dealing with the first meter of SLR, due at some point this century. If it gets a second meter this century (perhaps not globally, but possibly in some regions), that will be catastrophic.

- The New Climate War by Michael E. Mann - our reviews
Bob Loblaw at 11:47 AM on 22 June, 2021"...getting it, whatever it is" does not seem like a particularly ringing endorsement of whatever Nick is promoting.
I'm more in agreement with MAR: NIck's writing "does not make for pretty reading".
Nick has again started off with a diatribe about how "none of us are fully getting what I am saying", but he's not going to tell us why our responses are "flawed" and accuses MAR of writing something that "is a mirror inage [sic]of the sort of toxic denialist misrepresentation of someone's position".
Maybe your arguments are not well expressed, and not that convincing, Nick?
I get that you dislike Greenpeace. I get that you don't like Oreske's work. I get that you have personal anecdotes that convince you that the oil industry really hasn't been behaving all that badly.
I have personal anecdotes, too. I studied the physics of freezing soils and construction of arctic pipelines from some of the expert witnesses involved in the Berger Inquiry, and then worked in the oil patch and research comunity for three years before going back to grad school. I saw personally how the industry struggled to figure out how to deal with thaw settlement of warm pipelines in permafrost, and frost heave of refrigerated pipelines in unfrozen soils. Building pipelines in the arctic was not like building them in Texas.
...and I saw the public position the companies took, blaming delays on "environmentalists", all while working internally to understand engineering problems they had no solutions to. I saw this 40 years ago.
So, Nick, your argument that you are presenting some new idea that goes against common viewpoints seems odd to me - I've seen the "the environmentalists made us do it" charade a long time ago, and it is a dog that will not hunt - unless you can come up with something more than personal anecdotes. So, when you say "...I realise I've got an uphill struggle with you lot because you are unlikely to have heard anyone arguing this position before...", you are definitely wrong.
As for your arguments presented here, and your accusations of "denialist misrepresentation", etc., have you really looked at how you have characterized the people you are arguing with here, and the positions (either comments here, or from the larger debate) you are arguing against?
- "..the appearance of some of the more extreme campaigning activists by, in my view, misattributing dark motivations to and unfairly demonising the actions..."
- "Greenpeace's highly misleading report"
- "This is a seriously warped thing to assert."
- "When activists try to bad mouth Exxon et al they speak from a 'post facto' appreciation of the science,"
- "it was the far left who more or less started denialism off "
- "I believe it was the environmental organisations excessive and unwarranted views..."
- "... Big Oil continued to support the "B.S. factories" because they were effective at trying to protect those corporations against unwarranted attack. "
- "...chock full of cherry picking and insinuation ..."
- "...most seem to have been happy to accept Greenpeace et al's interpretation of events as gospel ..."
- "...an alternative explanation to the insinuative narrative that just about everyone seems to have accepted. I think that narrative is fundamentally flawed and was constructed by people with a strong ideological bias as a way to socially engineer the public ..."
- "Perhaps it might help if you and the other two knew three things which might help you..."
- "Just watch the 'usual suspects' jump on the word 'unabated' ..."
- "You sound like a denialist! "
- "You lot are STILL not understanding my main point and are jumping to fundamentally fallacious conclusions about my position."
- "I think you lot are trying to hard to prop up a very long standing meme, originated by Greenpeace and subsequently promoted by, IMHO, political forces not related to pure climate science"
- "it's been interesting to see the, in my view somewhat biased, kick-back from long term Skepsci followers. I think what I might do in due course is approach John Cook to see if we can arrange a Zoom meeting. He and Stephan Lewandowsky are right at the forefront of the 'psychological' approach to deconstructing denialist attitudes and methods. Maybe they'll be more welcoming of a new hypothesis than others..."
- "However, I assure you that..."
- BTW, as some of you are using exactly the same insinuative style as hardline denialists do,
Do you realize how your choice of words makes you appear?
I know nothing about you other than what you post here (and possibly a bit more posted elsewhere - I don't recognize the name)). I also know for sure that you don't know anything about me, other than what I post here or on other climate-related blogs you might have seen me comment on. (You can read about me on the SkS Team page to know how I know this.)
What's the point? Your self-agrandizement is pretty tiresome, and you really are not doing yourself any favours with your claims of knowing everything better than everyone else. You are not adderssing other people's criticisms - you are just dismissing them based on your fixed ideas about their motivation and (usually incorrect) assumptions about their sources of information.
By the way, in this thread my count says you've mentioned Greenpeace about 25 times. Did I mention that we already know you don't like Greenpeace?
You have said "I'll try and restate things later, if I get time,"
Please don't unless you actually have something new to say.
- DMI show cooling Arctic
Jim Hunt at 16:35 PM on 10 June, 2021Hi WEP,
The "freezing point" of salty sea water is below 0C. As luck would have it DMI "Arctic" temperature has just surpassed that temperature for the first time in 2021, and earlier than the climatology:
https://GreatWhiteCon.info/2021/06/facts-about-the-arctic-in-june-2021/#Jun-09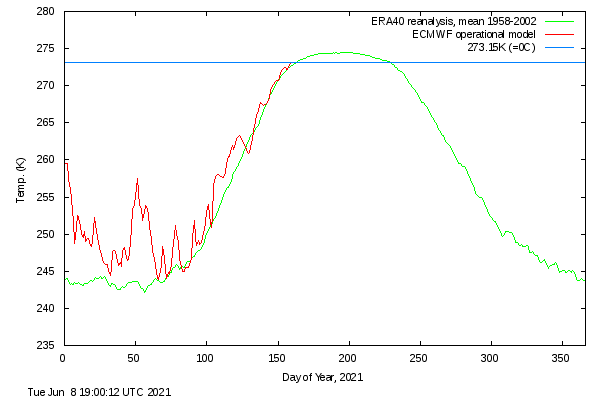
Note that the blue line at 0C is therefore actually above the "melting point" of ice floating in said salty Arctic sea water. Note also that air temperature above the ice won't rise very far above that line for the rest of the brief Arctic summer. - The New Climate War by Michael E. Mann - our reviews
Micawber at 03:04 AM on 8 June, 2021Michael Mann is correct in thinking that our information is totally controlled by media giants.
Scientists are charged to read their own publications and “peer reviewers” stack the peers so that no new ideas can get through. Rarely if ever do you find references to key earlier work by retired or deceased scientists. I give a few examples.
Microsoft Office still uses years beginning 1 January 1900. They charge for updates but still have a fatally flawed program. Why is he allowed to pose as a scientist and innovator?
Even David Keeling was nearly prevented from continuing verification of CO2 infrared heat blankets by rigged peer review. He gives a vivid account in his autobiographical review:
Keeling, C. D., 1998, Rewards and Penalties of Monitoring the Earth, Ann Rev. Energy Env, 23(1), 25-82, doi:10.1038/nature105981.
Blair Kinsman had earlier shown how the misuse of statistics and inability to take daily validation data could mislead to wrong conclusion. Unlike in lab experiments geophysical data once not taken cannot be repeated at will. This has happened with our gross neglect of near surface ocean data where is located most anthropogenic heat.
Kinsman, B. 1957, Proper and improper use of statistics in geophysics, Tellus 9(3), 408-418, doi:10.1111/j.2153-3490.1957.tb01897.x
Free access sci-hub.do/10.1111/j.2153-3490.1957.tb01897.x
"The dangers facing the earth's ecosystems are well known and the subject of great concern at all levels. Climate change is high on the list. But there is an underlying and associated cause. Overpopulation."
Sir David Attenborough https://www.youtube.com/watch?v=JRPmLWYbUqA
"Can you think of any problem in any area of human endeavor on any scale, from microscopic to global, whose long-term solution is in any demonstrable way aided, assisted, or advanced by further increases in population, locally, nationally, or globally?"
"The Greatest Shortcoming of the Human Race is our Inability to Understand the Exponential Function" Bartlett, Albert A., 1979
www.youtube.com › watch › v=F8ZJCtL6bPs
Wherever humans are involved we HAVE the Weimar greed equation. Better snap up fish stocks, or oil or whatever before someone else grabs it.
Graham Hancock has beeN ridiculed for suggesting there was a great civilisation as early as 400,000 years ago. Yet there are pyramids dated 130,000 years old in the Mississippi basin. Genetics link Oceania to S America. The compact nature of the Antikythera Clock suggest it was used for navigation. Why else would one cram a complete astronomical clock into a case the size of a sextant? The clock could predict lunar eclipses 78 years ahead as well as their colour. Many wheels have prime number of gears to give highly accurate astronomical times. There were even wheels for the Olympic and other games. Silicon valley may think of it as a mechanism or computer. But it was a clock long before Harrison’s. Such sophistication suggests many years development. It clearly could not have sprung up 350BC, any more than modern printed circuits could have been envisioned in 1957.
Sealevels averaged 50m below present in prehistory before 1750AD. There were many rich landmasses where merchant sailors could establish empires. They were wiped out by catastrophic sea level rise both cyclical and from asteroid impacts. We are at the top of earth’s remaining peaks.
https://www.youtube.com/watch?v=bAqqA3fMwI8
Melting ice of Greenland and Antarctica is proceedING exponentially leading to rapidly rising sealevels, floods and storms as well depleted fish stocks.
Waters around Faeroes does not get cold enough for cod and halibut to breed. They need to be at least 10 years old before they start. (netflix seaspiracy)
The north sea herring disappeared before 1950s, the Newfoundland cod in the 1980s. Gunboat diplomacy could not save them.
What do you think we should do? Perhaps include the equatorial undercurrent in climate models?
There has been too much about hot air instead of hot water.
I have not heard Dr Mann mention this. There are none so blind as those who will not see.
There needs to be a real focus on what the great oceans are telling us. - Arctic sea ice loss is matched by Antarctic sea ice gain
Daniel Bailey at 05:40 AM on 4 June, 2021@Joe Levesque, per NOAA's Arctic Report Card 2017, current Arctic temperature anomalies and low values of Arctic sea ice extent are unprecedented over the past 1,500 years.

Expanding upon that, it's far warmer now in Greenland than it was at any point during the Viking habitation of it. The few Vikings that survived left rather than die there (and the Inuit thrived there the entire time and still do so today).

As a matter of additional fact, it's far warmer now in Greenland than it has been in the past 10,000 years.

Back to you.
- Arctic sea ice loss is matched by Antarctic sea ice gain
Joe Levesque at 14:22 PM on 3 June, 2021The historical Arctic sea ice reconstruction appears anomalous with the Viking settlements in Greenland In the 10th century. Where they settled then is not habitable today due to ice levels. Anybody up to explain how this can be explained?
- Dr. Ben Santer: Climate Denialism Has No Place at Lawrence Livermore National Laboratory
Jim Hunt at 00:55 AM on 1 June, 2021Al @25 - Did you by any chance read my response to Prof. Koonin over at Medium? Or his response to my comment? If not here is a precis for you:
https://GreatWhiteCon.info/2021/05/unsettling-defence-of-the-undefensible/
Steven then rather ungraciously chose to ignore my follow up question:
Regarding “the topic somewhat distant from ordinary folks’ perception”, that is largely my point. Is Arctic sea ice decline really any more distant to the average (wo)man in the street than sea level rise?
- Dr. Ben Santer: Climate Denialism Has No Place at Lawrence Livermore National Laboratory
Jim Hunt at 00:39 AM on 27 May, 2021Al @4 et al.
I am of course biased, but I like to think that Prof. Koonin "gets a bit of a kicking" here too:
https://GreatWhiteCon.info/tag/steve-koonin/
Here's an extract from episode 6 of my ongoing review of "Unsettled":
Steven then rather ungraciously chose to ignore my follow up question:
"Regarding 'the topic somewhat distant from ordinary folks’ perception', that is largely my point. Is Arctic sea ice decline really any more distant to the average (wo)man in the street than sea level rise?"
Etc. etc. For 8 days and counting…
Since Steve is evidently unable and/or unwilling to respond to my enquiry perhaps somebody else might be willing to do so?
Meanwhile here’s news of a brand new paper documenting the evidently inexorable decline of the sea ice cover across the Arctic Ocean:
https://GreatWhiteCon.info/2021/05/month-in-review-arctic-science-edition/#Ricker
- 2021 SkS Weekly Climate Change & Global Warming News Roundup #19
Jim Hunt at 21:02 PM on 12 May, 2021Hopefully the guys'n'gals here at SkS will find this as amusing as my Arctic alter ego did?
https://twitter.com/GreatWhiteCon/status/1392406380016021504
Tucker Carlson interviewed Steve Koonin for Fox News. Fox displayed lots of stock footage of melting sea ice in the background. Needless to say neither Tucker nor Steve broached the subject of the 800 pound canary in the Arctic coal mine.
- 2021 SkS Weekly Climate Change & Global Warming News Roundup #19
MA Rodger at 01:43 AM on 12 May, 2021Jim Hunt @12,
I think you missed a trick in your interchange with Judy @ClimateEtc on the subject of Koonin & Arctic Sea Ice. Judy chips in "If you think that the consensus is that this decline is 100% caused by AGW, then you disagree with the IPCC SROCC report (which estimates ~50%). Very weak base for criticizing Koonin."
But come on, Judy is just flying arround on Occam's broom.
So I think the reply should be "Judy, have you read IPCC SROCC 3.2.1.1.1 and the references it bases that "est ~50%" on? I ask because if you had, I think you would be less quick with your "very weak base" comment."
IPCC SROCC 3.2.1.1.1 says "Approximately half of the observed Arctic summer sea ice loss is driven by increased concentrations of atmospheric greenhouse gases, with the remainder attributed to internal climate variability (Kay et al., 2011; Notz and Marotzke, 2012) (medium confidence). ... A lack of complete process understanding limits a more definitive differentiation between anthropogenic versus internal drivers of summer Arctic sea ice loss (Serreze et al., 2016; Ding et al., 2017; Meehl et al., 2018)."
So at first cut, the ~50% value appears to be based on some rather old references. Of these references, Kay et al (2011) which provides a 40%-50% value says "The conclusions we draw are only as reliable as the underlying climate model processes," which isn't the sort of finding you would lay great store by. Their conclusion is "Thus, consistent with early studies, this [study] should be seen as another reminder of the need to account for internal variability in the assessment of recent sea ice loss and the fidelity of global climate model simulations." It is thus not a reliable quantification of the contribution of internal variability.
And Notz and Marotzke (2012) basically says that internal variability is not the cause of the post-1979 trend in SIE decline. "1. Internal variability as estimated from pre-satellite observations cannot explain the recent retreat of Arctic sea ice. 2. The observational record shows no signs of self-acceleration and hence no signs of a possible ‘tipping’. 3. The satellite record is well described by a linear trend onto which internal variability is superimposed. The magnitude of this superimposed internal variability is very similar to that of the pre-satellite record. 4. The most likely explanation for the linear trend during the satellite era from 1979 onwards is the almost linear increase in CO2 concentration during that period."
Of the later references, Serreze et al (2015) says nothing on the subject,
Ding et al (2017) is saying the internal variability is being driven by sea ice loss in a two-way street [so this is AGW creating internal variability] and comes up wiht a 30%-50% value, while Meehl et al (2018) suggest the extra oomph in Arctic SIE decline 2000 is due to forced tropical SST.
So I see nowhere any reason to dismiss half the 1079-2020 SIE loss as being due to one of Judy's wobbly trends.
More than 100 comments found. Only the most recent 100 have been displayed.
More than 100 comments found. Only the most recent 100 have been displayed.


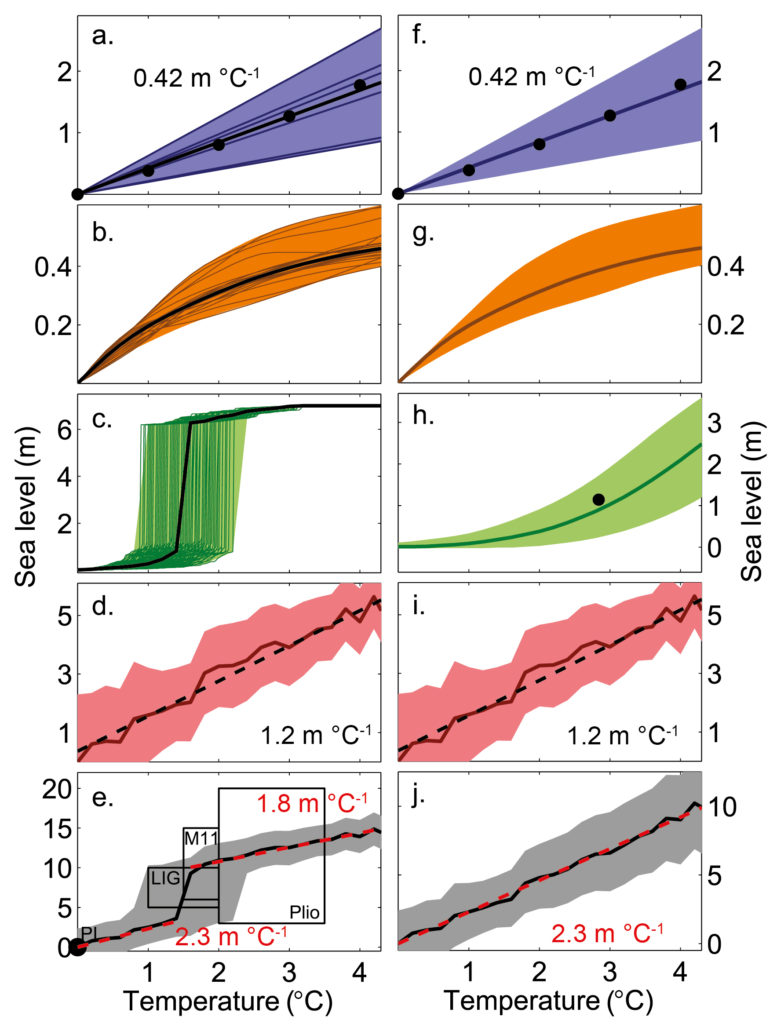
THE ESCALATOR

(free to republish)