


 Arguments
Software
Resources
Comments
The Consensus Project
Translations
About
Support
Arguments
Software
Resources
Comments
The Consensus Project
Translations
About
Support
![]()
![]()
![]()
![]()
![]()
![]()
![]()
![]()
![]()
![]()


![]()


Latest Posts
- Skeptical Science New Research for Week #19 2024
- Climate Adam: How to visualise Climate Change (ft. Katharine Hayhoe)
- At a glance - Tree ring proxies and the divergence problem
- Why India is key to heading off climate catastrophe
- 2024 SkS Weekly Climate Change & Global Warming News Roundup #18
- Skeptical Science New Research for Week #18 2024
- At a glance - Clearing up misconceptions regarding 'hide the decline'
- Pinning down climate change's role in extreme weather
- 2024 SkS Weekly Climate Change & Global Warming News Roundup #17
- Fact Brief - Is Antarctica gaining land ice?
- Simon Clark: The climate lies you'll hear this year
- Skeptical Science New Research for Week #17 2024
- Water is at the heart of farmers’ struggle to survive in Benin
- At a glance - The difference between weather and climate
- India makes a big bet on electric buses
- 2024 SkS Weekly Climate Change & Global Warming News Roundup #16
- EGU2024 - An intense week of joining sessions virtually
- Skeptical Science New Research for Week #16 2024
- How extreme was the Earth's temperature in 2023
- At a glance - Is the science settled?
- What is Mexico doing about climate change?
- 2024 SkS Weekly Climate Change & Global Warming News Roundup #15
- Fact Brief - Did global warming stop in 1998?
- Skeptical Science New Research for Week #15 2024
- EGU2024 - Picking and chosing sessions to attend virtually
- At a glance - The Pacific Decadal Oscillation (PDO) is not causing global warming
- Climate Adam: Is Global Warming Speeding Up?
- 2024 SkS Weekly Climate Change & Global Warming News Roundup #14
- Gigafact and Skeptical Science collaborate to create fact briefs
- Skeptical Science New Research for Week #14 2024
Comment Search Results
Search for anthropogenic co2
Comments matching the search anthropogenic co2:
- CO2 is just a trace gas
JJones1960 at 17:58 PM on 3 May, 2024Bob Loblaw @ 51:
“CO2 is not "colourless" when it comes to infrared radiation. Just because JJones1960 can't see it doesn't mean it doesn't happen.”
The point that you miss that that CO2 is a trace gas, therefore cannot trap a significant amount of heat anyway.
OPOF @52:
Your quote:
“Tropospheric ozone (O3) is the third most important anthropogenic greenhouse gas after carbon dioxide (CO2) and methane (CH4).“
The point you miss is that ozone traps heat in relation to CO2 and methane as the ‘third most important greenhouse gas’ but that is IN RELATION to those gases. My point is that those gasses don’t and can’t trap a significant amount of heat because they are in trace amounts, therefore neither would ozone.
- Climate - the Movie: a hot mess of (c)old myths!
nigelj at 04:48 AM on 1 April, 2024Two Dog @41
"Finally, on the "cherry picking" of the 50s, 60s and 70s. I think its a fair point to pick 30 years out of 150 in this case. Indeed, the argument above is, as I understand it, that the main and dominant factor in the current warming is human GHG emissions. For that theory to hold, in any period where GHG emissions are increasing year on year, then only a few years "blip" in warming must presumably call the theory into question? (unless we can find another new and temporary factor like air pollution)"
The reason the temperature record has "blips" and is not a smooth line is because the trend is shaped by a combination of natural and human factors that have different effects. However the overall trend since the 1970s is warming. The known natural cycles and infuences can explain the short term blips of a couple of years or so, (eg el ninos) but not the 50 year overall warming trend since the 1970s. Sure there may be some undiscovered natural cycle that expalins the warming, but its very unlikely with chances of something like one in a million. And it would require falsifying the greenhouse effect which nobody has been able to do. Want to gamble the planets future on all that?
The flat period of temperatures around 1940- 1977, (or as OPOF points out it was really a period of reduced warming) coincides with the cooling effect of industrial aerosols during the period as CB points out. This is the period when acid rain emerged as a problem until these aerosols were filtered out in the 1980s.
However the flat period mid last century also coincided with a cool phase of the PDO cycle (an ocean cycle), a preponderance of weak el ninos, and flat solar activity after 1950 and a higher than normal level of volcanic activity. Literally all the natural factors were in a flat or cooling phase. In addition atmospheric concentrations of CO2 were not as high as presently, so it was easier for the other factors to suppress anthropogenic warming.
So for me this is all an adequate explanation of why temperatures were subdued in the middle of last century. Just my two cents worth. Not a scientist but I've followed the issues for years.
- Climate - the Movie: a hot mess of (c)old myths!
Bob Loblaw at 00:07 AM on 1 April, 2024Two Dog: You say ' but I am less convinced about the arguments that "all other causes for the current warming have been looked at and ruled out".'
First of all, I will point out that nobody here, and nobody in climate science (that I am aware of), has ever claimed that "all other causes ... have been looked at". In fact, I'd be willing to wager that there is not a single scientific subject where any scientist would claim that "all other causes ... have been looked at".
By putting that phrase in quotes (in your statement in #41), you are making it look as if someone has actually made that claim. If you have a source for such a quote, please provide it. Otherwise, you are creating a strawman argument, and setting impossible expectations ("all other causes").
In the rest of comment 41, you are basically making an argument from incredulity. You use strawman terms such as "all of those factors", and emotive impossible expectations such as "then accurately measure their hypothetical potential impact". You throw in rhetorical questions such as ' how do we "know" what would have happened to our climate absent human GHG increases?'
The answer to the last question is, climate scientists do the science. The second figure in my comment 34 shows the results of some of that science: running models that look exactly at the question you raise - how does the model behave with and without the anthropogenic forcing. They look at hypothetical natural and anthropogenic causes, quantify them as best they can, and perform calculations to determine the relative importance of each factor.
As Eclectic pointed out in comment 31, saying there might be some "undiscovered mysterious physical cause responsible for the recent rapid global warming" [Eclectic's words] is nothing but handwaving. Unless you can propose a plausible mechanism that would cause the warming (and another one to offset the warming from GHG, as Eclectic points out in #31), then you're just blowing smoke.
People often try to use the same bogus arguments in denying that fossil fuel combustion is causing the rise in atmospheric CO2. They postulate some mysterious, unknown source of CO2 that remains undiscovered - and avoid the question of what mysterious, undiscovered process is managing to remove all the CO2 from fossil fuels (but can't remove this mysterious, unknown source of CO2 that is making atmospheric CO2 rise).
You may as well be saying "it could be fairies".
...and before you try to counter the graphical evidence in the figure I posted in comment 34 using the "but modelz" argument, I will point out that everything in science uses models. Descriptive, mathematical, statistical, computer simulations - all are different forms of models. If you don't accept models as valid science, then you are rejecting science writ large. (The original post points out that reliabilty of models is one of the myths that was raised in the movie, and proves a link to the SkS page that covers this myth.)
- Climate - the Movie: a hot mess of (c)old myths!
Bob Loblaw at 05:50 AM on 29 March, 2024Two Dog @ 32:
You seem to be under the impression that nobody has tried to explain the observed temperatures using anything other than CO2. This is patently false.
This SkS rebuttal looks at conclusions drawn by the IPCC in 2007, looking at a variety of possible explanations. The first figure from that post shows contributions to radiative forcing from several sources:
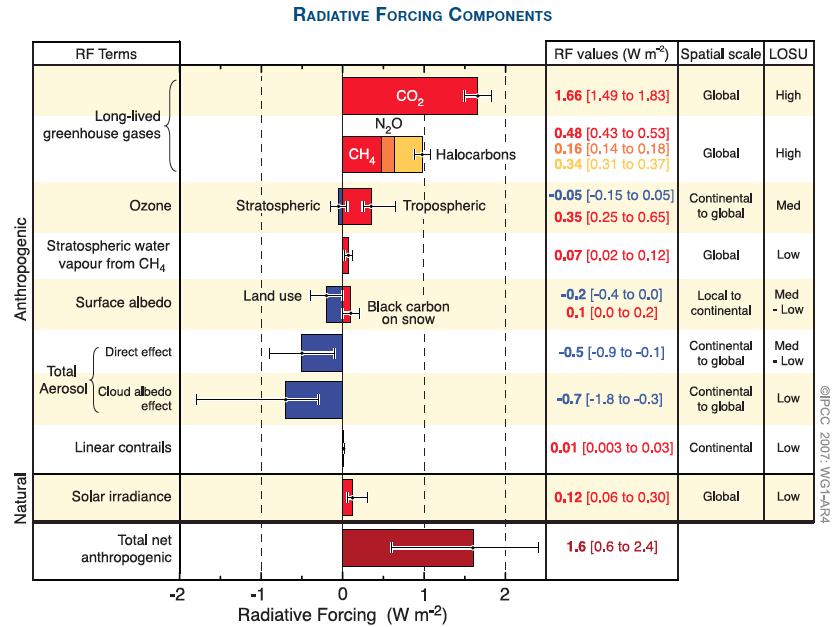
...and the second figure on that post shows modelling of temperatures over the last century with and without anthropogenic forcing:
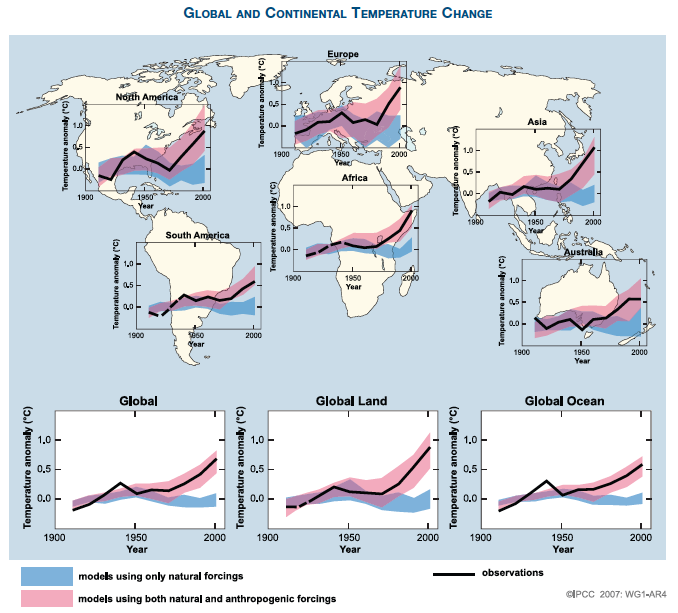
So when you try to answer Eclectic's question, you'll need to come up with something that is not on that list.
If climate scientists have been "shutting down the debate", it's because they have looked at the proposed alternatives and found that the evidence is against them.
- Climate - the Movie: a hot mess of (c)old myths!
Two Dog at 00:33 AM on 28 March, 2024I am relatively new to criticisms of the man-made global warming narrrative but it seems to me that some of the points made in this film have merit.
First, the use of emotive language in a critique like "climate change denial" (what does that even mean?) is problematic. The climate has never been in perfect equilibrium, so presumably nobody denies it changes - best to stick to the arguments. Second, we seem to focus on the wrong question. I think very few anthropogenic climate change skeptics would deny we are pumping more CO2 into the atmosphere right now than ever before and that has a warming effect (the "greenhouse effect"). Surely the question is: "To what extent are man-made increases in CO2 emissions driving the current warming we are experiencing?". It clearly cannot be 100% and for me that is the nub of the question.
Given the huge unknowns about the factors that drive climate (and their significance) it seems unfortunate to me that there is an intolerance around this question. The BBC, for instance, should consider other theories on this. It may well be that the scientific weight suggests anthropogenic CO2 is by far the major cause, but in my reading there are some good reasons to doubt that.
The problem with “shutting down debate” is best evidenced with covid where many of the “conspiracy theories” proved to be correct. - CO2 is just a trace gas
One Planet Only Forever at 04:52 AM on 2 March, 2024JJones1960 @48,
I hope the following helps you understand that John and Bob have correctly pointed out that you have made a very weak counter-presentation regarding the significance of small amounts. The points presented in the Argument effectively counter the simplistic and understandably incorrect belief that the percentage of CO2 in the atmosphere is too small to make a difference.
A major weakness of your counter-presentation is that you appear to lack even a small amount of knowledge regarding the matter, here’s why:
You stated • You don’t use trace amounts of ozone to trap a significant amount of heat
That belief is contradicted by improved evidence-based understanding (contradicted by learning what is already known). One of the many presentations about the global surface temperature impacts of ozone is the NASA Aura item: The greenhouse effect of tropospheric ozone. It opens with the following:
Tropospheric ozone (O3) is the third most important anthropogenic greenhouse gas after carbon dioxide (CO2) and methane (CH4). Ozone absorbs infrared radiation (heat) from the Earth's surface, reducing the amount of radiation that escapes to space.
A lot can be learned from the items presented on SkS and other reliable information sources.
Learning from reliable sources can make a world of difference.
- There is no consensus
Eclectic at 18:27 PM on 10 September, 2023RicardoB @950 :
thank you for the link to Jordan Peterson's YouTube interview with Dr Judith Curry [made February 2023]. Thank you ~ sort of ~ but alas the video is one (1) hour plus 34 minutes long.
Warning. I didn't get much farther than 35 minutes into the video, before my patience ran out. Dr Curry seemed her usual rather vague & waffly self . . . a blend of half-truths & suggestive propaganda. [See my comments at post #949 , above.] If she or Dr Peterson have anything highly worthwhile to say in the remaining hour of the video ~ then please time-stamp it so I can go look at it.
Shortly before I gave up entirely, Curry at 38:40 said**: "at least over the next 3 decades, like the natural variability piece of this is pointing towards cooling ... [which] would tamp down the [CO2-caused warming]".
** My comment is that this is routine lawyer-advocate rhetoric coming from Curry ~ she has almost no evidence to support this "looming cooling" in the next 3 decades . . . but it sounds good to the gullible Denialist listener . . . and if real climate scientists challenged her, she would simply stand back and say (approx) "Oh I didn't say the world would cool, I just said the expected anthropogenic warming would/could/might be somewhat lower than the IPCC expects." [Which seems likely to be 0.5 degreesC hotter than 2023 ~ barring a sustained heavy asteroid bombardment.]
# At the start of his video : some minutes of Petersonian waffle ~ he may have (as a psychologist) some personal insight . . . but it seems to get overridden by his desire for limelight (such is his multi-year track record).
At 19:30 , Dr Jordan Peterson shows how little he knows about climate matters ~ fair enough ~ but why is he choosing to boost Dr Curry?
At 23:30 , Dr Curry makes vague & fluffy reference to cloud effects. And goes on to say: "we don't know how sensitive the climate is to increasing CO2"
At 24:35 , Curry goes on to suggest: "... the oceans and the sun that are the biggest sources of uncertainty in understanding what's going on ..."
RicardoB , you can see why I regard most of what comes out of Dr Curry's mouth as being very often slanted towards insinuations of a vague or semi-deniable type, well-suited as grist for Denialists.
But, if there's anything good in the last one (1) hour of the video . . . then let me know !
- Climate Confusion
Bob Loblaw at 23:11 PM on 23 August, 2023Markp @ 19:
In your first paragraph, you appear to be confusing two different scenarios:
- net zero implies that anthropogenic net additions to atmospheric CO2 are zero (which means emissions are zero, or we have found ways to remove CO2 as well as add it).
- Stabilize CO2 means that atmospheric concentrations are not changing - which can happen when anthropogenic net contributions are still positive, but are balanced because natural removals exceed natural additions by the same amount.
In the first case (net zero), natural removals (which currently exceed natural additions) will cause a reduction in atmospheric CO2 over the next decades, and we expect to see temperatures stabilize. The decreasing CO2 will not lead immediately to cooling, because the current CO2 levels still have "warming in the pipeline" that will offset the immediate direct cooling effect of less CO2.
In the second case (CO2 stable), there is still "warming in the pipeline", so we expect to see temperatures continue to rise for a while.
Once you understand this difference, I expect that much of your confusion will dissipate.
- A Frank Discussion About the Propagation of Measurement Uncertainty
bigoilbob at 02:39 AM on 20 August, 2023"Do you have any link to specific statements from Carl Wunsch? Curiosity arises."
Specifically, this is what I found. Old news, but not to me. I hope that I did not mischaracterize Dr. Wunsch earlier, and my apologies to both him and readers if aI did so.
"#5 Carl Wunsch
I am listed as a reviewer, but that should not be interpreted as an endorsement of the paper. In the version that I finally agreed to, there were some interesting and useful descriptions of the behavior of climate models run in predictive mode. That is not a justification for concluding the climate signals cannot be detected! In particular, I do not recall the sentence "The unavoidable conclusion is that a temperature signal from anthropogenic CO2 emissions (if any) cannot have been, nor presently can be, evidenced in climate observables." which I regard as a complete non sequitur and with which I disagree totally.
The published version had numerous additions that did not appear in the last version I saw.
I thought the version I did see raised important questions, rarely discussed, of the presence of both systematic and random walk errors in models run in predictive mode and that some discussion of these issues might be worthwhile."
https://pubpeer.com/publications/391B1C150212A84C6051D7A2A7F119#5
- How big is the “carbon fertilization effect”?
daveburton at 15:36 PM on 13 July, 2023Rob wrote elsewhere, "greening is now turning into 'browning.' ... fertilization [has now been] overwhelmed by other effects... In other words, the greening has now stopped," and here, "You were making the claim that natural sinks were removing more of our emissions, and that is not the case by any stretch of the imagination.""
Here's AR6 WG1 Table 5.1, which shows how natural CO2 removals are accelerating:
https://www.ipcc.ch/report/ar6/wg1/downloads/report/IPCC_AR6_WGI_Chapter_05.pdf#page=48
Here it is with the relevant bits highlighted:
https://sealevel.info/AR6_WG1_Table_5.1.png
Or, more concisely:
https://sealevel.info/AR6_WG1_Table_5.1_annot1_partial_carbon_flux_comparison_760x398.png
: 2.0 ⇒ 2.6 ⇒ 2.9 ⇒ 3.4 PgC/yr")
(Note: 1 PgC = 0.46962 ppmv = 3.66419 Gt CO2.)
As you can see, as atmospheric CO2 levels have risen, the natural CO2 removal rate has sharply accelerated. (That's a strong negative/stabilizing climate feedback.)
AR6 FAQ 5.1 also shows how both terrestrial and marine carbon sinks have accelerated, here:
https://www.ipcc.ch/report/ar6/wg1/downloads/report/IPCC_AR6_WGI_Chapter05.pdf#page=99
Here's the key graph; I added the orange box, to highlight the (small) portion of the graph which supports your contention that, "greening is now turning into 'browning.' ... fertilization [has now been] overwhelmed by other effects... In other words, the greening has now stopped."
https://sealevel.info/AR6_FAQ_5p1_Fig_1b_final2.png
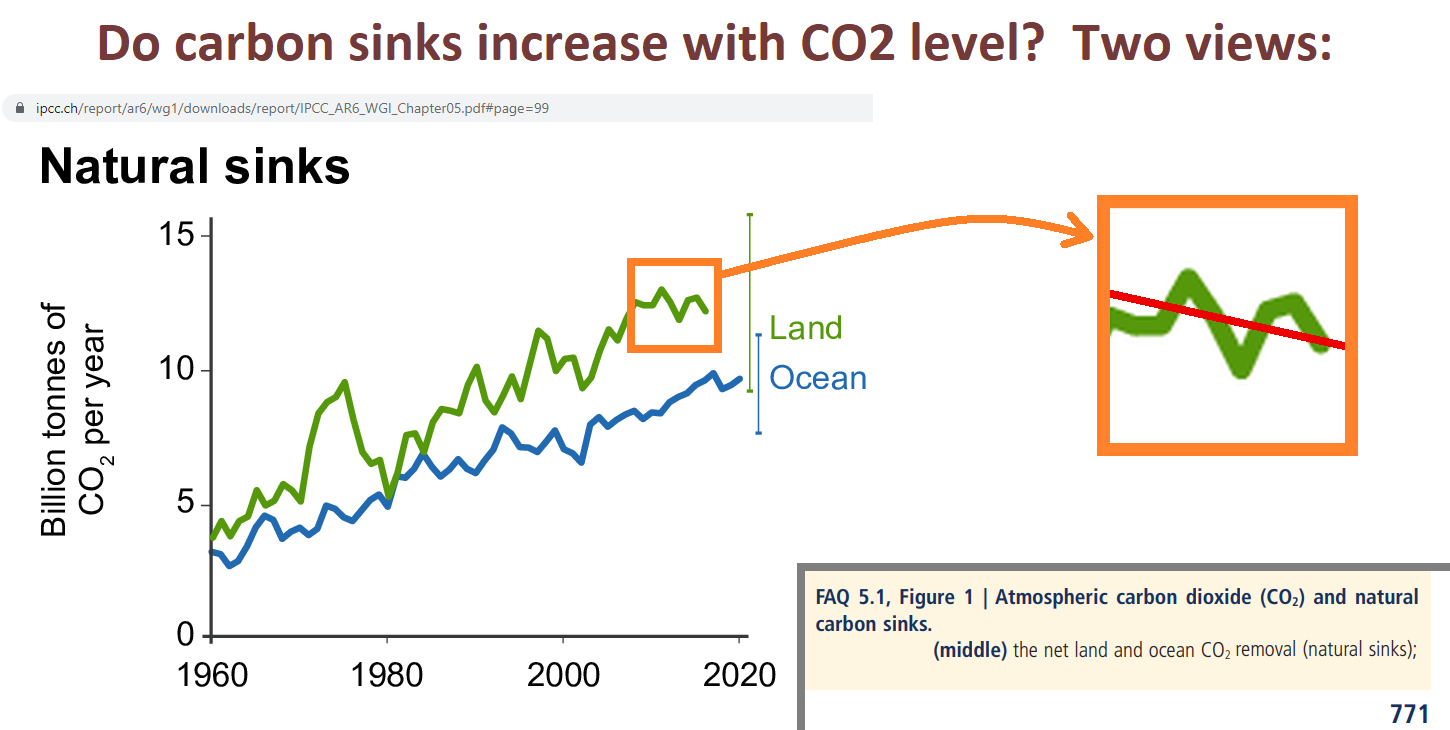
Here's the caption, explicitly saying that natural removal of carbon from the atmosphere is NOT weakening:

The authors did PREDICT a "decline" in the FUTURE, "if" emissions "continue to increase." But it hasn't happened yet.
What's more, the "decline" which they predicted was NOT for the rate of natural CO2 removals by greening and marine sinks, anyhow. Rather, if you read it carefully, you'll see that that hypothetical decline was predicted for the ratio of natural removals to emissions.
What's more, their prediction is conditional, depending on what happens with future emissions ("if CO2 emissions continue to increase").
Well, predictions are cheap. My prediction is that natural removals of CO2 from the atmosphere will continue to accelerate, for as long as CO2 levels rise.
The "fraction" which they predict might decline, someday, doesn't represent anything physical, anyhow. (It is one minus the equally unphysical "airborne fraction.") Our emission rate is currently about twice the natural removal rate, so if emissions were halved, the removal "fraction" would be 100%, and the atmospheric CO2 level would plateau. If emissions were cut by more than half then the removal "fraction" would be more than 100%, and the CO2 level would be falling.
I wrote elsewhere, "This recent study quantifies the effect for several major crops. Their results are toward the high end, but their qualitative conclusion is consistent with many, many other studies. They reported, "We consistently find a large CO2 fertilization effect: a 1 ppm increase in CO2 equates to a 0.4%, 0.6%, 1% yield increase for corn, soybeans, and wheat, respectively.""
If you recall that mankind has raised the average atmospheric CO2 level by 140 ppmv, you'll recognize that those crop yield improvements are enormous!
Rob replied, "If you actually read more than just the abstract of that study you find this on page 3: 'Complicating matters further, a decline in the global carbon fertilization effect over time has been documented, likely attributable to changes in nutrient and water availability (Wang et al. 2020).'"
Rob, I already addressed Wang et al (2020), but you might not have seen it, because the mods deemed it off-topic and deleted it. Here's what I wrote:
Rob, it's possible that your confusion on the greening/browning point was due to a widely publicized paper, with an unfortunately misleading title:
Wang et al (2020), "Recent global decline of CO2 fertilization effects on vegetation photosynthesis." Science, 11 Dec 2020, Vol 370, Issue 6522, pp. 1295-1300, doi:10.1126/science.abb7772
Many people were misled by it. You can be forgiven for thinking, based on that title, that greening due to CO2 fertilization had peaked, and is now declining.
But that's not what it meant. What it actually meant was that the rate at which plants remove CO2 from the atmosphere has continued to accelerate, but that its recent acceleration was less than expected. (You can't glean that fact from the abstract; would you like me to email you a copy of the paper?)
What's more, if you read the "Comment on" papers responding to Wang, you'll learn that even that conclusion was dubious:
Sang et al (2021), "Comment on 'Recent global decline of CO2 fertilization effects on vegetation photosynthesis'." Science 373, eabg4420. doi:10.1126/science.abg4420
Frankenberg et al (2021), "Comment on 'Recent global decline of CO2 fertilization effects on vegetation photosynthesis'." Science 373, eabg2947. doi:10.1126/science.abg2947
Agronomists have studied every important crop, and they all benefit from elevated CO2, and experiments show that the benefits continue to increase as CO2 levels rise to far above what we could ever hope to reach outdoors. Perhaps surprisingly, even the most important C4 crops, corn (maize) and sugarcane, benefit dramatically from additional CO2. C3 plants (including most crops, and all carbon-sequestering trees) benefit even more.
Rob also quoted the study saying, "While CO2 enrichment experiments have generated important insights into the physiological channels of the fertilization effect and its environmental interactions, they are limited in the extent to which they reflect real-world growing conditions in commercial farms across a large geographic scale."
That's a reference to the well-known fact that Free Air Carbon Enrichment (FACE) studies are less accurate than greenhouse and OTC (open top container) studies, because in FACE studies wind fluctuations unavoidably cause unnaturally rapid variations in CO2 levels. So FACE studies consistently underestimate the benefits of elevated CO2. Here's a paper about that:
Bunce, J.A. (2012). Responses of cotton and wheat photosynthesis and growth to cyclic variation in carbon dioxide concentration. Photosynthetica 50, 395–400. doi:10.1007/s11099-012-0041-7
The issue is also explained by Prof. George Hendrey, here:
"Plant responses to CO2 enrichment: Much of what is known about global ecosystem responses to future increases in atmospheric CO2 has been gained through Free-Air CO2 Enrichment (FACE) experiments of my design. All FACE experiments exhibit rapid variations in CO2 concentrations on the order of seconds to minutes. I have shown that long-term photosynthesis can be reduced as a consequence of this variability. Because of this, all FACE experiments tend to underestimate ecosystem net primary production (NPP) associated with a presumed increased concentration of CO2."
Rob wrote, "It does seem that you're claiming CO2 uptake falls with increasing temperature.""
That is correct for uptake by water. Or, rather, it would be correct, were it not for the fact that the small reduction in CO2 uptake due to the temperature dependence of Henry's Law is dwarfed by the large increase in CO2 uptake due to the increase in pCO2.
Rob wrote, "But it's unclear to me how you think this plays into the conclusion that CO2 levels would 'quickly normalize' over the course of 35 years" and also, "You also claimed CO2 concentrations would quickly come down (normalize) once we stop emitting it. This is also not correct unless you're using 'normalize' to mean 'stabilize at a new higher level'."
Perhaps you've confused me with someone else. I said nothing about CO2 levels "normalizing."
I did point out that the effective half-life for additional CO2 which we add to the atmosphere is only about 35 years. I wrote:
The commonly heard claim that "the change in CO2 concentration will persist for centuries and millennia to come" is based on the "long tail" of a hypothetical CO2 concentration decay curve, for a scenario in which anthropogenic CO2 emissions go to zero, CO2 level drops toward 300 ppmv, and carbon begins slowly migrating back out of the deep oceans and terrestrial biosphere into the atmosphere. It's true in the sense that if CO2 emissions were to cease, it would be millennia before the CO2 level would drop below 300 ppmv. But the first half-life for the modeled CO2 level decay curve is only about 35 years, corresponding to an e-folding "adjustment time" of about fifty years. That's the "effective atmospheric lifetime" of our current CO2 emissions.
Rob wrote, "Dave... The fundamental fact that you disputed is that oceans take up about half of our emissions."
That reflects two points of confusion, Rob.
In the first place, our emissions are currently around 11 PgC/year (per the GCP). The oceans remove CO2 from the atmosphere at a current rate of a little over 2.5 PgC/year. That's only about 1/4 of the rate of our emissions, not half.
More fundamentally, the oceans are not removing some fixed fraction of our emissions. None of the natural CO2 removal processes do. All of them remove CO2 from the bulk atmosphere, at rates which largely depend on the atmospheric CO2 concentration, not on our emission rate. If we halved our CO2 emission rate, natural CO2 removals would continue at their current rate.
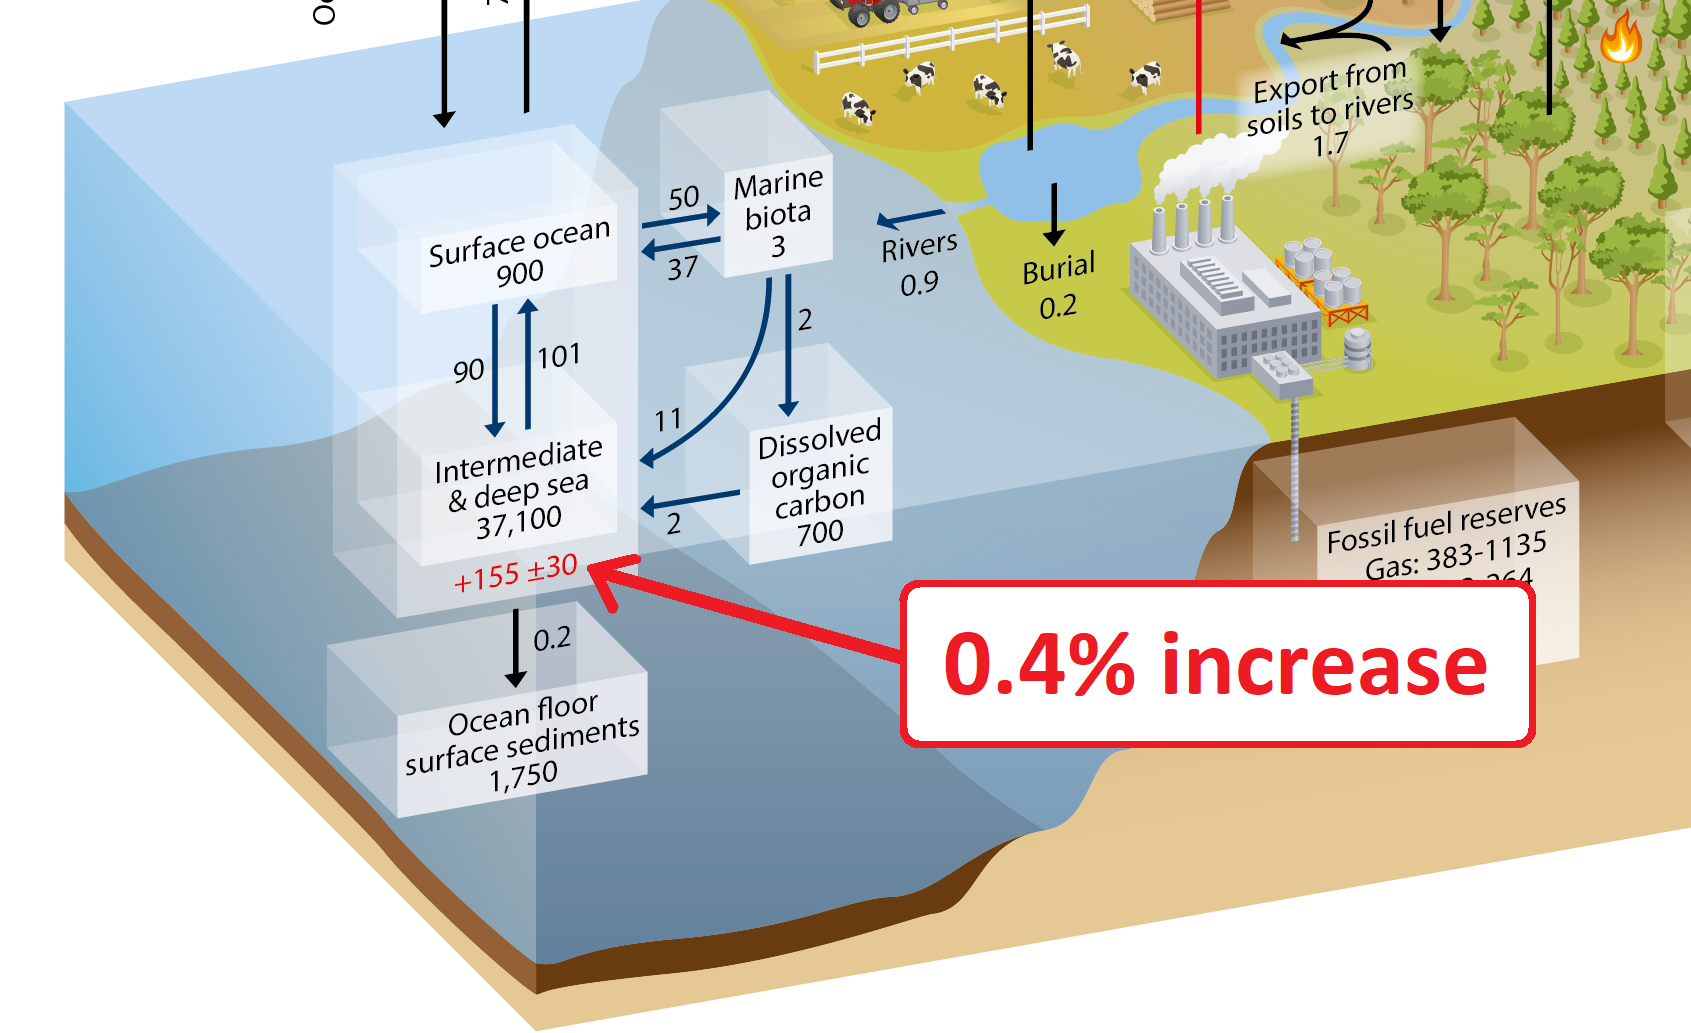
Because human CO2 emissions are currently faster than natural CO2 removals, we've increased the atmospheric CO2 level by about 50% (140 ppmv), but we've increased the amount of carbon in the oceans by less than 0.5%, as you can see in AR5 WG1 Fig. 6-1.
Sorry, this got kind of long. I hope I addressed all your concerns.
- How big is the “carbon fertilization effect”?
daveburton at 08:56 AM on 13 July, 2023Rob, in answer to your first question, Bob is correct: they use different units.
Both the graph and the "plug in suitable values" calculation (above) are for freshwater, but that hardly matters. CO2 is noticeably less soluble in saltwater, but the effect of temperature on CO2 solubility is nearly identical. Here's the same calculation with salinity 35 (typical seawater), for a 1° temperature increase (from 288K to 289K):
Bob is also correct that ocean chemistry is more complicated than that, in part because most of the dissolved CO2 immediately dissosiates into various ions. Here's a good resource on ocean chemistry:
http://www.molecularmodels.eu/cap11.pdf
What's more, in the oceans, biology generally trumps chemistry, and that is certainly true for CO2 uptake. Some people think that the capacity of the oceans to take up CO2 is limited to surface water by ocean stratification. But that's incorrect, beause the "biological carbon pump" rapidly moves CO2 from surface waters into the ocean depths, in the form of "marine snow."
The higher CO2 levels go, the faster that "pump" works. Here's a paper about it:
https://www.science.org/doi/reader/10.1126/science.aaa8026
Once carbon has migrated from the ocean surface to the depths, most of it remains sequestered for a very long time. Some of it settles on the ocean floor, but even dissolved carbon is sequestered for a long time. For instance, it is estimated that the AMOC takes about 1000 years to move carbon-rich water from high latitudes to the tropics, where it can reemerge. That is obviously far longer than the anthropogenic CO2 emission spike will last.
Due to the temperature dependence of Henry's Law, a 1°C increase in temperature slows CO2 uptake by the oceans by about 3%. That's a slight positive feedback: more CO2 in the air increases water temperatures, which slows ocean uptake of CO2. But it is very minor, because a 50% (140 ppmv) rise in atmospheric CO2 concentration accelerates CO2 uptake by the oceans by 50%, which obviously dwarfs 3%. That's the main reason that ocean uptake of CO2 continues to accelerate despite the temperature dependence of Hanry's Law.
- Hansen predicted the West Side Highway would be underwater
daveburton at 03:51 AM on 6 July, 2023Thanks for fixing those links, Rob. We were obviously typing simultaneously; you beat me to it by 7 minutes.
However, nothing I wrote was misleading. If you "follow the link to the actual IPCC page to read the full" table, you'll see that it shows exactly what I said it shows: as atmospheric CO2 levels have risen, the natural CO2 removal rate has sharply accelerated. (That's a strong negative/stabilizing climate feedback.)
The commonly heard claim that "the change in CO2 concentration will persist for centuries and millennia to come" is based on the "long tail" of a hypothetical CO2 concentration decay curve, for a scenario in which anthropogenic CO2 emissions go to zero, CO2 level drops toward 300 ppmv, and carbon begins slowly migrating back out of the deep oceans and terrestrial biosphere into the atmosphere. It's true in the sense that if CO2 emissions were to cease, it would be millenia before the CO2 level would drop below 300 ppmv. But the first half-life for the modeled CO2 level decay curve is only about 35 years, corresponding to an e-folding "adjustment time" of about fifty years. That's the "effective atmospheric lifetime" of our current CO2 emissions.
Moreover, it is not correct to say that "the ocean takes up about half of our emissions." Our emissions are currently around 11 PgC/year (per the GCP). The oceans remove CO2 from the atmosphere at a current rate of a little over 2.5 PgC/year, but they are not removing some fixed fraction of our emissions. If we halved our emission rate, natural CO2 removals would continue at their current rate.
Because human CO2 emissions are currently faster than natural CO2 removals, we've increased the atmospheric CO2 level by about 50% (140 ppmv), but we've increased the amount of carbon in the oceans by less than 0.5%, as you can see in AR5 WG1 Fig. 6-1. (It's not a problem for "sea dwelling creatures.")
In the oceans, biology generally trumps chemistry, and that is certainly true for CO2 uptake. Some people think that the capacity of the oceans to take up CO2 is limited to surface water by ocean stratification. But that's incorrect, beause the "biological carbon pump" rapidly moves CO2 from surface waters into the ocean depths, in the form of "marine snow."
The higher CO2 levels go, the faster that "pump" works. Here's a paper about it:
https://www.science.org/doi/reader/10.1126/science.aaa8026
Once carbon has migrated from the ocean surface to the depths, most of it remains sequestered for a very long time. Some of it settles on the ocean floor, but even dissolved carbon is sequestered for a long time. For instance, it is estimated that the AMOC takes about 1000 years to move carbon-rich water from high latitudes to the tropics, where it can reemerge. That is obviously far longer than the anthropogenic CO2 emission spike will last.
- Hansen predicted the West Side Highway would be underwater
daveburton at 17:24 PM on 5 July, 2023One Planet, why are you asking me "about the human origins of global warming"? My comment had nothing to do with that.
As for your first indented question, it appears that you've made two unjustifiable assumptions:
Assumption #1: You assume that there's such a thing as "a locked-in doubling of CO2."
If I understand you correctly, that means you think CO2 added to the atmosphere just stays "locked in" there, forever, and the longer we add CO2 to the air the higher the level will rise. Is that what you think?
If that's what you think, you're mistaken. CO2 doesn't just stay in the atmosphere. Nature is rapidly removing CO2 from the air, into other carbon reservoirs. The only reason the atmospheric CO2 level is nevertheless rising instead of falling is that we're adding CO2 to the air even faster than nature is removing it.
But it's becoming harder and harder to keep up with natural CO2 removals, because they're accelerating. This is an excerpt from AR6 WG1 Table 5.1, showing how the removals are accelerating:
LINK (Note: 1 PgC = 0.46962 ppmv = 3.66419 Gt CO2.)
At the current 420 ppmv level (i.e., 135-140 ppmv above a 280-285 ppmv baseline), those negative feedbacks already remove an average of about 5.5 PgC per year (= about 2.6 ppmv), and for each 20-25 ppmv increase in atmospheric CO2 concentration those removals accelerate by another 1 PgC/year.
With our current emission rate, the CO2 level is only rising by about 5.1 PgC/year (+2.4 ppmv). So it won't take much of a CO2 level increase before natural removals match our current emission rate: just (20 to 25 ppmv/PgC) × 5.1 PgC = (102 to 128) ppmv.
420 + (102 to 128) = 522 to 548 ppmv. That's the "plateau level" beyond which the atmospheric CO2 level cannot rise, unless our emissions increase further. If we were to continue our current anthropogenic emission rate indefinitely (or until the coal runs out), we'd still not quite reach 560 ppmv.
Assumption #2: You seem to think that the CO2 level controls sea-level. But the data do not support that assumption. Most coastal measurement sites have seen negligible acceleration in sea-level trend over the last century, even as the atmospheric CO2 level rose by 115 ppmv.
Here are the best long U.S. Atlantic and Pacific measurement records, respectively:
https://sealevel.info/MSL_graph.php?id=Battery&c_date=1923/6-2024/12
https://sealevel.info/MSL_graph.php?id=Honolulu&c_date=1923/6-2024/12
Both show a statistically insiginficant acceleration of 0.006 mm/yr² (± at least twice that) over the last century.
Hogarth studied many long measurement records, and concluded, "Sea level acceleration from extended tide gauge data converges on 0.01 mm/yr²"
That's very, very slight.
To calculate the effect of that acceleration use the following quadradic formula:
y = B + M·x + (A/2)·x²
where:
x is elapsed time
y is position or sea-level after time x
B is initial position or sea-level
M is current rate
A is acceleration
So (choosing some fairly typical values) if:
M = 1.5 mm/yr
A = 0.01 mm/yr²
x = 100 yrs
And if the trends were to continue:
y = B + 100·1.5 + (0.01/2)·100²
= B + 150 + 0.005·10000
= B + 150 + 50
= 200 mm = 7.9 inches
6" of that 8" is from the linear trend, and 2" of that 8" is due to acceleration.
However, there's a subtle twist. When acceleration is estimated by quadratic regression, we're fitting a quadratic curve to the measurement record to date. Extending that curve is the projection. But the curve's slope matches the linear tread at the midpoint, not at the end.
So, to find y (sea-level) 100 years from NOW, we should use x = 100+(L/2), where L is length of the measurement record.
So if we have a 100 year measurement record, to calculate the accumulated effect of the acceleration 100 years from now we should use x=150, not x=100.
Remember our formula:
y = B + M·x + (A/2)·x²
That last term is the effect of acceleration; using x=150 we get:
(A/2)·x² = 0.005·150² = 0.005·22500 = 112.5 mm = 4.4 inches.
So, an acceleration of 0.01 mm/year² is still negligible, but it's a "slightly bigger negligible."
A warming climate is know to have effects which both increase and decrease sea-level. Based on the negligible effect that the last century's CO2 increase and consenquent warming has had on sea-level trends, it is clear that, so far, the effects which increase and decrease sea-level must be similar in magnitude, and roughly cancelling.
So the assumption that a particular CO2 level "locks in" a particular sea-level is not justifiable. - Skeptical Science New Research for Week #26 2023
One Planet Only Forever at 06:21 AM on 3 July, 2023The pessimism of people like Prove We Are Smart is justified. But I do not agree that the end of developed human civilization is inevitable due to the current, and historical, success of pursuers of benefit from harmful unsustainable developments and the related misunderstandings and lack of awareness.
There is a robust diversity of evidence indicating that ethical consideration, the pursuit of increased awareness and improved understanding of what is harmful and a commitment to limit harm done and repair damage caused, is not effectively governing the actions of all people, especially not the most powerful and influential. But that could be corrected.
It will be interesting to see how the “Mass Extinctions and Their Relationship With Atmospheric Carbon Dioxide Concentration: Implications for Earth's Future” evaluation stands up, and is responded to. In addition to identifying that, by itself, increased CO2 levels are a serious problem that has already caused measurable damage, it essentially establishes that the only helpful climate change related geoengineering is actions that effectively remove CO2 from the atmosphere. See the following Quote:
Abstract (last part)
...Today's atmospheric CO2 concentration, ∼421 parts per million by volume (ppmv), corresponds in the most recent marine fossil record to a biodiversity loss of 6.39%, implying that contemporary anthropogenic CO2 emissions are killing ocean life now. The United Nations Intergovernmental Panel on Climate Change projects that unabated fossil fuel use could elevate atmospheric CO2 concentration to 800 ppmv by 2100, approaching the 870 ppmv mean concentration of the last 19 natural extinction events. Reversing this first global anthropogenic mass extinction requires reducing net anthropogenic CO2 emissions to zero, optimally by 2% per year starting immediately.
Key Points
• Past mass extinctions are correlated with atmospheric CO2 concentration, but not with long-term temperature nor radiative forcing by CO2
• Present CO2 concentration is associated in the fossil record with a 6.39% genus loss, implying current human destruction of biodiversity
• Future anthropogenic mass extinction can be stopped only by cutting human emissions of CO2 to zero, optimally by 2% per year starting now.
The statement that “...cutting human emissions of CO2 to zero, optimally by 2% per year starting now.” is ethically questionable. The ethical objective would be a quicker reduction, more sooner, while maintaining the development of sustainable improvements for the portion of humanity that is not living at least a basic decent life. And the first step of the ‘optimal transition’ would be a ‘big step’ of very rapidly ending unnecessary activities that cause increased CO2 levels, even if doing that would reduce developed perceptions of ‘success or superiority’ for many people.
In the bigger picture, the future of humanity, the concern is human actions that reduce the magnitude of the biodiversity of life, even if extinctions are not the result. And reduction of biodiversity happens due to many other human activities, not just fossil fuel use. Also, there are many other impacts of human fossil fuel activity that negatively impact biodiversity. Increased CO2 levels are not the only fossil fuel related problem. However, as the research report indicates, other actions to protect biodiversity are meaningless if action is not taken to limit the increase of CO2 levels.
The bigger picture bottom line is the need to reduce the harmful impacts of fossil fuel use and repair damage done in parallel with rapidly ended the activity. Also, the difficult challenge we face today due to the lack of responsible harm reduction through the past 30 years indicates that limiting the damage done by fossil fuel impacts will need to happen much faster than democratic free market action will ‘choose to end it and repair the damage done’. One established certainty is that removal of CO2 will be required to minimize and repair the damage done.
Currently developed methods for CO2 removal from the atmosphere, and measures to reduce CO2 releases from fossil fuel burning while the activity is being rapidly ended, will need to be implemented even if they are not considered to be ‘actions that are economically preferred today’.
The challenge is getting ‘economically motivated people (people who want to personally benefit from economic activity)’ to admit that the developed systems have a history of motivating the development of damaging results (because more harmful action can be quicker, easier and cheaper). Those unsustainable developments can be very hard to correct, especially if the harmful development is popular among, or profitable for, a powerful and influential portion of global humanity that has little interest in correcting their developed perceptions of superiority relative to others.
I am optimistic about the future of humanity (otherwise there is no ethical purpose). But I am very pessimistic about the rate of success humanity will have in efforts to govern/limit the damage done by seemingly insatiable pursuers of ‘increased perceptions of status’.
- 2nd law of thermodynamics contradicts greenhouse theory
Eclectic at 00:12 AM on 14 June, 2023Rob Honeycutt @1564 , regarding the Davis paper [Davis W.J., 2017], he does indeed go on at length about the GHG forcing from CO2 . . . and yet overall he appears to have little understanding of the physics of terrestrial GHGs.
"... large variations in CO2 exert little or negligible effects on temperature" [unquote]
"The generally weak or absent correlations between the atmospheric concentration of CO2 and T [Temperature] ... imply that other unidentifiable variables caused most (>95%) of the variance in T across the Phanerozoic climate record." [note the "unidentifiable variables"]
A one-line mention of water vapor.
No mention of Faint Young Sun.
Extensive mention of statistical analysis of CO2 / Temperature . . . from which Davis seems only to have identified "a prominent 15 million-year CO2 cycle" ~ but he makes no attempt to link this alleged cycle to any physical processes or occurrences on planet Earth.
"anthropogenic emissions of CO2 accelerated at the start of the Industrial Age in the mid-18th century" [did he mean to say mid-19th ?? ]
I could go on.
Rob ~ as you stated earlier, this Davis paper is ridiculous.
[ Moderator ~ I would prefer to say that Motivated Reasoning is a consequence of Cognitive Dissonance . . . but as you rightly indicate, this is not really the thread for such discussions. ]
- What does past climate change tell us?
Bob Loblaw at 12:15 PM on 7 June, 2023Eddie @ 33:
Given that there is no single, simple hypothesis on which "anthropogenic global warming" is based, providing a simple example that would "falsify" it is a dishonest challenge.
The prediction of rising temperature in response to increased greenhouse gases is a logical consequence of many falsifiable aspects of physics. Just a handful, off the top of my head:
- energy conservation
- radiation theory (many sub-theories)
- CO2 gas absorbs and emits IR radiation at wavelengths that occur on earth.
- geophysical fluid dynamics
- gravity
- etc.
By "computer models", I assume that you mean models such as general circulation models used to simulate global climate. Such models are really just "computer solutions to mathematical models". The mathematical equations in such models are many - and cover the many aspects of physics that are required. All of those equations are - in principle - falsifiable. All of them have strong evidence that they are reasonably correct - i.e., nothing has been observed that would falsify the theories that they describe.
- There is no consensus
Rob Honeycutt at 01:28 AM on 20 April, 2023@923... I'd agree with BL that the last sentence there is a quantification of >50%. But it's a moot point. Whether one were to put it in category 1 or 2 matters not, since both of those categories are endorsements of the idea that humans are the primary cause of modern warming.
So, one more time, the entire exercise this paper engages in is to separate research that endorses the position that humans are primarily responsible for warming and papers that minimize human responsibility. That is the very structure of the rating system. That is the fundamental premise stated in the title of the paper, Quantifying the consensus on anthropogenic global warming in the scientific literature.
Papers either endorse AGW or they minimize it. If a paper claims that the direct effects of CO2 are too small compared to other natural factors that is a minimization of the anthropogenic element of global warming.
- There is no consensus
Albert at 13:09 PM on 19 April, 2023Once again I ask, why have 3 categories lumped into the "97%" result when only one category saying "explicit or implicit support that humans contribute to global warming".
Again, virtually every sceptic scientist, meteorologist, geologist, etc would agree with the above statement so they will not be publishing a paper saying there is little or no anthropogenic warming.
Skeptics believe in the direct effect of CO2 causing an ECS of about 1.2C but reject the positive feedback theory pushing ECS to 3C and beyond.
So categories 5,6 and 7 are really meaningless, because of the above.
Quite commonly I see statements saying that Cooks paper said the "97% of scientists believe that humans are largely (>50%) responsible for global warming" but Cooks paper category 1 clearly and unambiguously states that the figure is 1.6%.
- Settled Science - Humans are Raising CO2 Levels
Bob Loblaw at 06:44 AM on 13 January, 2023A follow-up to my comment @ 69, which was a response to EnderWiggin @ 68.
On Tuesday, I did a search for the title and author (Salby) that EnderWiggin provided. I was able to find parts 1 and 2 on a site hosted at scc.klimarealistene.com - but by Wednesday, that domain name had disappeared and could no longer be reached.
klimarealistene.com does still exist, but has no signs of the papers. A bit of searching on their web page found a link to scienceofclimatechange.org. Eventually, the two papers were found on this page (Volume 1.2 December 2021).
A bit of background. Klimarealistene is a well-known Norwegian climate "science" contrarian group. The "journal" Science of Climate Change is their creation. I suspect the change in web location has to do with reorganization of the journal's online pages. The old "scc" portion of the klimarealistene link was undoubtedly short for Science of Climate Change.
On the main SCC page, they say:
4 November, 2022
The journal Science of Climate Change was funded by Klimarealistene in Norway in September 2020, and the first issue appeared in August 2021. Several additional articles have been published in 2021 and 2022, but due to a heavy work load on the Editor they have not been collected into Volumes before now. A few articles have also been delayed in being published. The Scientific Council of the Norwegian Climate Realists is at the moment working on a plan for the management of the journal from 2023. In the mean time I have stepped in as Editor to handle the backlog…
The list of authors on their Volumes and Issues page reads like a who's-who of climate science contrarianism in Norway. Standard names such as Salby, Humlum, Harde, and Solheim dominate.
So, the "obscure" journal, as EnderWiggin refers to it, looks like it is basically just a mouth-piece for Klimarealistene, so they can "publish" stuff and make it look like a journal. Credibility factor approaching zero.
The two CO2 papers in question are co-authored between Salby and Hermann Harde. Interestingly, Salby is listed with an affiliation of "Ex Macquarie University" -a university he was fired from in 2013, after only 5 years. Not an inaccurate claim - he's clearly no longer there - but rather reeks of resume padding. (Of course, Salby is now "Ex Earth", having passed away in 2022.)
Part 1 basically looks at C14 fluxes and argues that it can be used to estimate carbon uptake rates. Part 2 follows to look at recent (nothing older than 1956) variations in CO2 and temperature, to claim that anthropogenic contributions to the rise in CO2 are negligible.
I didn't try to evaluate their math in detail, but basically it looks like yet another case of taking the short-term variation in CO2 concentrations and temperature, and making erroneous statistic correlations that mislead them about long-term trends. Same dog, same old tricks.
In my comment above, the most applicable debunking is probably the one in this SkS post:
- Skeptical Science New Research for Week #50 2022
peterklein at 07:12 AM on 16 December, 2022I mostly became mostly aware of the climate and global warming issue about the time that Al Gore began beating the drum (even while he continued to fly globally in his private jet). Since then, I've read about climate change and climate modeling from many sources, including ones taking the position that ‘it is not a question if it is a big-time issue, but what to do about it now, ASAP?’.
In the past few weeks, it appeared to me there has been a of articles, issued reports, and federal government activity, including recently approved legislation, related to this topic. While it obviously has been one of the major global topics for the past 3+ decades, the amount of public domain ‘heightened activity’ seems (to me) to come in waves every 4-6 months. That said, I decided to write on the topic based on what I learned and observed over time from articles, research reports, and TV/newspaper interviews.
There clearly are folks, associations, formal and informal groups, and even governments on both sides of the topic (issue). I also have seen over the decades how the need for and the flow of money sometimes (many times?) taints the results of what appear to be ‘expert-driven and expert-executed’ quantitative research. For example, in medical research some of the top 5% of researchers have been found altering their data and conclusions because of the source of their research funding, peer ‘industry’ pressure and/or pressure from senior academic administrators.
Many climate and weather-related articles state that 95+% of researchers agree on major climate changes; however (at least to me) many appear to disagree on the short-medium-longer term implications and timeframes.
What I conclude (as of now)
1. This as a very complex subject about which few experts have been correct.
2. We are learning more and more every day about this subject, and most of what we learn suggests that what we thought we knew isn't really correct or at least as perfectly accurate as many believe.
3. The U.S. alone cannot solve whatever problem exists. If we want to do something constructive, build lots of nuclear power plants ASAP (more on that to follow)!
4. Any rapid reduction in the use of fossil fuels will devastate many economies, especially those like China, India, Africa and most of Asia. Interestingly, the U.S. can probably survive a 3 or 4% reduction in carbon footprint annually over the next 15 years better than almost any country in the world, but this requires the aforementioned construction of multiple nuclear electrical generating facilities. In the rest of the world, especially the developing world, their economies will crash, and famine would ensue; not a pretty picture.
5. I am NOT a reflexive “climate denier” but rather a real-time skeptic that humans will be rendered into bacon crisps sometime in the next 50, 100 or 500+ years!
6. One reason I'm not nearly as concerned as others is my belief in the concept of ‘progress’. Look at what we accomplished as a society over the last century, over the last 50, 10, 5 and 3 years (e.g., Moore’s Law is the observation that the number of transistors on integrated circuits doubles about every two years!). It is easy to conclude that we will develop better storage batteries and better, more efficient electrical grids that will reduce our carbon footprint. I'm not so sure about China, India and the developing world!
7. So, don't put me down as a climate denier even though I do not believe that the climate is rapidly deteriorating or will rapidly deteriorate as a result of CO2 upload. Part of my calm on this subject is because I have read a lot about the ‘coefficient of correlation of CO2 and global warming, and I really don't think it's that high. I won't be around to know if I was right in being relaxed on this subject, but then I have more important things to worry about (including whether the NY Yankees can beat Houston in the ACLS playoffs, assuming they meet!).
My Net/Net (As of Now!)
I am not a researcher or a scientist, and I recognize I know far less than all there is to know on this very complex topic, and I am not a ‘climate change denier’… but, after
also reading a lot of material over the years from ‘the other side’ on this topic, I conclude it is monumentally blown out of proportion relative to those claiming: ‘the sky is falling and fast’!
• Read or skim the book by Steven Koonin: Unsettled: What Climate Science Tells Us, What It Doesn't, and Why It Matters /April 27, 2021; https://www.amazon.com/Unsettled-Climate-Science-Doesnt-Matters/dp/1950665798
• Google ‘satellite measures of temperature’; also, very revealing… see one attachment as an example.
• Look at what is happening in the Netherlands and Sri Lanka! Adherence to UN and ESG mandates are starving countries; and it appears Canada is about to go over the edge!
• None of the climate models are accurate for a whole range of reasons; the most accurate oddly enough is the Russian model but that one is even wrong by orders of magnitude!
• My absolute favorite fact is that based on data from our own governmental observation satellites: the oceans have been rising over the last 15 years at the astonishing rate of 1/8th of an inch annually; and my elementary mathematics suggests that if this rate continues, the sea will rise by an inch sometime around 2030 and by a foot in the year 2118… so, no need to buy a lifeboat if you live in Miami, Manhattan, Boston, Los Angeles, or San Francisco!
• Attached is a recent article and a Research Report summary.
Probably the most damning is the Research Report comparison of the climate model predictions from 2000, pointing to 2020 versus the actual increase in temperature that has taken place in that timeframe (Pages 9-13). It's tough going and I suggest you just read the yellow areas on Page 9 (the Abstract and Introduction, very short) and the 2 Conclusions on Page 12. But the point is someone is going to the trouble to actually analyze this data on global warming coefficients!
My Observations and Thinking
In the 1970s Time Magazine ran a cover story about our entering a new Ice Age. Sometime in the early 1990s, I recall a climate scientist sounding the first warning about global warming and the potentially disastrous consequences. He specifically predicted high temperatures and massive floods in the early 2000’s. Of course, that did not occur; however, others picked up on his concern and began to drive it forward, with Al Gore being one of the primary voices of climate concern. He often cited the work in the 1990’s of a climate scientist at Penn State University who predicted a rapid increase in temperature, supposedly occurring in 2010 and, of course, this also did not occur.
Nonetheless many scientists from various disciplines also began to warn about global warming starting in the early 2000’s. It was this growing body of ‘scientific’ concern that stimulated Al Gore's concern and his subsequent movie. It would be useful for you to go back to that and review the apocalyptic pronouncements from that time; most of which predicted dire consequences, high temperatures, massive flooding, etc. which were to occur in 10 or 12 years, certainly by 2020. None of this even closely occurred to the extent they predicted.
That said, I was still generally aware of the calamities predicted by a large and diverse body of global researchers and scientists, even though their specific predictions did not take place in the time frame or to the extent that they predicted. As a result, I become a ‘very casual student’ of climate modeling.
Over the past 15 years climate modeling has become a popular practice in universities, think-tanks and governmental organizations around the globe. Similar to medical and other research (e.g., think-tanks, etc.) I recognized that some of the work may have been driven by folks looking for grants and money to keep them and their staff busy.
A climate model is basically a multi-variate model in which the dependent variable is global temperature. All of these models try to identify the independent variables which drive change in global temperature. These independent variables range from parts per million of carbon dioxide in the atmosphere to sunspot activity, the distance of the earth from the sun, ocean temperatures, cloud cover, etc. The challenge of a multi-variant model is first to identify all of the various independent variables affecting the climate and then to estimate the percent contribution to global warming made by a change in any of these independent variables. For example, what would be the coefficient of correlation for an increase in carbon dioxide parts per million to global warming?
You might find that an interesting cocktail party question to ask your friends “what is the coefficient of correlation between the increase in carbon dioxide parts per million and the effect on global warming?” I would be shocked if any of them even understood what you were saying and flabbergasted if they could give you an intelligent answer! There are dozens of these climate models. You might be surprised that none of them has been particularly accurate if we go back 12 years to 2010, for example, and look at the prediction that the models made for global warming in ten years, by 2020, and how accurate any given model would be.
An enterprising scientist did go back and collected the predictions from a score of climate models and found that a model by scientists from Moscow University was actually closer to being accurate than any of the other models. But the point is none were accurate! They all were wrong on the high side, dramatically over predicting the actual temperature in 2020. Part of the problem was that in several of those years, there was no increase in the global temperature at all. This caused great consternation among global warming believers and the scientific community!
A particularly interesting metric relates to the rise in the level of the ocean. Several different departments in the U.S. government actually measures this important number. You might be surprised to know, as stated earlier, that over the past 15 or so years the oceans have risen at the dramatic rate of 1/8th of an inch annually. This means that if the oceans continued to rise at that level, we would see a rise of an inch in about 8 years, sometime around 2030, and a rise of a foot sometime around the year 2118. I suspect Barack Obama had seen this data and that's why he was comfortable in buying an oceanfront estate on Martha's Vineyard when his presidency ended!
The ‘Milankovitch Theory’ (a Serbian astrophysicist Milutin Milankovitch, after whom the Milankovitch Climate Theory is named, proposed about how the seasonal and latitudinal variations of solar radiation that hit the earth in different and at different times have the greatest impact on earth's changing climate patterns) states that as the earth proceeds on its orbit, and as the axis shifts, the earth warms and cools depending on where it is relative to the sun over a 100,000-year, and 40,000-year cycle. Milankovitch cycles are involved in long-term changes to Earth's climate as the cycles operate over timescales of tens of thousands or hundreds of thousands of years.
So, consider this: we did not suddenly get a lot more CO2 in the atmosphere this year than we had in 2019 (or other years!), but maybe the planet has shifted slightly as the Milankovitch Theory states, and is now a little closer to the sun, which is why we have the massive drought. Nothing man has done would suddenly make the drought so severe, but a shift in the axis or orbit bringing the planet a bit closer to the sun would. It just seems logical to me. NASA publicly says that the theory is accurate, so it seems that is the real cause; but the press and politicians will claim it is all man caused! You can shut down all oil production and junk all the vehicles, and it will not matter per the Theory! Before the mid-1800’s there were no factories or cars, but the earth cooled and warmed, glaciers formed and melted, and droughts and massive floods happened. The public is up against the education industrial complex of immense corruption!
In the various and universally wrong ‘climate models’, one of the ‘independent’ variables is similar to the Milankovitch Theory. Unfortunately, it is not to the advantage of the climate cabal to admit this or more importantly give it the importance it probably deserves.
People who are concerned about the climate often cite an ‘increase in forest fires, hurricanes, heat waves, etc. as proof of global warming’. And many climate deniers point out that most forest fires are proven to be caused by careless humans tossing cigarettes into a pile of leaves or leaving their campfire unattended, and that there has been a dramatic decrease globally on deaths caused by various climate factors. I often read from climate alarmists (journalists, politicians, friends, etc.), what I believe are ‘knee-jerk’ responses since they are not supported by meaningful and relevant data/facts, see typical comments below:
• “The skeptical climate change deniers remind me of the doctors hired by the tobacco industry to refute the charges by the lung cancer physicians that tobacco smoke causes lung cancer. The planet is experiencing unprecedented extreme climate events: droughts, fires, floods etc. and the once in 500-year catastrophic climate event seems to be happening every other year. Slow motion disasters are very difficult to deal with politically. When a 200-mph hurricane hits the east coast and causes a trillion dollars in losses then will deal with it and then climate deniers will throw in the towel!”
These above comments may be right, but to date the forecasts on timing implications across all the models are wrong! It just ‘may be’ in 3, 10 or 50 years… or in 500-5000+ before the ‘sky is falling’ devastating events directly linked to climate occur. If some of the forecasts, models were even close to accuracy to date I would feel differently.
I do not deny there are climate related changes I just don’t see any evidence their impact is anywhere near the professional researchers’ forecasts/models on their impact as well as being ‘off the charts’ different than has happened in the past 100-1000+ years.
But a larger question is “suppose various anthropogenetic actions (e.g., chiefly environmental pollution and pollutants originating in human activity like anthropogenic emissions of sulfur dioxide) are causing global warming?”. What are they, who is doing it, and what do we do about it? The first thing one must do is recognize that this is a global problem and that therefore the actions of any one country has an effect on the overall climate depending upon its population and actions. Many in the United States focus intensely upon reducing carbon emissions in the U.S. when of course the U.S. is only 5% of the world population. We are however responsible for a disproportionate part of the global carbon footprint; we contribute about 12%. The good news is that the U.S. has dramatically reduced its share of the global carbon footprint over the past 20 years and doing so while dramatically increasing our GDP (up until the 1st Half of 2022).
Many factors have contributed to the relative reduction of the U.S. carbon footprint. Chief among these are much more efficient automobiles and the switch from coal-driven electric generation plants to those driven by natural gas, a much cleaner fossil fuel.
While the U.S. is reducing its carbon footprint more than any other country in the world, China has dramatically increased its carbon footprint and now contributes about 30% of the carbon expelled into the atmosphere. China is also building 100 coal-fired plants!
Additional facts, verified by multiple sources including SNOPES, the U.,S. government, engineering firms, etc.:
• No big signatories to the Paris Accord are now complying; the U.S. is out-performing all of them.
• EU is building 28 new coal plants; Germany gets 40% of its power from 84 coal plants; Turkey is building 93 new coal plants, India 446, South Korea 26, Japan 45, China has 2363 coal plants and is building 1174 new ones; the U.S. has 15 and is building no new ones and will close about 15 coal plants.
• Real cost example: Windmills need power plants run on gas for backup; building one windmill needs 1100 tons of concrete & rebar, 370 tons of steel, 1000 lbs of mined minerals (e.g., rare earths, iron and copper) + very long transmission lines (lots of copper & rubber covering for those) + many transmission towers… rare earths come from the Uighur areas of China (who use slave labor), cobalt comes from places using child labor and use lots of oil to run required rock crushers... all to build one windmill! One windmill also has a back-up, inefficient, partially running, gas-powered generating plant to keep the grid functioning! To make enough power to really matter, we need millions of acres of land & water, filled with windmills which consume habitats & generate light distortions and some noise, which can create health issues for humans and animals living near a windmill (this leaves out thousands of dead eagles and other birds).
• So, if we want to decrease the carbon footprint on the assumption that this is what is driving the rise in the sea levels (see POV that sea levels are not rising at: www.tiktok.com/t/ZTRChoNTg) and any increase in global temperature, we need to figure out how to convince China, India and the rest of the world from fouling the air with fossil fuels. In fact, if the U.S. wanted to dramatically reduce its own carbon footprint, we would immediately begin building 30 new nuclear electrical generating plants around the country! France produces about 85% of its electrical power from its nuclear-driven generators. Separately, but related, do your own homework on fossil fuels (e.g., oil) versus electric; especially on the big-time move to electric and hybrid vehicles. Engineering analyses show you need to drive an electric car about 22 years (a hybrid car about 15-18 years) to breakeven on the savings versus the cost involved in using fossil fuels needed to manufacture, distribute and maintain an electric car! Also, see page 14 on the availability inside the U.S. of oil to offset what the U.S. purchases from the middle east and elsewhere, without building the Keystone pipeline from Canada.
Two 4-5-minute videos* on the climate change/C02/new green deal issue, in my opinion, should be required viewing in every high school and college; minimally because it provides perspective and data on the ‘other’ side of the issue while the public gets bombarded almost daily by the ‘sky is falling now or soon’ side on climate change!
* https://www.prageru.com/video/is-there-really-a-climate-emergency and
https://www.prageru.com/video/climate-change-whats-so-alarming - 2022 SkS Weekly Climate Change & Global Warming News Roundup #46
EddieEvans at 22:41 PM on 14 December, 2022I'm not so sure that ethics will help with denial or the climate, but I seem to think so at times.
We are speaking of ethics in climate science. Here's an example of the problem.
In a recent publication, J. Hansen et al., footnote #9, says that E.E. David, Jr. later became a global warming "denier." I'd like to know more about David's history with Exxon. It's part of the denier's legacy. This stuff needs to be documented, something like in Speth's "They Knew."
David's turnabout is especially egregious because he previously said in David, E.E., Jr.: (American Geographical Union Monograph 29), footnote #8 of Hansen et al.
I'm not sure what constituted a "denier" at the time, but the consequences outweighed a "fair and balanced" opinion, a lingering assumption on David's part. David had no right, no duty to declare anthropogenic climate change a dead idea if that's what "denier" meant. He's like Exxon's guy.
Exxon and the others are still at it.
I'm arguing with myself here. Venting after running into Hansen's paper.
- Skeptical Science New Research for Week #43 2022
Bob Loblaw at 01:48 AM on 10 November, 2022MA Rodger:
I was going to see if Art Vandelay was going to try to defend the "paper", but why wait. The "paper" is short, and the failures of its analysis are obvious in two places.
The abstract states:
The CO2 which humans emit by breathing is commonly thought to fully recycle by photosynthesis. Therefore it is unable to enter the atmosphere and affect the climate. This notion, though popular, is flawed. Suppose a sink-flux of magnitude P limits the amount of CO2 recycled. Then the CO2 emitted in excess of P must be removed into the atmosphere as an airborne fraction and a rise of atmospheric CO2 will accompany the only partial cycling of breath-CO2.
Art Vandelay quoted and highlighted this snippet from the paper:
Rather, all emissions of CO2, including anthropogenic emission by the breath of humans, have an airborne fraction > 0, by means of which they affect the atmosphere, increasing the greenhouse effect.
The paper questions what happens to the CO2 emitted by human breath, once it is released into the atmosphere.
What the paper ignores is the question of where that carbon came from. Scotty did not beam it into the human bodies. It did not appear in human bodies by magic. It came from plants that recently photosynthesized it - some time in the past few years. It may have passed through cattle or some other animal in the food chain on its way to human digestion, but the simple fact is that 100% of the human emission of CO2 by breath was recently extracted from the atmosphere. Thus, it causes no net change in atmospheric concentration (over the time scale of a few years).
The "paper" does not understand what a "cycle" is (as in "carbon cycle"). It is not a one-way path that starts with humans and ends with atmospheric removal by photosynthesis or other factors. Human breathing contributes CO2 to the atmosphere, and that carbon only comes from one of many sources of carbon in the carbon cycle - recent photosynthesis by plants.
The author of that "paper" is ignorant. From all appearances, Art Vandelay selects that "paper" to support his position - not because it is a good analysis, but rather because he likes the "conclusion". Art is no better informed than the author, or he'd see the obvious flaws.
- Skeptical Science New Research for Week #43 2022
Art Vandelay at 23:18 PM on 9 November, 2022So it turns out that published studies exist. This from 2021.
https://www.researchgate.net/publication/346307914_Human_breath-
Extract from the study..
In short, contrary to published claims [Alexander, 2010; Palmer, 2009; Withers, 2009], the assumption that breath emission is always ideally balanced by cycling of CO2 is not tenable. Given B > P, airborne flux b equals B – P. Cycling implies that breath emission B gives rise to an airborne flux b in excess of the cycling flux P, adding CO2 to the atmosphere. There is a whole range of positive values of b,
excepting only a single point where B coincides with P. Greenhouse effect and global warming will follow an increase in atmospheric CO2, making the escape of breath-CO2 relevant for the climate.
The mainstream argument maintains that 1) emission of CO2 by the breath of humans is fully compensated, largely by photosynthesis, and 2) only non-cyclic processes like the consumption of fossil fuels give rise to an airborne fraction of CO2 which alters the atmosphere. In contrast, I maintain that full compensation of breath emission by photosynthesis is not tenable. Rather, all emissions of CO2, including anthropogenic emission by the breath of humans, have an airborne fraction > 0, by means of which they affect the atmosphere, increasing the greenhouse
effect.
While in the past an increase of the atmospheric greenhouse effect by human breath was denied, this increase, contrary to the burning of fossil fuel, turns out to be an unavoidable consequence of human physiology. It is linearly dependent on population size, thus birth control may be expected to cope with it.
- There's no tropospheric hot spot
MA Rodger at 19:23 PM on 23 August, 2022Cedders @33,
And having had a read of that PDF...
Cedders @33,
Having examined the PDF (16 pages not 24), it is quite evident that it is a pile of utter nonsense, a "welcome to the lunatic asylum" message and not anything in any way scientifically-based.
The author is Piers Corbyn, a well-kown denialist and an elder brother of Jeremy Corbyn (a long-serving left-wing Labour MP who bizarrely gained the heady position of Leader of the Labour Party for 4½ years).
Piers Corbyn is described in Wikithing as "an English weather forecaster, businessman, anti-vaxxer and conspiracy theorist" and does feature here at SkS being (1) Cited within a spot of denialism of 2015 in the Daily Express tabloid/comic, (2) The main source of a pile of climate nonsense of 2013 from the then Mayor of London Alexander Boris von Pfiffle Johnson, a man now renowned throughout the known world for not being particularly truthful, (3) Listed here at SkS as a denialsit with zero peer-reviewed writings.
The 16 page thesis linked up-thread @33 is a 2019 thesis presented to the Reading University Debating Journal and sitting at the top of a list of 24 such theses posted 2018-19, top of the list because it is the most recent (the journal lasted less than a year), a list which addresses such important topics as 'Why Self-Service Checkouts are the Invention of the Devil' and 'The Great University of Reading Catering Con: Man Shall Not Live off Sandwiches Alone' and an anonymous piece 'Why I Support the Conservatives: The Most Successful Party in British History'.
The Piers Corbyn thesis begins by citing David Legates' dismissal of the 97% AGW consensus before dismissing that because "it is about facts; and no Global-Warming Inquisition is going to prevent me exposing their nonsensical theories."
Corbyn then kicks off by asserting anthropogenic CO2 comprises 4% of atmospheric CO2 (thus confusing FF carbon with naturally-cycled carbon) and that CO2 is not the main controller of global temperature (here presenting a graphic which confuses the US temperature with global temperature - shown below in this comment).
A further assertion is then presented, that CO2 is the result of warming oceans with six references/notes provided in support which seem to all point back to crazy denialist Murry Salby.
So, a la Salby, the present rise in CO2 is claimed to result from the good old Medieval Warm Period. A graphic is presented comparing a denialist 1,000y temperature record (based on the schematic FAR Fig 7c) with the much-confirmed scientifically-based Hockey Stick graph.
This brings us to the halfway page of Corbyn's denialist rant.
The thesis continues with pageful of misunderstanding of how the GH-effect works, ending with accusations that this misunderstood 'theory' breaks the 2nd Law of Thermodynamics (or it does if you misinterpret the 2nd Law of Thermodynamics).
Happily, this misunderstanding is considered to be not supported by "better scientists" who consider the lapse rate. And this indeed is a 'better' consideration. But here Corbyn perhaps confuses the tropical 'hot spot' (which is caused by increased tropical rainfall transporting more latent up into the troposphere) with some CO2 effect. (The 'hot spot' results from a warmer tropics and not per se any enhanced GH-effect.) And he fails to address the reasons why there is difficulty detecting this tropical 'hot spot'. Indeed he brands it as a 'coldspot' that he seems to say is caused by "more CO2 & other GHGs" which cause a diurnal fluctuation in the IR "heat-exit height" to become greater and, due to the 4th-power in the SB equation, this causes cooling. Whether such a phenomenon extends beyond the tropics (thus globally more-than negating the 'hot spot') is not properly explained but, due to the lapse rate this phenomenon can apparently also negate "the original expected surface warming."
A first graphic box is presented with three unsubstantiated bullet points explaining "Why CO2 theory does not work" alongside two similar "apart from"s.
A second graphic box also titled "Why CO2 theory does not work" states:-
In the real atmosphere there are day/night temperature fluctuations (eg in upper atmosphere). They are larger with more CO₂ because CO₂ (infra red absorber / emitter) gains & loses heat easier than N₂ & O₂ and so enables all the air to adjust quicker.
This is a fundamentally different explanation from the previous fluctuation in IR "heat-exit height" explanation described earlier, and it is still wrong.
(A packet of air with X concentrations of CO2 will both emit and absorb an IR photons of quantity P. With absorb=emit, it is thus in equilibrium. Add CO2 so the concentration is doubled to 2X, and the emitting photons will double to 2P and the absorbed photons will also double to 2P so absorb=emit and the same equilibrium is maintained. The main result is that twice the level if IR emission has half the pathlength before absorption so at any point the IR flux remains unchanged. And CO2 does not "gain & lose heat easier than N₂ & O₂" when it remains thermally coupled to the N₂ & O₂. )
The remainder of this second graphic box on PDF page 9 is a little too confused to rebut with any confidence. A diurnal range of "about 5 or 6 deg" is given which is apparently a temperature range yet whatever “deg” means (presumably Kelvin), the bulk of the troposphere has a far smaller diurnal range than even 5ºF. The mechanism for the enhanced cooling from the "heat-exit height" is presented as due to a fluctuating temperature losing more heat (by radiating IR) than a constant temperature (which is true). A rather dodgy-looking equation is followed by the note "Detail subject under research" but no reference is given and three-years-on there is no sign of such "research."
And a third graphic box is shown on the next page also titled "Why CO2 theory does not work," this third such graphic mainly presenting a pair of images from Australian denialist David M. W. Evans who has his own SkS page of climate misinformation.
The thesis then turns to the proposition that it is not CO2 but solar forces that "rules climate temperature" with the dotted line on the graphic below described as such a ruling influence. It apparently shows how the "9.3yr lunar-nodal crossing & the full 22yr solar magnetic cycle" allegedly shift the jet stream and "many circulation patterns." The graphic's 60-yr periodicity is less than convincing,being fitted to US rather than global temperature which, when extended beyond the 1895-2008 period shows itself to be simple curve-fitting (eg the Berkeley Earth US temperature record 1820-2020 does not show it, even to a blind man). The graphic was presented by Corbyn at the Heartland Institute's 2009 conflab in NY in which Corbyn [audio] insists other findings demonstrate “something is going on” but why it is this graphic being reused in this 2019 thesis is not clear – perhaps the forecast of world temperature dropping to 1970s levels by 2030 is too evident on other slides he used in that Heartland presentation.
To support his thesis Corbyn mentions an alleged cover-up by the likes of the BBC in reporting only global warming when the 'true' data shows cooling, the reported support for all this Piers Corbyn craziness from oil companies who shy away only because they want to use AGW to "make higher profits" and how these AGW-inspired mitigation agendas are already directly responsible for needlessly killing "millions" annually.
The thesis ends with a challenge:-
It is for this reason that I, Piers Corbyn, challenge whoever is willing in Reading University or other appropriate institutions to a debate on the failed Global warming scam vs evidence-based science.
So I interpret the thesis as a "welcome to the lunatic asylum" message from Piers Corbyn.
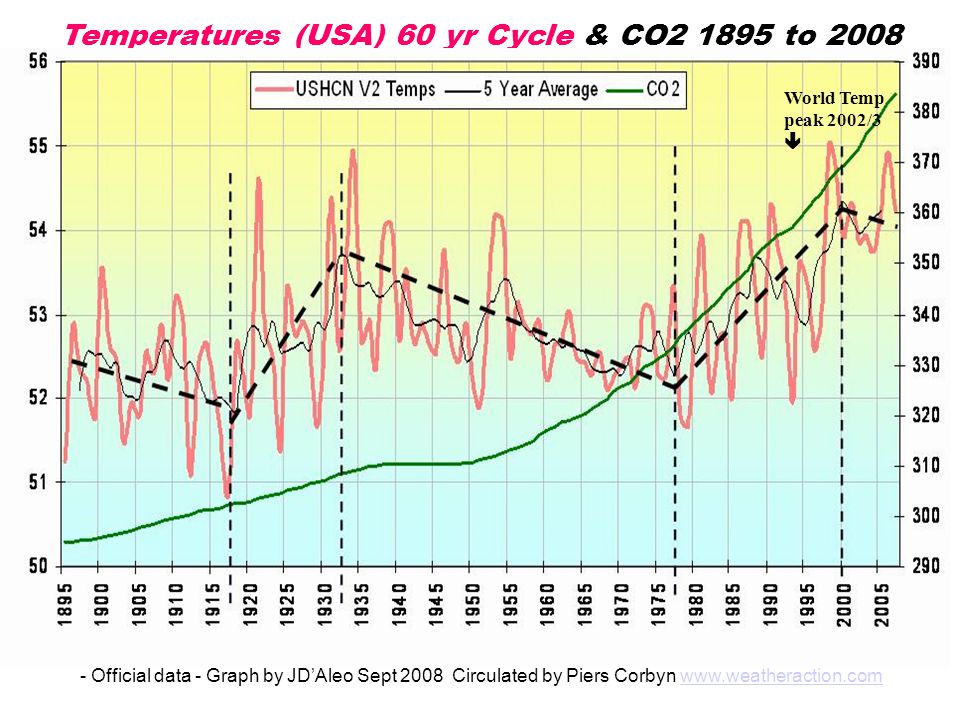
- CO2 effect is saturated
OldHickory at 17:21 PM on 6 August, 2022Where I believe the climate scientists are wrong is in their common response to climate change skeptics about why we need to be concerned about atmospheric CO2 when it is H2O vapor that is the much stronger GHG. Their answer to this question is the claim of a water vapor feedback (also called a CO2 "control knob") as explained in the rebuttal of Climate Myth 36. This only works, however, if the CO2 greenhouse effect isn't already saturated, and more CO2 actually does give a rise in temperature. Eventually, after adding enough CO2, the rise in temperature starts to decline when adding more CO2, and in fact approaches zero. At this point, we say the CO2 greenhouse effect is saturated. Well, it turns out that near the surface of the earth, this effect is highly saturated, and even doubling the CO2 concentration would not result in any signficant temperature change. This, of course, means that the "control knob" fails, and we need not worry about CO2 emissions, anthropogenic or otherwise.
- CO2 is just a trace gas
MA Rodger at 01:06 AM on 4 August, 2022Fixitsan @97 elsewhere,
You say "I struggle to find anyone who can offer a sensible explanation why it is, that if 0.04% of the atmosphere consisting of CO2 traps significant heat, enough to warm the planet an estimated 1 Celsius in 1 century, why is CO2 at higher concentrations not used more often (or even ever) in common or garden insulation."
99.95% of the Earth's dry atmosphere comprises N2, O2 or Ar but they are transparent to IR. It requires a more complicated molecule to absorb or emit IR at the temperatures found in the Earth's atmosphere. So any IR passing through the atmosphere will only be absorbed by those more-complicated molecules and IR will only be emitted these same molecules.
And this is only at certain wavelengths which equate to the various wobbles that can be induced in those molecules. Of these, in the dry atmosphere, the big daddy of the IR-reacting molecules is CO2 which acts at 15 microns wavelength (666 cm^-1 wavenumber). This effect is responsible for a big bite seen in the spectrum of IR emitted out into space.

Thus about 20% of the Earthly IR has to negotiate the CO2 in the atmosphere and this mechanism directly provides perhaps 7ºC of the full 33ºC pre-ndustrial greenhouse effect.
The important variable is the altitude at which the CO2 emits the 15 micron IR out into space, and specifically the temperature of that altitude. The hotter it is, the more IR is lost to space, helping to cool the planet. But a colder gases emits less and that then insulates the planet better.
Now, if the upper atmosphere at the altitudes at which CO2 allows this 15 micron IR to escape into space were really really really cold, you could double that direct 7ºC CO2 effect by blocking all the IR in that band. But you need that really really really cold temperature to achieve it.
So if you;re after "common or garden insulation", if you want to keep something warm by half-a-dozen degrees or more, it is far easier covering it with a more conventional insulating barrier.
As far as anthropogenic global warming goes, filling the atmosphere with extra CO2 concentrations results in the space-bound IR in the 15 micron waveband being emitted at higher altitudes and, because those higher altitudes have a lower temperature, less IR will this be emitted in the 15 micron waveband out into space adding to the insulating greenhouse effect.
- Taking the Temperature: a dispatch from the UK
nigelj at 11:44 AM on 26 July, 2022Fixitsan @46
"I wasn't talking about flat period of global temperatures mid last century, but instead a flat temperature in the UK from 1910 and proceding into the 1990s, which is 70% - 80% of the last century,...."
Ok, but I was just trying to make the point there are almost certainly logical explanations for that long flat period. So for example the first link I posted discussed how different regions warm at different rates, - and would also have different timing of the warming. I havent looked at mid Englands climate history and what factors have driven it, but there is bound to be some local or regional factor or combination of factors that explains the unusually long flat period of temperatures, despite rising CO2. And obviously a large part of that flat period is explained by sulphate aerosols (from about 1945 - 1980).
I agree quoting that particular temperature record could get you labelled a denier. Not sure what the solution to that is other than to say I don't personally dwell on very local temperature records like that, because its incredibly obvious that in our complex climate system there will be a lot of local variation. I'm mostly just interested in the global average trend and whats happening where I live myself. Local variation doesnt bother me because anyone with more than half a brain knows that doesn't represent the global trend and there are dozens of plausible reasons consistent with an anthropogenic warming trend.
And I agree the media sometimes exaggerate climate change. What can you do about that? I've complained to my local media for both exaggerating certain things, and and playing down other climate issues. It's the second problem thats a bit more concerning.
- The Climate Shell Game
jan at 00:03 AM on 31 March, 2022@Eclectic #80
This was the base of my hypothesis in early 2021 - copy/paste from document No. 2 mentioned in my last post.
All the emissions defined here are Emissions from Fossil fuels only.
---------------------
2010 Global CO2 fossil fuels emissions: 33 971 Mt CO2 (EDGAR-AR5 model)
In model pathways with no or limited overshoot of 1.5C, global net anthropogenic CO2 emissions decline by about 45% from 2010 levels by 2030 (40 60% interquartile range), reaching net zero around 2050 (2045 2055 interquartile range). .... based on IPCC AR5.
2030 goal = 33 971- 45% (15 287) = 18 684 Mt CO2 in 2030
the value: 15 287 Mt CO2 is slightly over of equivalent of the entire: China + US + India emissions (TOP3 emission providers in the world in 2019)
or
179% of 2019 Total emissions from the rest of the TOP20 countries in the world are responsible for 81% of CO2 emissions. Remember the TOP20 label for all the later considerations in this document.
So looking for solutions in the rest of the 188 countries, which generate only 19% of CO2 emissions, is nice, but it has a very small impact on achieving the goals defined in the IPCC AR5.
2019 Global CO2 emissions: 38 017 Mt CO2, then till 2030 we need to decline the emissions by about 50% from 2019 til 2030 (reach the 2010 target), and reaching net zero around 2050.
The annual (linear) declination step must be 1 567 MT CO2 = entire Japan+Turkey. Each year. It's supposed to go down, but on the contrary, it's going up. Every year.
With the existing approach to emissions-reducing, we will achieve only 50% reduction from 2020 to 2050.
This means that we will be outside any safe borders as early as 2037, defined by the IPCC as Pathways with higher overshoot. At the end of 2025, this scenario will either be confirmed or refuted.
In global numbers, we should reach less than 30GTin 2025 if we are to adhere to the IPCC predictions to keep warming up to 1.5C.
(Note from 2022: just thanks to the pandemic we get 35.96Gt in 2020, but in 2021 we were back in increase).
However, this means that the TOP20 countries in the world must reduce their emissions by at least 8GT = 27% of their cumulative value from 2019.
Because the rest of the 188 countries have total CO2 emissions of about 7Gt – so there isn’t a doable plan to ask them for a 100% reduction by 2030 (even for 50%).
Just for your imagination, the 27% decrease from the TOP20 countries:
- it is 71% equivalent of their cumulative Power production emissions
- it is 119% equivalent of their cumulative Industry emissions
- it is 151% equivalent of their cumulative Transport emissions ........................ (Note: as you can see no way for EVs to reach it)
- it is 98% equivalent of their cumulative Transport and Buildings emissions
- it is 125% equivalent of their cumulative Buildings and Others (Agricultural, ...) emissions
Till the end of 2025, we only have 4 years and 7 months remaining. (Note: the document is from 2021)
The first bad sign of discomfort will be 34.5Gt at the end of 2025. According to the AR5 report, we need less than 30Gt in 2025 and less than 20Gt in 2030.
I'll be really happy if someone refutes this plan.
Otherwise, it won't be good at all.
Pareto principle:
20 (10%) countries are responsible for 81% of CO2 emissions. ...... here we need to try to find major reduction scenarios.
- The Climate Shell Game
jan at 18:55 PM on 30 March, 2022@Bob Loblaw #77
I'm not a fan of Ivar Giaever (Climate change opinions)
------------------------------------------
@nigelj @Eclectic and others
100% agree - that the communication here is difficult. From any aspects.
If I may suggest you, try to study the documents I have proposed (see a short list below), which will help you understand that I am not taking numbers out of my pocket here, but that there is serious research behind it. I describe the documents through the mutual stories that interact. There is a lot of visualization because the clean text is an outdated form of interpretation.
I repeat, this problem is so complex that it cannot be described by keywords. So if Skeptical Science is really about Science, then we need to get to a state of understanding at least in the basic domains. My documents will help you with that. Subsequently, we can resume the discussion on specific issues. Based on specific sources and data. Not just based on opinions.
I will be happy to explain the basic principles of the energy lifecycle, but - this SkS forum = an offline and technologically outdated system will complicate it. That needs to be said. I admit that I am not a great writer, such as Dr. Greger, who can enchant the masses only through keywords. This, on the other hand, has a negative impact - because it has created a religion in the field of what is now called Nutrition Science. And he doesn't have to prove anything to his audience.
If you have the interest to get some deeper answers mentioned here, you can start with this document reading list in the order (pls download them because Academia.edu portal has for preview just low res extracts):
1. GHG emissions problems in a dark box - Part 05 - Population, Land, Food, Emissions and data disaster
In this document, I address the impact of FOOD systems on anthropogenic GHG emissions. I was prompted to analyze several polarizing articles that appeared to be scientific, but they had little in common as is customary with science. It creates such a fake, dare I say, a manipulative area in which the masses are lost because they cannot understand the depth of the problem.
The emission issue associated with Food systems cannot be declared with a single number that has zero significance. The knowledge that we are composed of approximately 7 x 1027 atoms does not alone allow us to compose a functional human body.
Also, being aware that Food systems cause 1/3 of GHG emissions can't help us understand the core of the problem. It's just a number without expressing complex relationships. This problem is complex, and each new interaction confuses the situation even more.
2. GHG [CO2] emissions problem in a dark box - 1st part of the Global warming series
The purpose of this analysis and consideration is to offer a clearer report on how the current efforts to reduce GHG are failing This failure is that much bigger because at a mathematical
level it is not possible to secure the promises of individual countries I hope this will help open your eyes I'm afraid people are too contempt with what someone has drawn Now it's time for a cold shower.
3. GHG CO2 emissions - Part 01 China Power production, race to zero analysis
Because China is the main indicator of our worldwide race to zero from all the possible points. Chinese Power industry emissions share 12% of Global CO2 emissions (2019), source
by EDGAR . The Second challenge is a statement of president Xi Jinping at the General Debate of the 75th Session of The United Nations General Assembly: “We aim to have CO2 emissions peak before 2030 and achieve carbon neutrality before Source So the challenge is accepted, there is a simple hypothesis:
Is it doable to achieve CO2 emissions peak before 2030 and achieve the carbon neutrality before 2060 in China?
The answer is:
“No” for the emission peak before 2030. Technically and mathematically not doable. Even with totally frozen industry.
“No” for the carbon neutrality before 2060. Technically and mathematically not doable. Even when China will freeze its industry for the next 39 years it’s questionable.
The document focuses mainly on the Power Production segment from the CO2 emissions point of view. All the interpretations are again based on publicly available data, including references to them. So everyone can check my interpretations based on free access to data.
4. China Power production CO2 emissions issue in single page
Single page conclusion how is impossible to reach Carbon Neutral 2060 Chinese plan by their current attitude
5. GHG CO2 - Part 02 - Transport race to zero emissions analysis in single page
Single page definition of the 20% issue focus on the 80% of emissions decrease
- 2022 SkS Weekly Climate Change & Global Warming News Roundup #7
Philippe Chantreau at 05:56 AM on 28 February, 2022I thought that n factor looked funny.
I also thought that the publication looked suspicious. This is not a paper that I would ever had paid attention to, regardless of what it said.
Explanation: After following this so-called debate for 20 years, digging in the "skeptics" (a qualificative they truly don't deserve) arguments and examining what is actually in the science litterature to the best extent of my abilities, I reached the conclusion that the weight of the scientific evidence points, without contest, to CO2 caused anthropogenic warming.
However, that does not exonerate me from being critical toward any piece of information. If something as dubious, as low quality, poorly thought out as Coe, Fabinski & Wiegleb came along in a publication with all the hallmarks of a pseudo-journal, but with a conclusion reinforcing the one I already reached, I would dismiss it as junk because, well, it is.
That is what being skeptical consists of.
I'm having serious doubts that Santalives is putting forth a sincere effort to evaluate information.
- CO2 emissions do not correlate with CO2 concentration
MA Rodger at 21:10 PM on 15 February, 2022Eclectic @14,
I would be more specific than describe Skrable et al (2022) 'World Atmospheric CO2, Its 14C Specific Activity, Non-fossil Component, Anthropogenic Fossil Component, and Emissions (1750–2018)' simply as "garbage". It is 'academically dysfunctional'.
Skrable et al tell us that they are carrying out analysis that has so far been overlooked by science saying:-
Despite the lack of knowledge of the components of C(t)**, claims have been made in the scientific literature (CSIRO 2014; Rubino et al. 2013, 2019) that all or most of the increase in C(t) since 1800 has been due to the anthropogenic fossil component, CF(t). [**C(t) is the atmospheric CO2 concentration at time-t.]
These references are made bizarrely to an Australian Bureau of Meteorology 'State of the Climate 2014' report, and also to two papers (here & here) which use ice cores and analysis of 13C to demonstrate the anthropogenic impact to AD1900. For some reason with this referencing, Skrable et al use a URL to a WMO GHG Bulletin which does provide the 14C analysis Skrable et al are saying hasn't been done (although Skrable et al specifically talk only of analysis of atmospheric 14C).
And the go-to place for any researcher venturing into the world of climatology is the IPCC Assessment Reports and AR6 Chapter 5 Section 5.2.1.2 is far from silent on the matter, including analyses of 14C in the atmosphere, saying:-
These three lines of evidence** confirm unambiguously that the atmospheric increase of CO2 is due to an oxidative process (i.e. combustion). Fourth, measurements of radiocarbon (14C–CO2) at sites around the world (Levin et al., 2010; Graven et al., 2017; Turnbull et al., 2017) show a continued long-term decrease in the 14C/12C ratio. Fossil fuels are devoid of 14C and therefore fossil-fuelderived CO2 additions decrease the atmospheric 14C/12C ratio (Suess, 1955) [**(i) The timing of rising CO2 at the South Pole relative to elsewhere (ii) The 13C analyses (iii) The declining O2/CO2 ratio.]
It is entirely inept of Skrable et al to ignore such obvious literature which they attempt to overturn.
- CO2 emissions do not correlate with CO2 concentration
Eclectic at 12:07 PM on 15 February, 2022JimCA @13 ,
there is no need for rebuttal of that paper. It is garbage.
The authors Skrable et al., have produced a nonsense paper, which (as you say) has been published in an entirely inappropriate journal for the subject matter of the atmosphere & carbon cycle. Cruelty to the poor old reviewers, having this dropped onto their plate, and being pressured to pass it through.
Kenneth Skrable has qualifications in the field of radioactivity, I gather.
Somehow the authors have claimed a residual [atmospheric CO2] anthropogenic level of 12% over the 1750 - 2018 period . . . "much too low to be the cause of global warming". The authors seem oblivious to the mountain of evidence that they are wrong about climate science. Additionally, they handwave away the 13-Carbon atmospheric evidence.
I have skimmed through the paper, but have not bothered to look in detail at their 14-Carbon arguments ~ no more would I look in detail at the calculations of any authors who claim to have invented a Perpetual Motion machine.
Because when someone gets nonsense results, you know that there must be major faulty logic somewhere in his/her workings. It is just not worth the time to chase down the error/errors.
Probably, Skrable & colleagues are using some form of motivated reasoning where they delude themselves via re-defining terms to suit themselves . . . while at the same time ignoring several Elephants in the Room.
I suspect the Skrable et al., paper will make a minor splash among Denialists . . . and then soon enough be put on their back burner, along with all the other nonsense calculations claiming 3% anthropogenic CO2 . . . or 4% . . . or 12% . . . or 23% . . . or whatever. And then, at different occasions (despite the shameless contradictions) they will handwave at a single one of these figures, for rhetorical effect.
How is it that otherwise-intelligent people (even the odd Nobel Laureate) get to produce such nonsense? The human brain is a marvel !
- There is no consensus
One Planet Only Forever at 14:03 PM on 18 January, 2022In response to Star-affinity @#900:
Comprehensive responses to the question about the magnitude of consensus regarding human induced global warming and resulting climate changes have been provided by others.
My initial supplement is: Rather than debating the magnitude of consensus for the theory that “significant anthropogenic climate change is occurring” ask for an evaluation of the level of consensus for the theory that “No anthropogenic climate change impacts are occurring”.
Increased atmospheric CO2 is unquestionably due to human activity. And increased CO2, along with other human impacts, unquestionably produce global warming and significant, hard to precisely identify, but unquestionably harmful climate changes from the conditions that human civilization developed in through the past several thousand years.
However, there is more to consider. It is important to be aligned on the context/objectives for a 'debate'. Without objective alignment the result can be a waste of time.
My primary objective is to try to help develop a sustainable improving future for humanity. Increased awareness and improved understanding of what is going on is essential to sustainable improvement of the future of humanity. And increased awareness of what is harmful and learning how to limit harm done is key, with climate change impacts of human activity being a significant sub-set of concern.
Science questions things with the objective of increasing awareness and improving the understanding of what is really going on in a way that develops “improved common sense”. It is important for that “common sense” to help improve the future of humanity.
Note that not all science or application of science is helpful. Misleading marketing is a good example of harmful scientific investigation and application. It can develop cult-like groups of believers with nonsense as “their common sense”.
Every individual’s perception of what is going on is their reality. All understandings of what is going on are individual beliefs. And everyone has biases regarding what they learn. Everyone develops their understanding based on their experiences in the socioeconomic-political environment they grow up in. In many cases people develop a fondness for, or addiction to, harmful unsustainable developments (systems and beliefs) and resist correction of harm done that they benefit from or hope to benefit from.
Getting alignment on the objective of “reducing harm done to the future of humanity and developing lasting improvements for humanity” is essential. Without that alignment the discussion can be a competition with the different sides having different sets of rules about how the game is played or judged/refereed. That can be a waste of time.
Debating details about the level of consensus of understanding that human activity is causing harmful rapid climate change impacts is one of those waste of time games. Establishing that there is significant consensus is important. However, questioning a well developed understanding of the level of consensus is a game being played to delay and distract from the important discussions of how to identify and most effectively limit the harmful impacts of the many developed unsustainable activities that cause climate change impacts.
One of the most harmful activities is misleading marketing. Always keep in mind that popularity and profitability have no reason to be aligned with limiting harm done. They are measures that are indifferent to harm done . Being more popular or profitable does not mean something is less harmful. In fact, getting away with being more harmful or misleading can be a competitive advantage in games of popularity and profit. And being more popular and profitable can make harmful beliefs and actions harder to correct (the persistence of climate science denial is one of many cases proving that point).
- Big numbers – dollars and institutions – behind divestments from fossil fuels
Bob Loblaw at 06:03 AM on 16 January, 2022Hal @ 1:
Ditto what Doug said @ 2. Your statement ".. but assume the contrubution of fossil fuels to building the blanket was very small." is virtually certainly incorrect.
Yet another pointer to other posts here at Skeptical Science:
Climate Change Cluedo: Anthropogenic CO2
Short version: the atmospheric increase is half of what has been spewed into the atmosphere by burning fossil fuels, and the only reason it hasn't all stayed in the atmosphere is because of natural sinks absorbing the other half. The contribution from fossil fuels is not small.
- How weather forecasts can spark a new kind of extreme-event attribution
Eclectic at 22:59 PM on 15 January, 2022Wilddouglascounty , your analogy with steroids is a good one. (Though technically an athlete can achieve "steroid performance" via scientific strength-training ~ it just takes a little longer and requires more willpower.) And apart from Thatcher, our politicians tend to lead from behind . . . excepting for just their rhetoric, as shown in international conferences!
Bob Loblaw points out that the terms CC (Climate Change) and GW (Global Warming) have both been in use for many decades. CC from the 1950's and GW from the 1980's at least.
Always it comes back to what the public - the voters - perceive. They seem moderately happy to use the terms CC and GW in their thinking about the anthropogenic CO2 problem. I would worry that your proposal for using a third term might well be counter-productive, with some portion of the population being irritated by a sense of "constant revolution" in climate terminology.
Using a broad-brush classification, people can be divided into 4 categories :-
A/ the cognoscenti/activists, who see the AGW problem for what it is ~ regardless of terminologies used.
B/ the general public, who are moderately aware of the AGW issue, and who don't really care whether it's called CC or GW.
C/ those who, while not actively hostile to broad socioeconomic changes required in solving the AGW problem ~ are nevertheless a bit reluctant to suffer mild inconvenience, or who feel unease about prospective changes. And they also don't care whether it is called CC or GW.
D/ the Denialists, who oppose anything and everything AGW-related. They do definitely care about the terminology used ~ and they tend to froth at the mouth at any flip-flop in terms used, and they create strawman arguments regarding "the science obviously not being settled". (Among other things.)
For my sins, I often look through the articles and comments at the WattsUpWithThat blogsite. (It doesn't take long to skim through the day's effusions, provided that you only pause to read comments - and immediate replies to - the handful of commenters who are scientifically well-informed and intellectually sane.)
Sadly, the great generality of WUWT commenters are like a group of tetchy backyard dogs. They launch into prolonged barking at even the slightest disturbance ~ at someone's door closing; at a pedestrian walking by; at a bird chirping in a tree; at a vehicle going past. Perhaps they like barking, or they are hungry, or their emotional needs are not being met.
- Global CO2 emissions have been flat for a decade, new data reveals
MA Rodger at 21:21 PM on 25 November, 2021pattimer @1,
The Global Carbon Project correction to FF+LUC anthropogenic CO2 emissions over the last decade is actually very minor. I compared the before-&-after numbers when first published and for that period (from memory) OLS showed they changed from +75Mt(C)/yr to +25Mt(C)/yr. (The increase in emissions had been running at about +200Mt/yr through the preceding two decades.) So an already quite-flat emissions rate through the last decade is revised somewhat more flat. Given the wobbles in the draw-down of emissions our into the biosphere, the calculation of Af is a long-term thing. (It averages 44.3% 1959-2020 with a 2sd variation of +/-25.9%.) So the impact of the adjustment on Af is insignificant. For 2019 the single year figure previously 48.7% becomes 49.1%.
Af will get interesting when we get round to reducing our collective CO2 emissions. The draw-down of CO2 is not a single-year-emissions thing as suggested by the Af but the draw-down of our accumulated CO2 emissions over the decades (& eventually centuries). Thus the 2.99Gt(C) ocean draw-down and 2.92Gt(C) biosphere draw-down estimated by GCP for 2020 would hardily have budged if we had halved emissions in 2020. But if emissions had halved from 10.38Gt(C) to to 5.19Gt(C), the atmospheric levels would have dropped and Af would have turned negative.
- SkS Analogy 25 - Emissions vs Accumulation
MA Rodger at 01:51 AM on 2 November, 2021cph @9,
While it is correct that H2O does the heavy lifting when it comes to the GH-effect, H2O is a vey lazy gas and requires the presence of long-lived GHGs to get it doing any work at all. Thus it is the long-lived GHGs, and particularly CO2 that defines the temperature-boost of the planet's GH-effect.
I'm not at all happy with your assessment of the GH-increase being caused by "cow & sheep livestock." Combining your numbers, that would suggest a 20% contribution which seem miles high. The OurWorldInData graphic below suggests just 5.8% from livestock.
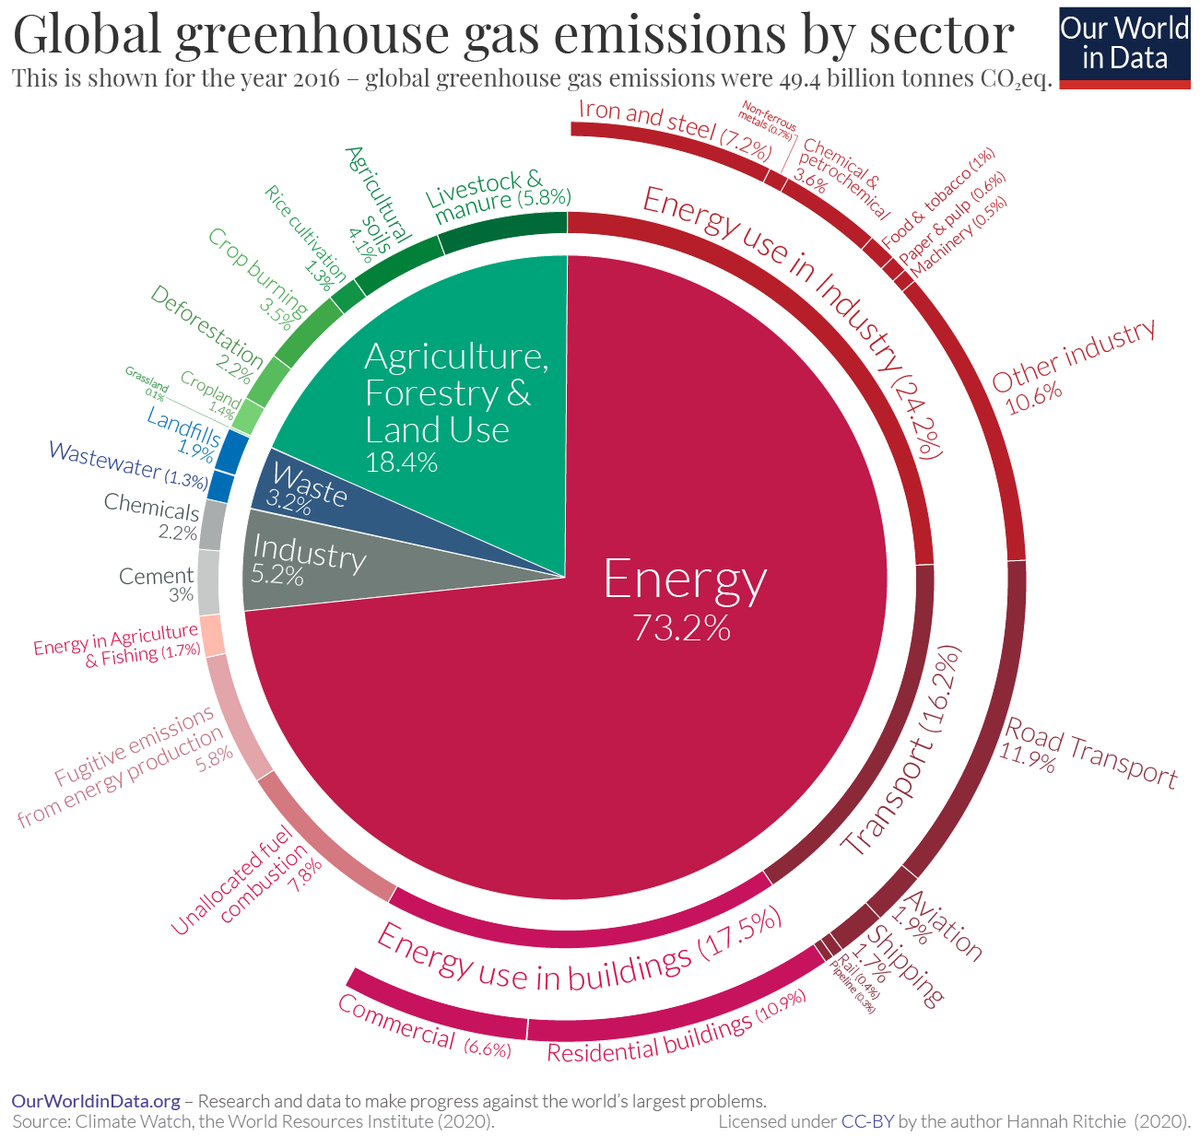
Evan @5,
Beyond their source, I don't see reason to account for the anthropogenic climate forcing in any way other than the usual bar charts presented by say IPCC AR6 Fig SPM.2 below. Thus the talk of "GHG grade" or "quality" isn't advancing any analysis that I can see. CH4 from livestock is simply a climate forcing as it has elevated global CH4.

swampfoxh @1,
The CO2 breathed out by livestock is a component of that part of the carbon cycle represented by Primary Production and one of the fluxes shown in the graphic in the OP above, a carbon flux assessed by Haberl et al (2007) as having been reduced due to humanity (not just since 1750AD) by 10%, this surely through deforestation, forests being far better at Primary Production (and as a store of carbon) than a field of cows.
- SkS Analogy 25 - Emissions vs Accumulation
cph at 21:53 PM on 1 November, 2021evan@5 -"We need to be concerned with more than carbon cycling."
OK. - CO2 & CH4 are the second and third most important GHG - but what do you think of H2O as the most strongest one ?
nigelj@4 - "The whole process looks carbon neutral to me."
CH4 emissions, which are reduced just as quickly as they arise, would be neutral. - ! That is certainly not the case.
Cows and sheep livestock generate more greenhouse gases as measured in CO2 equivalents than the entire transportation sector. Livestock accounts for 9 percent of anthropogenic CO2, 65 percent of anthropogenic nitrous oxide and 37 percent of anthropogenic methane.
But these are not the only CH4 emitters:
en.wikipedia.org/wiki/Atmospheric_methane#Methane_emissions_monitoring
Natural and anthropogenic methane sources, according to the NASA Goddard Institute for Space Studies
- Volcanoes emit more CO2 than humans
Daniel Bailey at 07:53 AM on 13 August, 2021Here's what the peer-reviewed published literature shows, that humans produce 100x more CO2 than all Earth's volcanoes combined:
- Just two-one thousandths* of 1% of Earth's total carbon—about 43,500 gigatonnes (Gt)—is above surface in the oceans, on land, and in the atmosphere. The rest is subsurface, including the crust, mantle and core—an estimated 1.85 billion Gt in all.
- CO2 out-gassed to the atmosphere and oceans today from volcanoes and other magmatically active regions is estimated at 280 to 360 million tonnes (0.28 to 0.36 Gt) per year, including that released into the oceans from mid-ocean ridges.
- Humanity’s annual carbon emissions through the burning of fossil fuels and forests, etc., are 40 to 100 times greater than all volcanic emissions.
- Earth’s deep carbon cycle through deep time reveals balanced, long-term stability of atmospheric CO2, punctuated by large disturbances, including immense, catastrophic releases of magma that occurred at least five times in the past 500 million years. During these events, huge volumes of carbon were outgassed, leading to a warmer atmosphere, acidified oceans, and mass extinctions.
- Similarly, a giant meteor impact 66 million years ago, the Chicxulub bolide strike on Mexico’s Yucatan peninsula, released between 425 and 1,400 Gt of CO2, rapidly warmed the planet and coincided with the mass (>75%) extinction of plants and animals—including the dinosaurs. Over the past 100 years, emissions from anthropogenic activities such as burning fossil fuels have been 40 to 100 times greater than our planet’s geologic carbon emissions.
- A shift in the composition of volcanic gases from smelly (akin to burnt matches) sulphur dioxide (SO2) to a gas richer in odorless, colorless CO2 can be sniffed out by monitoring stations or drones to forewarn of an eruption—sometimes hours, sometimes months in advance. Eruption early warning systems with real-time monitoring are moving ahead to exploit the CO2 to SO2 ratio discovery, first recognized with certainty in 2014.
Regarding the release of CO2 from volcanoes:
"Earth’s total annual out-gassing of CO2 via volcanoes and through other geological processes such as the heating of limestone in mountain belts is newly estimated at roughly 300 to 400 million metric tonnes (0.3 to 0.4 Gt).
Volcanoes and volcanic regions alone outgas an estimated 280–360 million tonnes (0.28 to 0.36 Gt) of CO2 per year. This includes the CO2 contribution from active volcanic vents, from the diffuse, widespread release of CO2 through soils, faults, and fractures in volcanic regions, volcanic lakes, and from the mid-ocean ridge system."
https://www.sciencealert.com/humans-produce-100x-more-co2-than-all-volcanoes-combined
https://deepcarbon.net/scientists-quantify-global-volcanic-co2-venting-estimate-total-carbon-earth
http://elementsmagazine.org/past-issues/catastrophic-perturbations-deep-carbon-cycle/
Kelemen and Manning 2015 - Reevaluating carbon fluxes in subduction zones, what goes down, mostly comes up
de Moor et al 2016 - Short-period volcanic gas precursors to phreatic eruptions: Insights from Poás Volcano, Costa Rica
McCormick et al 2016 - Observing eruptions of gas-rich, compressible magmas from space
Johansson et al 2018 - The Interplay Between the Eruption and Weathering of Large Igneous Provinces and the Deep‐Time Carbon Cycle
Tamburello et al 2018 - Global-scale control of extensional tectonics on CO2 earth degassing
Lee et al 2019 - A Framework for Understanding Whole-Earth Carbon Cycling
Black and Gibson 2019 - Deep Carbon and the Life Cycle of Large Igneous Provinces
Kamber and Petrus 2019 - The Influence of Large Bolide Impacts on Earth’s Carbon Cycle
"pCO2 is a result of the balance between the rate of CO2 inputs through magmatic/metamorphic degassing and the rates of carbon removal via silicate weathering and organic carbon burial."
McKenzie and Hehe Jiang 2019 - Earth’s Outgassing and Climatic Transitions_The Slow Burn Towards Environmental Catastrophes
Mikhail and Furi 2019 - On the Origins and Evolution of Earth’s Carbon
Schobben et al 2019 - Interpreting the Carbon Isotope Record of Mass Extinctions
Suarez et al 2019 - Earth Catastrophes and Their Impact on the Carbon Cycle
Werner et al 2019 - Carbon Dioxide Emissions from Subaerial Volcanic Regions_Two Decades in Review
"All studies to date of global volcanic carbon dioxide emissions indicate that present-day subaerial and submarine volcanoes release less than a percent of the carbon dioxide released currently by human activities. "
- Volcanoes emit more CO2 than humans
scaddenp at 07:32 AM on 13 August, 2021jon_zz09 - the killer for that argument is the volcanic CO2 has very different C isotopic signature to that fossil fuels. The changes in atmospheric C isotopic composition are consistant with FF source. Furthermore, the studies referenced in this article (and see more here) account for submarine volcanoes. While estimation is difficult even the high end of the estimates is small compared to FF emissions. Finally, there is no evidence of an increase in volcanism as Rob says ( see here from Global Volcanism Program).
- CO2 lags temperature
Ducked at 00:13 AM on 12 June, 2021I don't have much of a problem with CO2 lagging behind temperature at the end of a glacial period. It isn't all that surprising and the explanations are convincing.
That CO2 still lags behind temperature (though apparently by only a matter of months rather than hundreds of years,"Changes in carbon dioxide content lag those in temperature by five months."[1} is more of a puzzle to me and I havn't seen an explanation for it yet.
I'm sure there is one that wont require denial of recent anthropogenic climate change, but I don't know what it is.
This enquiry arose because I'm teaching using an online resource that includes the following question for students
https://authoring.concord.org/sequences/47/activities/282/pages/1753/3a7c351a-50c0-4646-8824-e2eef8f53762
5. Using Models To Make Predictions
"Why is there a lag between changes in CO2 levels and temperature?
(Hint: Remember that there are many reservoirs for carbon dioxide. Where can carbon dioxide be stored when the temperature is low?)"
I find this question unclear (Do they mean changes in atmospheric CO2, in which case the "hint" doesn't appear to make any sense?) and it implies that CO2 leads temperature change, which wasn't the case in 1990
{1} Kuo, C., Lindberg, C. & Thomson, D. Coherence established between atmospheric carbon dioxide and global temperature. Nature 343, 709–714 (1990). https://doi.org/10.1038/343709a0
- The New Climate War by Michael E. Mann - our reviews
Micawber at 03:04 AM on 8 June, 2021Michael Mann is correct in thinking that our information is totally controlled by media giants.
Scientists are charged to read their own publications and “peer reviewers” stack the peers so that no new ideas can get through. Rarely if ever do you find references to key earlier work by retired or deceased scientists. I give a few examples.
Microsoft Office still uses years beginning 1 January 1900. They charge for updates but still have a fatally flawed program. Why is he allowed to pose as a scientist and innovator?
Even David Keeling was nearly prevented from continuing verification of CO2 infrared heat blankets by rigged peer review. He gives a vivid account in his autobiographical review:
Keeling, C. D., 1998, Rewards and Penalties of Monitoring the Earth, Ann Rev. Energy Env, 23(1), 25-82, doi:10.1038/nature105981.
Blair Kinsman had earlier shown how the misuse of statistics and inability to take daily validation data could mislead to wrong conclusion. Unlike in lab experiments geophysical data once not taken cannot be repeated at will. This has happened with our gross neglect of near surface ocean data where is located most anthropogenic heat.
Kinsman, B. 1957, Proper and improper use of statistics in geophysics, Tellus 9(3), 408-418, doi:10.1111/j.2153-3490.1957.tb01897.x
Free access sci-hub.do/10.1111/j.2153-3490.1957.tb01897.x
"The dangers facing the earth's ecosystems are well known and the subject of great concern at all levels. Climate change is high on the list. But there is an underlying and associated cause. Overpopulation."
Sir David Attenborough https://www.youtube.com/watch?v=JRPmLWYbUqA
"Can you think of any problem in any area of human endeavor on any scale, from microscopic to global, whose long-term solution is in any demonstrable way aided, assisted, or advanced by further increases in population, locally, nationally, or globally?"
"The Greatest Shortcoming of the Human Race is our Inability to Understand the Exponential Function" Bartlett, Albert A., 1979
www.youtube.com › watch › v=F8ZJCtL6bPs
Wherever humans are involved we HAVE the Weimar greed equation. Better snap up fish stocks, or oil or whatever before someone else grabs it.
Graham Hancock has beeN ridiculed for suggesting there was a great civilisation as early as 400,000 years ago. Yet there are pyramids dated 130,000 years old in the Mississippi basin. Genetics link Oceania to S America. The compact nature of the Antikythera Clock suggest it was used for navigation. Why else would one cram a complete astronomical clock into a case the size of a sextant? The clock could predict lunar eclipses 78 years ahead as well as their colour. Many wheels have prime number of gears to give highly accurate astronomical times. There were even wheels for the Olympic and other games. Silicon valley may think of it as a mechanism or computer. But it was a clock long before Harrison’s. Such sophistication suggests many years development. It clearly could not have sprung up 350BC, any more than modern printed circuits could have been envisioned in 1957.
Sealevels averaged 50m below present in prehistory before 1750AD. There were many rich landmasses where merchant sailors could establish empires. They were wiped out by catastrophic sea level rise both cyclical and from asteroid impacts. We are at the top of earth’s remaining peaks.
https://www.youtube.com/watch?v=bAqqA3fMwI8
Melting ice of Greenland and Antarctica is proceedING exponentially leading to rapidly rising sealevels, floods and storms as well depleted fish stocks.
Waters around Faeroes does not get cold enough for cod and halibut to breed. They need to be at least 10 years old before they start. (netflix seaspiracy)
The north sea herring disappeared before 1950s, the Newfoundland cod in the 1980s. Gunboat diplomacy could not save them.
What do you think we should do? Perhaps include the equatorial undercurrent in climate models?
There has been too much about hot air instead of hot water.
I have not heard Dr Mann mention this. There are none so blind as those who will not see.
There needs to be a real focus on what the great oceans are telling us. - 2021 SkS Weekly Climate Change & Global Warming News Roundup #19
MA Rodger at 01:43 AM on 12 May, 2021Jim Hunt @12,
I think you missed a trick in your interchange with Judy @ClimateEtc on the subject of Koonin & Arctic Sea Ice. Judy chips in "If you think that the consensus is that this decline is 100% caused by AGW, then you disagree with the IPCC SROCC report (which estimates ~50%). Very weak base for criticizing Koonin."
But come on, Judy is just flying arround on Occam's broom.
So I think the reply should be "Judy, have you read IPCC SROCC 3.2.1.1.1 and the references it bases that "est ~50%" on? I ask because if you had, I think you would be less quick with your "very weak base" comment."
IPCC SROCC 3.2.1.1.1 says "Approximately half of the observed Arctic summer sea ice loss is driven by increased concentrations of atmospheric greenhouse gases, with the remainder attributed to internal climate variability (Kay et al., 2011; Notz and Marotzke, 2012) (medium confidence). ... A lack of complete process understanding limits a more definitive differentiation between anthropogenic versus internal drivers of summer Arctic sea ice loss (Serreze et al., 2016; Ding et al., 2017; Meehl et al., 2018)."
So at first cut, the ~50% value appears to be based on some rather old references. Of these references, Kay et al (2011) which provides a 40%-50% value says "The conclusions we draw are only as reliable as the underlying climate model processes," which isn't the sort of finding you would lay great store by. Their conclusion is "Thus, consistent with early studies, this [study] should be seen as another reminder of the need to account for internal variability in the assessment of recent sea ice loss and the fidelity of global climate model simulations." It is thus not a reliable quantification of the contribution of internal variability.
And Notz and Marotzke (2012) basically says that internal variability is not the cause of the post-1979 trend in SIE decline. "1. Internal variability as estimated from pre-satellite observations cannot explain the recent retreat of Arctic sea ice. 2. The observational record shows no signs of self-acceleration and hence no signs of a possible ‘tipping’. 3. The satellite record is well described by a linear trend onto which internal variability is superimposed. The magnitude of this superimposed internal variability is very similar to that of the pre-satellite record. 4. The most likely explanation for the linear trend during the satellite era from 1979 onwards is the almost linear increase in CO2 concentration during that period."
Of the later references, Serreze et al (2015) says nothing on the subject,
Ding et al (2017) is saying the internal variability is being driven by sea ice loss in a two-way street [so this is AGW creating internal variability] and comes up wiht a 30%-50% value, while Meehl et al (2018) suggest the extra oomph in Arctic SIE decline 2000 is due to forced tropical SST.
So I see nowhere any reason to dismiss half the 1079-2020 SIE loss as being due to one of Judy's wobbly trends.
- Human CO2 is a tiny % of CO2 emissions
MA Rodger at 22:29 PM on 2 May, 2021Eclectic @349,
I think what you call "quite a laundry list" presented by commenter lindzenfanone @348 is less a laundry list and more a nonsensical rant. (The commenter doesn't start well in my book with his chosen nom-de-clavier. For me Dicky Lindzen is today a proven liar who long-ago turned away from the scientific method.)
The rant begins effectively saying that there is no available ontological truth which of course will make all argument circular. This is followed by some silliness about naturally-emitted CO2 and anthropogenic-emitted CO2 requiring to act differently with AGW science. The non-correlation comment could be presented statistically if it were not so crazy and wrong, this followed by poorly presented statements that try (but fail badly) to set out reason to support a bold (and with the failure, unsupported) assertion that "IPCC's core theory is wrong!!"
The links appended to the comment lead to a number of dubious published papers that don't bear scrutiny**, Berry (2019) 'Human CO2 Emissions Have Little Effect on Atmospheric CO2' (two links provided), Humlum et al (20130 'The phase relation between atmospheric carbon dioxide and global temperature', Koutsoyiannis & Kundzewicz (2020) 'Atmospheric Temperature and CO2: Hen-Or-Egg Causality?' and Harde (2019) 'What Humans Contribute to Atmospheric CO2: Comparison of Carbon Cycle Models with Observations' (**These 'usual suspects' have been publishing drivel like this for years. If these particular papers presented anything game-chnging for AGW, indeed anything at all new and worthy of some small consideration, then that 'something' is failing to appear either within the denialist world or in the real world.)
- CO2 is plant food
Eclectic at 18:32 PM on 7 April, 2021TVC15 @#40 ,
the Canadian denialist has linked to an "amusing" website article showing :-
(A) "Plants have been starved for CO2 at the low levels existing before the industrial revolution". (Which would be why the South American Amerindians have dwelt in semi-arid wastelands for thousands of years rather than discovering the lush vibrant Amazonian Jungle ? )
and (B) "Mankind has been living on the edge of extinction with low levels of atmospheric CO2" . . . since all (terrestrial?) plants die if atmospheric CO2 falls below 150ppm.
I gather that under experimental conditions, plants can survive with less than 150ppm CO2 ~ but this is confounded by many other associated factors that would apply in a real world situation (including very extensive glaciation).
See my comments in #34 above.
But the very low CO2 scenario is moot because of recent anthropogenic CO2 emission. Without current human emissions, the planet would have continued for millions of years before reaching below the 150ppm mark. During that time, "assisted" or natural evolution would likely produce plants adapted to low CO2. Assuming that the humans of the future would decide not to burn a few gigatons of coal occasionally . . . or chose not to use heat to decompose calcium carbonate rock.
Humans "on the edge of extinction" is alarmist hogwash.
- Skeptical Science New Research for Week #9, 2021
MA Rodger at 19:51 PM on 14 March, 2021SunBurst @20,
When you ask about "New Research" (a term used in these SkS pages to denote research new this week), I asume you are simply trying to coin a perjorative term to troll onto this thread. So I assume you are actually asking about all what Rob Honeycutt @23 terms the "old research" which has been rattling round for yeras if not decades. Note this week's 'new research' is fresh-off-the-boat and needs a bit of time to be checked out, a checking process achieved with 'old research'.
You take a giant leap in conceding at least that there is reason to consider the possibility that you are entirely wrong about temperature trends. Well done you!!
However, I struggle to see the connection between, on the one hand, the contribution of CO2 to the "total greenhouse effect" and the percentage change wrought by AGW on that "total greenhouse effect" which you ask respondents to "remember", and on the other hand, attribution of the causes of the global warming you now see as worth assuming?
The"total greenhouse effect" contributes roughly +33ºC to planetary temperature and, while assessments of the direct mechanism of the GH-effect (eg Schmidt et al (2010) - note the date = 'old research') shows CO2 contributing 20% to "total greenhouse effect" , note also that CO2 is an esential requirement for the other main contributor to the GH-effect H2O making CO2 the principle control knob governing Earth's temperature (Lacis et al 2010 - note the date ='old research').
The actual question you ask is addressed by Bob Loblaw @22 but note that assessing the contribution of CO2 to AGW is not straightforward as the various gases have differing residence times and CO2 is particularly long-lived. But perhaps contributions cab be best simplistically measured using the NOAA AGGI which shows CO2 alone contributing a little under 60% of today's AGW (positive) forcing. Do note that all the other contributions are like CO2 anthropogenic in origin.
- Skeptical Science New Research for Week #9, 2021
SunBurst at 13:55 PM on 12 March, 2021You climate change people talk about anthropogenic global warming (AGW), but is this AGW really "global"? Well, warming has certainly happened in some parts of the world, but in other regions such as the midwestern and northeastern continental US, temperatures have dropped by about 25 degrees F during the winter months from years before 2015. In Colorado, we have seen relatively mild winters during the past 5-6 years due to drought conditions, but the summers have also been "milder" (ie. cooler). This results in much shorter growing seasons even though annual average temperatures may or may not have changed much. The ground in many places remains frozen and therefore not suitable for tilling until mid-June. Then killer frosts occur in the late August to early September time frame — not much time for growing. One might argue that our problems are related to cooling, and not warming.
Therefore, it seems that your AGW isn't as "global" as we were led to believe. Furthermore, we would expect that warming caused by the carbon dioxide greenhouse effect would be more or less uniform since CO2 tends to spread evenly in the atmosphere over long time intervals.
In view of these simple facts, we must ask if the CO2 greenhouse effect is the best explanation of any warming we are experiencing. Also, AGW believers ultimately base their claims on an increasing global mean surface temperature (GMST). But is this actually a meaningful figure of merit for assessing planetary warming?
- Veganism is the best way to reduce carbon emissions
Guilhem_S at 07:13 AM on 1 February, 2021Hi all, I appreciate when people take time to debunk climate hoax, however I think this particular article is misleading, to say the least, and need major updates. It is both in the name of the truth in science, especially related to climate change, and the credibility of your page that I’m writing this very comprehensive exhaustive feedback on the many flaws I’ve identified.
We know that land use and food production are major actors in climate change. The argument for veganism from an environmental perspective is oftenly that animal agriculture is a big contributor to climate change and shifting toward a plant based diet is better for the environment. Most people would agree that Veganism isn't the single best solution to climate change, and that -for instance- collective suicide might probably be better, as well as a totalitarian regime imposing a zero carbon lifestyle. From an individual perspective, a non vegan eating a single slice of pork ham a year but living car and plane free is probably doing better for the environment than a vegan doing a Bali - New-York plane round trip every year. With these arguments in mind, “veganism isn’t the best way to reduce carbon footprint” is a no brainer. That being said, it is true that some animal right activists overestimate the impact that veganism can have so I understand why you wish to clarify to them that it is not as black and white as they wish it to be. However globally the impact of animal agriculture is hugely underestimated (see for instance https://www.nature.com/articles/s41558-018-0354-z) and by trying to debunk a very marginal argument (‘veganism is the single best way to reduce carbon footprint’), you end up downplaying the power that one have by shifting to a plant-based or even vegan diet. This kind of attitude might actually increase the total carbon footprint, or at least minimize the carbon mitigation of people’s action by discarding a sector on which people can have a huge impact which is widely unknown from the general public.
First, the livestock sector accounts for 65% of the food sector GHGE while only providing 18% of the world's calories. And while most of the food fed to animal is non-edible (in dry weight), meat production is still globally inefficient (it takes about 3kg of edible dry plant to produce 1kg of meat https://www.sciencedirect.com/science/article/abs/pii/S2211912416300013). Because the livestock sector is about 15% of all anthropogenic emissions as calculated from many LCA, notably by the FAO (http://www.fao.org/gleam/results/en/), it is a huge source of potential mitigations.
To get a first idea of what are the order of magnitude we’re talking about, governmental official French figures are as follows : An average omnivorous diet emits 2,8 tons of equivalent CO2 per year, about half of which is coming from animal products (meat, dairy and eggs). A diet with ruminant at every meal emits 6 tons of CO2 per year. A vegan diet can emit as low as 0.6 tons and is the least carbon intensive diet. To achieve Paris agreement on climate change we need an individual carbon footprint of 2 tons or less of CO2 per person per year, which is impossible to achieve on a cheese or meat-based diet. [1]. A vegan meal is, on average 0.8kg of CO2 [2], a egg-based meal is on average 2kg of CO2 [3], a cheese/pork/chicken based-meal is 5.4kg of CO2 [4] and a ruminant based meal is 25.2kg of CO2 [5]. According to the french national agency for climate transition, a vegan meal emits 2.5 to 31.5 times less CO2eq than any other meal and there is no reason that this figure should be much different in other countries. If anything, French carbon impact of animal products -especially ruminant- should be lower than in other countries such as Brazil. These kinds of figures appear nowhere in your article while they could provide useful insight to readers as to what are the best food sources to fight climate change.
[1] https://nosgestesclimat.fr/simulateur/bilan
[2] https://nosgestesclimat.fr/documentation/alimentation/plats/v%C3%A9g%C3%A9talien
[3] https://nosgestesclimat.fr/documentation/alimentation/plats/v%C3%A9g%C3%A9tarien
[4] https://nosgestesclimat.fr/documentation/alimentation/plats/viande-1
[5] https://nosgestesclimat.fr/documentation/alimentation/plats/viande-2
“Although veganism does have the potential to reduce GHG emissions associated with diet, it is important to consider other sectors that are also part of the problem.” → One might ask why we should consider other sectors when it is this one we are debating. This kind of “whataboutism” argument can be used to discard every policy on reducing carbon footprint.
Insisting on what people perceive (to be feasible, to be environmentally friendly, etc.) instead of what is factually positive for the environment is misleading. If you claim to answer the complex question of limiting the worst for the climate you cannot rely on people’s opinion. I know just as much as you that major societal and individual change are required to achieve climate goals and prevent the worst scenario. Claiming that veganism isn’t good because some people really want to eat meat as a main argument is unbelievable on a website such as yours and by trying to debunk such a minor myth in our society (PETA's claim), you perpetuate more dangerous myths (such that grass fed ruminants are carbon friendly). Because the myth that does currently more damage is that local, organic, grass fed animal are better for the environment you should reverse the debunking and show that actually, intensive exported plant food are way more carbon friendly (and that “organic” isn’t really doing much, except increasing the demand for land by decreasing the productivity)
When you’re pointing at non-vegan related issues such as food waste to dismiss the major changes that could be brought, you’re obscuring the debate further. When we talk about change, we have to think about counterfactual scenarios: the question is not ‘is veganism with a lot of fruit imported by plane wasted good?’ but ‘is veganism good, all things else being equal ?’. Otherwise it might sound like a strawman.
On the Kim et al. (2019) paper, I don’t know how you manage to distort the results that much in the process of trying to make veganism look bad. The paper is clear: the vegan diet is the less carbon intensive in all country studied (97% to be correct), only the low-food-chain diet is slightly above, but not statistically significantly different, from vegan diet*. The argument you make about vegetarianism has not his place here if you want to discuss Veganism. What the paper is saying is that it’s better to be ⅔ vegan than 100% vegetarian because dairy products have a massive impact so it doesn’t compensate for the ⅓ of omnivorism remaining. Therefore, your conclusion “there are arguments that a flexitarian diet with moderate amounts of meat is better than a vegetarian diet that cuts out meat completely, showing that stopping meat intake completely does not necessarily reduce dietary GHG emissions and cannot be assumed to do so in a vegan diet.” is a fallacious non-sequitur : vegan diet is better than both flexitarian and vegetarian diet (as shown by the very study you’re citing) because it eliminate both meat AND dairy which both are very carbon intensive. I can’t believe you haven’t seen that and I really wish I was able to assume you’ve made an honest mistake but I barely can. Such mistakes, always in the disadvantage of veganism, and repeated, seriously undermine the ideological neutrality of the author on these questions.
(*Please note that the low food chain diet is a diet where 90% of animal proteins are replaced with pulses, so we could say it’s a 90% vegan diet. That’s why it’s not statistically significantly different from vegan diet).
The vegan diet doesn’t lead to a higher consumption of fruit: because vegan doesn’t eat meat, cheese and eggs which are the main source of protein, fat and calories, we should expect vegan to eat protein and fat sources instead such as legumes, beans and nuts or oil. Increasing fruit consumption is within the nutritional guidelines of every country which have one. For these reasons, the whole paragraph appears as a non-sequitur. At best, the argument is very weak and it is on you to show that the eventual additional portion of fruit due to veganism (and not due to healthier lifestyle as vegans also usually have healthier lifestyle, but uniquely due to veganism, which its very existence is one of your unproven assumption) will increase carbon emission so much that it will cancel out the 8Gigaton of CO2 mitigation from quitting animal agriculture. I think because of the assumption it relies on, both the waste and plane-transported food fruits are not a valid argument
Speaking about the food waste, which is another issue a priori unrelated to and independent from veganism, there’s a paper titled “The opportunity cost of animal based diets exceeds all food losses” [https://www.pnas.org/content/115/15/3804]. The title is pretty straightforward: in the US, after adjusting for various nutrient density, the adoption of a vegan diet could feed 300 millions more people while the total elimination of all waste along the whole food production line (which is impossible) could only feed 100 millions more people. Once again, just like the “Vegetarian vs. vegan” paragraph, I don’t understand how you can try to use an unrelated issue to make veganism look bad but still fail.
As a reminder, the biggest meta-study on food impact shows that only 0.16% of the food on the planet is transported by plane [https://ourworldindata.org/food-transport-by-mode]. It is questionable to mention it only here, when talking about veganism. The main impact of the vast majority of food is on-farm emission, as shown by the same meta-study on 38000 farm in 119 countries [https://ourworldindata.org/food-choice-vs-eating-local] eating 100% local would only reduce emission by 5-10% whereas eating vegan can divide by several time the carbon footprint of diet.
The argument of carbon sequestration by grazing livestock, a favorite of the industry, have been proven wrong for a long time, as the methane and nitrous oxide emission from ruminant far exceed the best sequestration possible. See for instance this review of the literature (and note the discrepancy between figure from the academic domain and claim from outsider unpublished in journal such as Savory) [https://tabledebates.org/sites/default/files/2020-10/fcrn_gnc_report.pdf]. Also, wild ruminants could do the same job and it would be vegan, as grazing pasture doesn’t require either killing nor exploiting them. Many wild ruminants still exist, preceded humanity and very likely will still exist if humanity disappears.
You might want to update the carbon impact of a vegan diet because Scarborough and Berners-Lee are not really in agreement with current research. Current research from Poore and Nemecek [https://science.sciencemag.org/content/360/6392/987], of the BMJ paper by Springmann [https://www.bmj.com/content/370/bmj.m2322] show that a vegan diet emits several times less (>50% less) CO2 than conventional diet. The official French figure show that a vegan diet can emit 4 times less CO2 than the current diet. You might as well check out the IPCC report on land use showing that a vegan diet could prevent the emission of 8 Gigaton of equivalent CO2 per year, showing a massive reduction (roughly 20% of all current anthropogenic emission https://www.ipcc.ch/srccl/chapter/chapter-5/). A recent Science paper also showed that shifting toward a plant-based diet (EAT Lancet which is about 70% less white meat and 95% less red meat than current French diet) and other food change are mandatory to reach climate agreement [https://science.sciencemag.org/content/370/6517/705]. The Kim paper of 2019 you’ve cited above shows a global reduction of 70% GHGE (why did you choose to not mention it ?). In the light of these various paper, it seems strange that you choose to show only to moderate-impact paper.
The latest Lancet Countdown report shows that animal agriculture emits about 55% of the carbon footprint of food production (including the feed) while providing only 18% of the world's calories. What is really shocking to me is that 95% of the animal farming carbon footprint comes from ruminants which represent a tiny minority of the number of animals killed and meat consumed. How can you suggest that eating lamb or beef is sustainable in any way ? For an outsider it looks like you’ve internalized the rhetorics of the industry and are really detached from the reality of the current research. [https://www.thelancet.com/journals/lancet/article/PIIS0140-6736(20)32290-X/fulltext]
The occurrence of cowspiracy appears as you have something against this movie and seems to alter your neutrality. There are ways to criticize some element of cowspiracy (such as the Goodland paper and the 51% figure) without making such a poor quality argument against veganism as a whole.
I would like to add few points that you have eluded about the impact a vegan diet can have: it can do much more to the planet than just ‘reducing GHG emissions associated with diet’. It can, for instance, lower potential health crises by reducing zoonotic emergence risk (70% of new diseases are zoonotic https://royalsocietypublishing.org/doi/10.1098/rstb.2001.0888). Land which are not used could be left to the wild, and with the natural reforestation of pasture we could sequester up to 700 Gigatons of CO2, making the climate goal of +1.5°C by 2100 feasible at 66% as shown by this Nature Sustainability article of 2020 [https://www.nature.com/articles/s41893-020-00603-4]. In countries where the meat consumption is high, it could drastically reduce the disease burden and total mortality, according to this BMJ paper, it could reduce total mortality of several tenth of % [https://www.bmj.com/content/370/bmj.m2322]. Note that this article also explored the carbon impact and showed a vegan diet emit globally 80% less CO2 than what we are currently doing (and is of course the least carbon intensive of all diet studied)
I hope I have achieved to make you realise how this page may sound to an outsider who knows the figure, and I have provided you with many up-to-date research sources.
Please make an impartial page to properly inform about the climate impact of food and the huge potential of plant based, vegetarian but especially vegan diet to mitigate climate crisis. As you’re part of the Pro-Truth Pledge i’m sure you will take this matter seriously. I would be more than happy to help to write something about it if you want, or to answer any of your questions.
Thank you for your considerations,
Guilhem - CO2 emissions do not correlate with CO2 concentration
Fred Torssander at 22:11 PM on 6 January, 2021I have tried comparing ghg emissions and atmospheric CO2 (yearly figures) in an x-y diagram to get a picture of the degree of coupling, time lag between emission and atmospheric concentration and the effects of economic- politic- and distributioncrises. But the data I have used is not the same as you. And I also find interesting differences between the period before the oil-crisis in the 1970-ies and aftewards. I think the storing and later use of oil and coal can have an impact. As well as strategic planning. Can you recommend any continous sources of data for lets say the period from 1900 up until today, for (anthropogenic) GHG emissions and atmospheric CO2?
- Climate's changed before
Daniel Bailey at 00:29 AM on 29 October, 2020Since we are discussing sea level rise, recent sea level rise is unprecedented over the past 2,500 years (Kopp et al 2016):

Anthropogenic forcing dominates global mean sea-level rise since 1970 (Slangen et al 2016):
"the anthropogenic forcing (primarily a balance between a positive sea-level contribution from GHGs and a partially offsetting component from anthropogenic aerosols) explains only 15 ± 55% of the observations before 1950, but increases to become the dominant contribution to sea-level rise after 1970 (69 ± 31%), reaching 72 ± 39% in 2000 (37 ± 38% over the period 1900–2005)"
Causes of sea level rise since 1900, from NASA and Frederikse et al 2020:

Takeaways:
1. Glacier-dominated cryospheric mass loss has caused twice as much sea-level rise as thermal expansion since 1900
2. The acceleration since the 1970s is caused by the combination of thermal expansion and increased Greenland mass loss
3. Ocean mass increases from land-based ice losses dominated the early 20th and 21st Century sea level rise record; ocean heating was the dominant component from 1970-2000
4. The closure of the 20th-century sea-level budget derived here implies that no additional unknown processes, such as large-scale deep ocean thermal expansion or additional mass loss from the Antarctic Ice Sheet are required to explain the observed changes of global sea level
Additionally, new research (Miller et al 2020) affirms modern sea level rise is linked to human activities, and not to changes in Earth’s orbit:
"Surprisingly, the Earth had nearly ice-free conditions with carbon dioxide levels not much higher than today and had glacial periods in times previously believed to be ice-free over the last 66 million years, according to a paper published in the journal Science Advances.
“Our team showed that the Earth’s history of glaciation was more complex than previously thought,” said lead author Kenneth G. Miller, a Distinguished Professor in the Department of Earth and Planetary Sciences in the School of Arts and Sciences at Rutgers University-New Brunswick. “Although carbon dioxide levels had an important influence on ice-free periods, minor variations in the Earth’s orbit were the dominant factor in terms of ice volume and sea-level changes — until modern times.”
Sea-level rise, which has accelerated in recent decades, threatens to permanently inundate densely populated coastal cities and communities, other low-lying lands and costly infrastructure by 2100. It also poses a grave threat to many ecosystems and economies.
The paper reconstructed the history of sea levels and glaciation since the age of the dinosaurs ended. Scientists compared estimates of the global average sea level, based on deep-sea geochemistry data, with continental margin records. Continental margins, which include the relatively shallow ocean waters over a continental shelf, can extend hundreds of miles from the coast.
The study showed that periods of nearly ice-free conditions, such as 17 million to 13 million years ago, occurred when the concentration of atmospheric carbon dioxide — a key greenhouse gas driving climate change — was not much higher than today. However, glacial periods occurred when the Earth was previously thought to be ice-free, such as from 48 million to 34 million years ago.
“We demonstrate that although atmospheric carbon dioxide had an important influence on ice-free periods on Earth, ice volume and sea-level changes prior to human influences were linked primarily to minor variations in the Earth’s orbit and distance from the sun,” Miller said.
The largest sea-level decline took place during the last glacial period about 20,000 years ago, when the water level dropped by about 400 feet. That was followed by a foot per decade rise in sea level — a rapid pace that slowed from 10,000 to 2,000 years ago. Sea-level rise was then at a standstill until around 1900, when rates began rising as human activities began influencing the climate.
Future work reconstructing the history of sea-level changes before 48 million years ago is needed to determine the times when the Earth was entirely ice-free, the role of atmospheric carbon dioxide in glaciation and the cause of the natural fall in atmospheric carbon dioxide before humans."
From the source paper, Miller et al 2020:
"High long-term CO2 caused warm climates and high sea levels, with sea-level variability dominated by periodic Milankovitch cycles.
Sea level rose in the Early Pliocene ca. 4.7 Ma, reaching highs that had not been consistently seen since the MCO. From a sea-level perspective, the Pliocene is marked by three intervals with sea level well (~10 to 20 m) above modern: 4.6 to 4.1, 3.9 to 3.3, and 3.3 to 2.85 Ma.
GMSL higher than 12 m above modern requires loss of ice sheets in Greenland, West Antarctica, and sensitive areas of East Antarctica, the Wilkes, and Aurora Basins. This interval is of keen interest, because global temperatures were >2°C warmer than today at times when atmospheric CO2 concentrations were on the order of those in 2020 CE (~400 ppm), and thus, the equilibrium sea-level state is relevant to ice sheet trajectories in coming centuries. The peaks between 3.9 and 3.3 Ma were even higher, reaching a peak of ~30 m during Gi13, and thus requiring some melting of the EAIS.
The development of a permanent EAIS by 12.8 Ma resulted in a change from responding to precession, tilt, and eccentricity to subdued to absent response to eccentricity and precessional forcing that had previously been strong; the 41-ka tilt cycle dominated ice sheet and sea-level response from ca. 12.8 to 1.0 Ma following the development of a permanent EAIS. During the mid-Pleistocene transition, very large, 100-ka paced LIS were amplified by 100-ka changes in CO2 from ~180 (glacial) to 280 ppm (terminations).
During the last deglaciation (ca. 19 to 10 ka), GMSL rise exceeded 40 to 45 mm/year, providing an upper limit on known rates of GMSL rise. Rates before radiocarbon ages are less certain, although the sea-level rises exceeded 10 mm/year during terminations. Sea-level rise progressively slowed during the Holocene until the late 19th to early 20th century when rates began to rise from near 0 to 1.2 mm/year in the early 20th century to a late 20th and 21st century rise of 3.1 ± 0.4 mm/year.
Sea level follows long-term trends of atmospheric CO2, with high sea levels associated with high CO2 and warm climates. CO2 played an important role with high CO2 maintaining warmth in the Eocene (with values >800 to 1000 ppm; associated with largely ice-free conditions and high sea levels. Generally, decreasing CO2 values during Middle Eocene to Oligocene led to cooling and glaciation, although a secondary CO2 increase at ca. 35 to 36 Ma may be associated with the late Late Eocene warming. The cause of the CO2 decrease over the past 50 Ma has been widely discussed and debated but must be due to long-term (107-year) changes in CO2 sources (e.g., higher CO2 associated with inferred higher ocean crust production rates) or more likely the effectiveness of sinks CO2 (e.g., increased weathering associated with uplift of the Himalayas or exposure of basalts in tropical regions).
Our records that suggest nearly ice-free conditions occurred during the MCO and are thus intriguing if this is an equilibrium state for warming levels that will be attained in this century or the next century under sustained greenhouse gas emissions.
Our sea-level history constrains cryospheric evolution over the past 66 Ma, with ice-free conditions during most of the Early Eocene, MECO, latest Eocene, and possibly the MCO, with ice sheets (up to 40-m sea-level equivalent) in the Middle to Late Eocene greenhouse and with continental-scale Antarctic ice sheets beginning in the Oligocene.
From 34 to 13.8 Ma, the EAIS varied from larger than today (sea-level ~35 m below present) to nearly ice-free (~50 m above present) but became permanent during the MMCT ca. 12.8 Ma."
Miller 2020, Figure 4, rotated once:

And the past 40,000 years, from Miller 2020, Figure 4 above:

- Climate's changed before
Eclectic at 10:44 AM on 25 October, 2020Hal Kantrud , I would like to add a few disparate points which may be of interest to you. (And you may already have come across some of them.) As always, I shall be grateful if MA Rodger (who is extremely well-informed on climate matters) sees fit to make any corrective comment!
1. The term "BP" / bp stands for Before Present, but does not mean "up until right now this year of [2020]". BP is a convention used by the paleo scientists to standardize the reference to past ages - whether centuries, millennia or mega-years [ma]. BP at point zero is taken as year 1950.AD
Some "contrarians" have not been aware of this convention (for instance the slightly-contrarian scientist Loehle has had to go back and correct some of his work, because he was initially unaware of the paleo convention).
Hal, this paleo convention is enormously important, since there has been a huge rise in global surface temperature since 1950. Even today, some Denialist blogsites are publishing graphs which misrepresent reality, and are showing a graph's final temperature as 2000.AD or 2010.AD . . . when the original graph only went up to 1950.AD . . . and worse, the denialists have sometimes doctored or airbrushed-out the most modern temperatures. Sometimes this deliberate deception is outright concealed - and sometimes the deception is camouflaged under the term "Adapted from [a certain scientific paper]" .
Another small point is that some of the ice-core temperatures are recorded up until around 1855.AD , since later/shallower levels of ice are unrepresentative of their ambient conditions.
[You will have noticed how almost all science-deniers are still falsely (and vehemently) asserting that both the Holocene Maximum and the MWP were hotter than 2000.AD and current years.]
2. The Holocene Optimum [sometimes called Holocene Maximum] was roughly 8000 years ago, but as MA Rodger rightly points out, the Maximum was more of a plateau of roughly 5 millennia. Over the succeeding 4 or 5 thousand years, the temperature has dropped roughly 0.7 degreesC as part of the background cooling which would eventually lead into the next glaciation. But AGW has intervened - with global temperature rising like a rocket in the past 100-200 years (dare I say like the end of a Hockey Stick?) Hockey Stick is yet another term which causes Denialists to choke on their cornflakes.
As a consequence of the natural cooling down from the Holocene Maximum, the global sea level has reduced by about 1 or 2 meters . . . and that fall should have continued onwards as we slide into the next glaciation. Except for the modern AGW-caused rise in sea level, a rise which is slow but accelerating.
3. Each glaciation cycle of the past 800,000 has been subtly different, owing to differences in the variations of the Milankovitch cyclings. That makes it difficult to predict when the next glaciation would have occurred in the absence of human influence. One figure I recall seeing, is the next chilly glaciation being due in roughly 16,000 years. So we humans have plenty of time to fine-tune our climatic effects before any threat of severe glaciation! (Some denialists maintain that the "New Ice Age" was due in a few centuries from now . . . and our anthropogenic CO2 has fortuitously been raised only in the nick of time... )
4. I won't comment on your point of interest about the New World grasslands. The changes there would be quite minor in the overall picture.
- Climate's changed before
MA Rodger at 22:21 PM on 24 October, 2020Hal Kantrud @842,
To address your three requested points of clarification/confirmation.
(1) The only actual continent-sized ice sheet is Antarctica and that remains unaltered in size through an interglacial and through a glacial maimum. The glacial maximum see the growth of ice sheets across the northern half of N America, Greenland and N Europe. The Greenland ice sheet has survived the present interglacial but was melted out in the previous one.
The impact of small wobbles in global temperature is not significant within this process as the temperature change is small and it doesn't last very long. The ice melt is a slow process. Thus, while global temperatures stopped rising 10,000 years ago, the melt continued strongly for a further 2,500 years and less strongly for another 4,000 years, this shown by the sea level record.

(2) Your timings are a little off. After the Holocene peak temperture (best considered as a plateau 10,000y to 6,000y bp), global temperature has been dropping but only to the equivalent of 11,000y bp. 13,000y bp would have you back in the Younger Dryas event when it was very cold.
(3) The CO2 record from ice cores does show previous interglacials with CO2 (& CH4) levels falling quickly from the peak of the interglacial. This is not the case for the present interglacial when CO2 (& CH4) levels are shown to rise not fall. This has led to some interesting work setting out the idea that the activities of mankind are responsible for this early rise, for CO2 perhaps dating back to 8,000y bp (& 5,000y bp for CH4).
While this work remains speculative, the CO2 (& CH4) levels through this interglacial would act to slow the drop back into a glacial maximum.
The unprecedented CO2 levels likely now top the CO2 levels seen 3 million years ago (this was back when N America was joined S America at Panama and initiated the Arctic ice) and are thus uprecedented in 13 million years, thus back to a time when weathering of the newly-formed Himalayas caused reducing CO2 levels.
....
And addressing your main question which concerns the CO2 levels of the last few centuries rather than those of the late stone age because any increase pre-industrial cannot be the result of fossil fuel use.
According to the Global Carbon Project, the anthropogenic CO2 emissions since pre-industrial amount to some 650Gt(C) of which 450Gt(C) results from fossil fuel use and 200 Gt(C) due to Land Use Change, but note this is mainly cutting trees down not "the conversion of New World grasslands".
- Climate's changed before
Eclectic at 12:10 PM on 22 October, 2020MA Rodger @835,
Thanks. Yes, I had heard that the "frozen Thames" events had occurred even during the Medieval Warm Period (though those are never mentioned by Denialists).
I was interested in the "meme" of Thames freezings being held up as an example of the world-chilling severity of the Little Ice Age. And as I was saying to Hal Kantrud (who seems just starting out on learning about climate science) . . . the main point to remember is that the LIA and the MWP were pretty small beer compared with earlier climate changes.
As you yourself know very well, the LIA is greatly misrepresented by the climate-science Deniers :-
(a) Firstly, they exaggerate its severity ;
(b) Secondly, they falsely claim that our modern rapid warming is (somehow) "just a rebound from the LIA" .
(c) Thirdly - with amusingly unintended irony - they claim that the huge temperature excursions of MWP & LIA make the modern warming look insignificant . . . and yet at the same time they claim that the planet's Climate Sensitivity is so very low that we need not be concerned about the "slight" warming effect of anthropogenic CO2 emissions. Superb!
MA Rodger, you might not have seen it . . . but on one of the Denialist blogs recently, a particular Denier asserted that (by his calculation) Earth's Equilibrium Climate Sensitivity was around 0.4 degreesC. Improving on that, he then (based on the negligibly-small rise in CO2 which he attributed to humans) calculated that, of the modern warming, only 0.02 degreesC was human-caused. To repeat: 0.02 degreesC. Not a misprint. (Ah, who needs to pursue comedy, when so much is freely available on the Denier blogs! )
- Climate's changed before
Daniel Bailey at 09:20 AM on 22 October, 2020Hal Kantrud, by definition an ice age is any period with continental-scale ice sheets on land (like now). Within an ice age are warmer periods called interglacials and colder periods, called glacial periods (or glacial phases). The Little Ice Age nor any cool episode in the past 13,000 years do not rise to the standard of a glacial phase.

(bigger image here)
As can be seen below, glacial and interglacial periods are self-evident:

(bigger image here)
When it comes to the modern warming forcing from human activities, it's already comparable to the warming which lifted the world out of the last glacial maximum 24,000 years ago to the height of the Holocene Climate Optimum 8,000 years ago:
"About 2.3W/m2 (from CO2), a few tenths more from CH4 and N2O.
Anthropogenic GHG forcing is ~2 W/m2 (CO2) and ~0.5 W/m2 from CH4+N2O+CFCs.
So they are comparable - ice sheets were a bigger term in the deglaciation tho."
(source)
Humans are inducing a phase transition from an interglacial world to a no-glacial world. So we are ending the ice age itself.
- What does the global shift in diets mean for climate change?
wayne at 09:00 AM on 21 October, 2020ok moderator let's start with rice cultivation, which literally doesn't pass the smell test. Rice cultivation is responsible for 22% of global agricultural methane emissions and 11% of total anthropogenic methane emissions.
Smith P, Martino D, Cai Z, Gwary D, Janzen H, Kumar P, McCarl B, Ogle S, O’Mara F, Rice C, Scholes B, Sirotenko O. Agriculture. In: Solomon S, Qin D, Manning M, Chen Z, Marquis M, Averyt KB, Tignor M, Miller HL, editors. Climate Change 2007: The Physical Science Basis. Contribution of Working Group I to the Fourth Assessment Report of the Intergovernmental Panel on Climate Change. Cambridge: Cambridge University Press; 2007. pp. 498–540.
United States Environmental Protection Agency. Global Anthropogenic Non-CO2 Greenhouse Gas Emissions: 1990–2020 [Internet]. 2006. Available from: http://nepis.epa.gov/ Adobe/PDF/2000ZL5G.PDF
Then there's the N2O
https://www.pnas.org/content/115/39/9720
- Climate's changed before
Daniel Bailey at 09:44 AM on 18 October, 2020
Atmospheric CO2 levels reached about 265 ppm about 11,000 years ago, near the end of the last glacial phase and the start of the current Holocene interglacial. From then until just before preindustrial (1850), CO2 levels slowly increased to about 280 ppm, an increase of 15 or so ppm.

(bigger image here)
What this doesn't take into account is that human activities starting around the development of agriculture until preindustrial times added about 25 ppm to those atmospheric levels. This implies that, without the human impacts, atmospheric CO2 levels would have naturally dropped by some 10 ppm over the same interval.
In more depth, human activities have been modifying the climate system for far longer than most people realize. Evidence exists that humans have been doing so since the development of agriculture more than 10,000 years ago, contributing as much as 25 ppm to existing, preindustrial atmospheric CO2 levels. During periods of previous pandemics, reforestation of formerly cultivated lands have drawn down atmospheric carbon dioxide levels enough to measurably lower global temperatures.
"Scientists understand that the so-called Little Ice Age was caused by several factors - a drop in atmospheric carbon dioxide levels, a series of large volcanic eruptions, changes in land use and a temporary decline in solar activity.
This new study demonstrates that the drop in CO₂ is itself partly due the settlement of the Americas and resulting collapse of the indigenous population, allowing regrowth of natural vegetation. It demonstrates that human activities affected the climate well before the industrial revolution began."
Link1
Link2
Link3
Link4
Link5
Link6
Link7
Link8
Link9
Link10
Link11
Link12 - CO2 emissions do not correlate with CO2 concentration
MA Rodger at 17:28 PM on 29 September, 2020Gerard Bisshop @5,
The time for half a CO2 pulse to be drawn-down out of the atmosphere into oceans & biosphere is dependent on the size of the pulse. The graph you link to (from Joos et al 2013) showing 30yr is for a 100Gt(C) pulse, so a pulse equal to a decade's worth of anthropogenic emissions. Anthropogenic emissions are approaching 700Gt(C) and models for a 1,000Gt(C) pulse or 5,000Gt(C) pulse show it takes much longer to reach that 50%-of-pulse level, perhaps 150y & 450y respectively (eg Archer et al 2009), thus making the draw-down numbers more at odds with Af=45% (which means 55% is removed within the year).
The 'circle' is squared because Af is a measure of the annual draw-down compared with a single year's emissions. Draw-down value is of course dependent on far more than a single year's emissions, indeed dependent on the emissions accumulated over the previous decades. So that 55% comprises, say, 2% of Y(0), 1.5% of Y(-1), 1.25% of Y(-2), 1% Y(-3), etc, these all adding up to 55% of Y(0). If we did manage to zero emissions in 2021, draw-down would continue, the atmospheric CO2 would thus drop and the calculation of Af would require a division by zero.
GWP numbers by definition yield GWP(CO2)=1 and use the forcing resulting over a specified period (eg 100y) from 1t(CO2) released into the atmosphere after draw-down is factored in, a draw-down which is dependent on expected accumulative totals of CO2 emissions. The level of draw-down is not considered set in stone and still subject to research. For instance CarbonBrief have coverage of a recent paper reassessing the ocean drawdown. So far, the GCMs do not model the carbon cycle (and of course have to assume future anthropogenic emissions fo all GHGs) so the level of CO2 (and other GHG levels) are inputs assumed for each GCM run.
- Human CO2 is a tiny % of CO2 emissions
Bob Loblaw at 01:50 AM on 14 September, 2020Luiz @ 343:
The 29Gt is misleading? No, it is not. It is not a net flow. None of the arrows in figure 1 represent net flows. That's why there are two arrows in two directions between atmosphere and land, and atmosphere and ocean. One arrow for one flux in one direction.
There is no flow from atmosphere to fossil fuel, so there is no arrow. Any transfer from atmosphere to vegetation, etc on land is contained in the middle arrow (450 Gt). The "land use" part of the left-most 29 Gt arrow is only that portion of anthropogenic activity that causes carbon flow into the atmosphere.
There is precious little that humans have been doing that removes carbon from the atmosphere, unless you want to claim credit for crop growth, etc., that largely repsesent a replacement of natural systems, not an addition.
There are agricultural practices that can potentially increase soil carbon, etc., but on a global scale they are a drop in the bucket at this time. Agricultural practices have tended historically to lead to increased atmospheric CO2.
- 2020 SkS Weekly Climate Change & Global Warming News Roundup #35
MA Rodger at 19:43 PM on 7 September, 2020gseattle @22,
While I have no idea what the 'X' stands for, there is no doubt that Edwin X Berry is a real person. It is more "ominous" that he chooses to post his grand paper on principia-scientific.com as that shows a serious lack of judgement. Those PSI guys are serious nutcases who are actually of the opinion that AGW cannot be real because the theory breaks the Second Law of Thermodynmics (which in their version apparently says that a photon cannot travel from a cold place to a hot place, which would presumably make observing distant snow-topped mountains another impossibility).
You appear to be asking for an explanation of why the detail of Berry's grand paper is so-much garbage (rather than why his conclusions cannot be correct).
If you examine his grand model, it says no more than that the atmosphere is like a lake - the level of the water will go up if the input is greater than the output and visa versa (which is of course logical). And the output will be in some way dependent on the level - the higher the level, the more water will pour out of the outflows. He then creates a very simple mathematical interpretation of this situation which has little logic or physical basis.
His model shows that with constant input, the CO2 level will tend to an equilibrium level logarithmically. Berry fails to consider that such a finding is entirely without basis for CO2 in the atmosphere as the outflows are pouring into volumes with their own constraints and are not free to accept ever-increasing quantities of CO2. Rather, the logarithmic relationship holds roughly for changes in volume, not changes of rate of volume.
Yet the big error in his reasoning is to use his fancy model before trying to compare it with the real world situation. He uses it to conclude that the rate outflow which defines the level in his model can be aportioned and thus the level likewise. Thus, if 95% of the outflow is natural, then his model shows that 95% of the level must also be natural. The crazy logic this presents wold mean that in 1750 the influx of CO2 from ocean & biosphere would have been only 150Gt(C)/yr as this would support the pre-industrial CO2 level of 280ppm and since that time this natural influx would have risen 40% to reach today's 210Gt(C) which is required to support 390ppm in the atmosphere which is what Berry tells us is the natural component of atmosperic CO2.
There is zero evidence for such a 40% natural rise in CO2 emission and no reason given for this natural rise occurring after ten millenia of flat CO2 levels, to magically appear in recent decades at just the time and the same rate as the anthropogenic input.
Berry however, makes no attempt to check his model against reality. Instead he launches into a misrepresentation of actual modelling of atmospheric CO2 with an analysis with isotope data (which I have not examined but assume it is as crazy as the foregoing analyses).
I hope this explanation of Berry's crazy theorising will suffice.
- 2020 SkS Weekly Climate Change & Global Warming News Roundup #35
John Hartz at 00:36 AM on 6 September, 2020I inadvertently deleted the following post:
gseattle at 15:36 PM on 5 September 2020
What is the human percent CO2 percentage? As shown (and ignored), sources seem to range 1% to 5%. I went with the apparent maximum estimate, 5%. This says "The United Nations Intergovernmental Panel on Climate Change (IPCC) agrees human CO2 is only 5 percent and natural CO2 is 95 percent of the CO2 inflow into the atmosphere". But the source?
It is invalid to deny science and claim CO2's jump from 1880 can only be human. The reason for this is because of the massive effect of the ocean sink together with ocean slowing over the last 200 years now being studied. The ocean is said to store 50 to 60 times the CO2 of air but its capacity has diminished. Shown above, the air CO2 rise from 1880 is partly from nature, no other way to explain it.
"The oceans as a whole have a large capacity for absorbing CO2, but ocean mixing is too slow to have spread this additional CO2 deep into the ocean. As a result, ocean waters deeper than 500 meters (about 1,600 feet) have a large but still unrealized absorption capacity, said Scripps geochemist Ralph Keeling".
IPCC: "oceans [...] contain roughly 50 times the quantity of carbon currently contained in the atmosphere". In the past, it was considered 60 times (see Arhrenius, Callendar and/or Revelle).
This has the highest estimate I could find for total anthropogenic CO2 in gigatons since the industrial revolution. The number should be 1374 rather than 1370.
Doha infographic gets the numbers wrong, underestimates human emissions
If there's a higher number somewhere, a link to a specific page containing it would be helpful. I always like to use numbers that will favor the side of anyone who might want to argue the point when reasonable, and web pages they can like, when possible. Except in the case of 200 species per day, which is 100% unscientific.
This says 1 ppm CO2 per 7.77 Gt for the calculation. (James Hansen)
NOAA: 414 latest (NOAA's measurement while NASA's 2020 value is lower and just a model). Another source might be https://www.co2.earth/daily-co2, daily, etc.
Unfortunately couldn't find the string "Most Used Climate Myths" anywhere on this domain, perhaps use a direct link instead. MA found 1,617Gt (CO2) in Global Carbon Project, there's an xls file on the page at that link, seven tabs, perhaps he calculated it, didn't say, a description/walkthrough of the intended process may help. Reading further at realclimate on that large page, author stefan vilifies 5%, implying he knows, and then places it at 110% "the best estimate for the anthropogenic share of global warming since 1950 is 110 percent" and the source offered is another page written by stefan which cites his source as a Tweet by Gavin Schmidt which points to a 2015 Bloomberg article which does not provide any value for human vs natural CO2 at all. Typical confusion. Curiously, no one corrected .58 above, it should be 1.67/yr (still less than Greta's up to 73,000/yr). Numerous points made by gseattle have gone unopposed, they have to logically be regarded as likely solid logic and scientifically sound unless eventually opposed using science (rather than scorn). The message everywhere from climate alarmists when presented with facts seems to be, you must believe or we're going to get mad and use ridicule/scorn. Information being treated like blasphemy, that's anti-scientific.
No, really, be kind to opponents on this thought-battlefield and let your weapons be scientific facts, actual content with references in a calm way. Ad hominem is not science. Attempts to devalidate an opponent by labeling one as bad or wrong or not understanding anything isn't science nor educational to any who might read this in generations to come, nor correct. The chances are very good if any of us knew each other personally we could get along just fine and like and respect each other even with differences of opinion, all of my friends are wrong about everything and I still love them (a bit of levity there, in case it isn't obvious that was nervous humor, pending copyright).
- 2020 SkS Weekly Climate Change & Global Warming News Roundup #35
MA Rodger at 22:36 PM on 5 September, 2020gseattle @13,
You are quoting the fake scientific paper of a climate change denier to misrepresent the IPCC. The denier and the IPCC do not reach any significant 'agreement'. Indeed, the denier shows this. You do not.
You quote the first sentence of the abstract yet the second sentence is entirely wrong. Barry (2019) Human CO2 Emissions Have Little Effect on Atmospheric CO2 which begins its abstract saying:-
"The United Nations Intergovernmental Panel on Climate Change (IPCC) agrees human CO2 is only 5 percent and natural CO2 is 95 percent of the CO2 inflow into the atmosphere. The ratio of human to natural CO2 in the atmosphere must equal the ratio of the inflows. Yet IPCC claims human CO2 has caused all the rise in atmospheric CO2 above 280 ppm, which is now 130 ppm or 32 percent of today's atmospheric CO2." [My bold]
The IPCC would give the size of the natural 'inflows' of CO2 into the atmosphere over a year as being roughly 210Gt(C). And the IPCC would give the 'inflows' of anthropogenic CO2 today as being roughly 10Gt(C). So the ratio between these two numbers is roughly 5%. Yet it is not a very informative value. And do note that the second sentence in that abstract is flat wrong.
210Gt(C) would raise atmospheric CO2 by roughly 100ppm. With the annual CO2 cycle in the atmosphere showing a peak-to-peak value of just 5ppm, it is obvious that there are 'outflows' operating to balance these natural 'inflows'. And year-to-year, with the variation in the pre-industrial CO2 level pretty-much flat, it is evident that the natural inflows & outflows balance almost perfectly.

Through the industrial period, the rising CO2 levels is entirely due to anthropogenic emissions. And the rising CO2 has also increased the natural 'outflows' so that today about 55% of anthropogenic emissions are diverted out of the atmosphere by natural processes. This includes 'outflows' into the ocean which are evident by increasing ocean acidity. Thus it is not 100% of the CO2 rise that is man-made but 220%.
;;;
You balk at the spreadsheet data presented by the Global Carbon Project (linked @12) and instead present a tertiary reference to another spreadsheet which is almost ten years out-of-date (so add about 300Gt(CO2) to the values given for today's values) and now provides broken links to its data sources. The 1,374Gt(CO2) value for FF 1850-2011 concurs with the GCP value which gives 1,364Gt(CO2). The 1,832Gt(CO2) value "to end of 2010" is not so obvious but presumably includes LUC emissions. (Note, unlike pre-1850 FF emissions, pre-1850 LUC emissions are significant if included.)
- 2020 SkS Weekly Climate Change & Global Warming News Roundup #35
MA Rodger at 19:27 PM on 4 September, 2020Gseattle @8 & @10,
You venture into consideration of atmospheric CO2, a subject area in which you evidently have very little understanding. I would add that levels of atmospheric CO2 are not directly a factor in the rate of species extinctions.
The pre-industrial atmosphere contained some 280ppm CO2. The increase from 280ppm to today's 412ppm (this a current annual global average) is almost wholly directly due to human emissions. The rate of increase in CO2 has been accelerating through the industrial period and is now running at +2.5ppm/year.
I don't recognise the numbers you present for (what I assume you consider to be) accumulative anthropogenic CO2 emissions in that @10 you talk of 1,370Gt and this being in some way equivalent to 177ppm.
The Global Carbon Project assess anthropogenic emissions from Fossil Fuels since 1750 as 441Gt(C) = 1,617Gt(CO2). If such a quantity of CO2 were added to the atmosphere it would increase atmospheric concentrations by 207ppm.
Additional to FF emissions are the anthropogenic emissions from Land Use Change. The Global Carbon Project assess these LUC emissions back to 1850 and thus arrive at a total for anthropogenic CO2 emissions (FF + LUC) of 645Gt(C) = 2,361Gt(CO2), a quantity which would increase atmospheric levels 303ppm if added to the atmosphere.
Global Carbon Project assess the level of CO2 in the atmosphere resulting from human activities through the industrial period amounts to 277Gt(C) = 1,106Gt(CO2) and which would (and indeed does) increase CO2 levels by 130ppm. The ocean & land sinks that have drawn CO2 from the atmosphere through the industrial period are show to account for the difference between the all-emissions 303ppm & the emissions-plus-sinks 130ppm.
None of this atmospheric CO2 business is in any way controversial outside the febrile and ridiculous reasonings of climate chage deniers. As the RealClimate item you reference @8 proclaims:-
"The basic facts about the global increase of CO2 in our atmosphere are clear and established beyond reasonable doubt."
For reasons that cannot be explained by me, you chose to ignore this message and instead choose to quote from a piece of climate denial being debunked by the RealClimate item.
- 2020 SkS Weekly Climate Change & Global Warming News Roundup #35
gseattle at 15:32 PM on 4 September, 2020Well shucks, I disagree on misinterpreting anything but now I have to make a bunch of clarifications, my fault not for the reason one might think, it was a tactical error to use that website, confusion, the human CO2 portion is still 5% or less. I'll explain.
First, I'd say even if population suddenly became 4 billion, climate would continue changing but extinctions would reduce, with fewer species at risk because extinctions are directly due to more people.
CO2 is not killing creatures, climate is not killing creatures, people are killing creatures with guns, traps, bulldozers, dams, pesticides et al.
U.N. says 11 billion by 2100, no? So why did my friend state it not as 11 but only 9? What's the source? Mine is the U.N.
Yes deforestation is bad and that's a fine point to make but that's due to the new 150 people per minute for needed farmland because those new people need to eat, the extra people are the root cause being ignored and the cause of extinctions.
Everyone can read what NOAA said on covid and decide for themselves.
I too considered Die Welt to be wrong back when I saw that. They multiplied .04 x .05 and got .0016 instead of .0020. But my math doesn't come from it, their .04 is not my .04. And the .04% part of theirs is true. Last I saw, NOAA's CO2 is 414 ppm which is .000414 or .0414%, or rounded .04%. My ".88 ppm average per year" is not in dispute to my knowledge. Is it? 123/140=.88. My statement "our CO2 is .88 ppm x .05 = only .04 ppm per year average" is not a trick, it is simple math. Actually is .044. Therefore the way to criticize my point is to focus on that reasoning, under a scalpel.
Additional info on 95% natural CO2 ... The trouble is, I can't find IPCC, NOAA or NASA openly stating the percent anthropogenic CO2, in fact just about everyone official seems to want to avoid damaging the narrative by openly stating a percentage. If human CO2 were big they would shout it out, they are not shy. My numbers were based on a source somewhere else I forgot to make note of, seemed acceptable as a source bc it was decrying the horrors of CO2, 38 Gt human and 770 Gt natural, or 0.04935 human. I rounded that up to 5%. Is there a source saying human CO2 right now is a lot more than 5%? If so, somebody please show it. This alarmist said 36 / 750 (4.8%) and cited this but I don't see those numbers there. skepticalscience: 29/750 (an even smaller human portion, 3.9% in one place) Some claim human is only 3%, some even 2%, forbes even 1%, I doubt those. I'd like to know where people's numbers are coming from. Either way, I think I am being generous to your side using 5% since other sources have lower human CO2 figures.
So the fact that human CO2 is 5% or lower appears to be indisputable.
Going at it a different way: I read all human CO2 since the industrial revolution is 1370 gigatons total. Is this right or wrong? If right, then converting to ppm, it is only 177 ppm total over 140 years. I was surprised to find that out, hard to believe. So let's do a thought experiment:
Assume all 177 ppm human CO2 remained in the atmosphere over the last 140 years.
Then of today's 414 ppm, 237 ppm of that would have to be from nature. (414 - 177 = 237)
Original was 291.
Increase is 123.
But human total over time is 177, higher than 123.
Ergo, by pure logic, something is causing even natural CO2 in the air to rise.
So natural CO2 has gone up. Does that not mean some sort of factor is being badly missed? Should we not care?
The most logical explanation for increasing natural CO2 would be ocean slowing, AMOC slowing for example. Tons of science on it. Not on the public radar, should be. You can say natural CO2 from melting glaciers and fresh water causing ocean slowing. Or it could have all been set in motion by ... "Over the last 200 years, the magnetic field [of Earth] has lost around 9% of its strength (ESA)".
But the editor's highlight on this page is Greta. I'm focusing on her achilles heel hoping to heal it. I want her respected with a great future, not mocked. So the more important point is, quoting what I said:
"... no known species extinct from those tiny changes underlying climate change, instead only 869 total since 1500 and all due to the crush of humanity, hunting, new farmland, pesticides etc (IUCN), or .58 species per year.
Everyone can agree .58/yr (actual) is less than 73,000/yr at 200 per day (imagined)"
Summary: Greta Thunberg needs to drop that silly '200 extinct species per day' or 73,000 per year, it has no basis, a mockery of science, reduces team climate awareness numbers, I think even average people sense it is ridiculous. Best to distance yourselves from it by speaking against it. Future humans will look back wondering who on earth ever thought that fantasy was a good idea. I'm sorry this msg was so lengthy.
Solution: What Greta should do is focus instead on living, threatened species, a number people can understand.
- Spreading rock dust on fields could remove vast amounts of CO2 from air
daveburton at 08:25 AM on 14 August, 2020"Treating about half of farmland could capture 2bn tonnes of CO2 each year" — that's only about 5% of current anthropogenic emissions.
Plus, strip-mining basalt, grinding it to dust, trucking it to the hinterlands, and spreading it on fields, all would require the use of fossil fuels, which would release CO2.
Even if those additional CO2 releases would be less than the CO2 removed from the atmosphere (which is unclear), and even if rising CO2 levels were a problem (they aren't), this proposal would not be a solution. - Milankovitch Cycles
Eclectic at 13:49 PM on 4 August, 2020Kylesa @63 , your question is a bit off the bulls-eye.
The climate change caused by the Milankovitch cycle during the past 1 million years, has occurred in cycles of approx 100,000 years. It is much more correct to say that those climate cycles have been triggered by the Milankovitch orbital alterations ~ because the Milankovitch changes in solar heating of the Northern Hemisphere are very slight (purely in themselves much too weak to make a difference in global climate). However, these slight changes are then greatly magnified by the consequent change in atmospheric CO2, as the atmospheric CO2 leaves or enters the planetary oceans.
Basically, I think of the recent glaciation/de-glaciation cycles as being caused 10% by the Milankovitch changes (which are the trigger) and 90% by the CO2 rise/fall (the CO2 being the main charge of gunpowder moving the bullet).
More than 1 million years ago, the Milankovitch cycles were still in operation, but were having near-zero effect on climate because the atmospheric CO2 level was so high it swamped the tiny Milankovitch effect.
The anthropogenic causes (mostly the fast-rising CO2) have been so rapid and powerful in causing GW, that it's fair to say that the weak and ultra-slow Milankovitch effects are tiny/negligible ~ like comparing a cockroach to an elephant.
- Hansen's 1988 prediction was wrong
RedBaron at 19:07 PM on 6 July, 2020@ Nylo
You said, " to my knowledge no effort has been made to reduce CH4 emissions. Lots of talking but zero measures. There is no reason to believe that we are emitting less methane than in the 80s, despite it is increasing at about half the rate that Lacis said that it was increasing in the 80s (8ppbv/year instead of 15ppbv/year)."
This is not true at all. There have been significant changes in agricultural practises that have partially restore methane absorption and metabolism by methanotrophs in the soil over vast acreages.
Namely the widespread use of no-til combined with multispecies cover crops.
“No-Till” Farming Is a Growing Practice
And also there is significant acreage that has been converted from set stock acreage to holistic managed acreage, even though there is huge active resistance campaigns to prevent this. That reduces atmospheric methane even more.
I have written about that here before, but was asked to consolidate that information and use it like a reference. So I wrote about it here:
What reaction can you do to remove methane?
There is actually more though. Several major gas pipeline leaks have been documented and repaired too. Those apparently were a major source of the increased methane. Some say the major source.
preindustrial CH4 indicates greater anthropogenic fossil CH4 emissions.
There are multiple reasons and the issue is at least as complex as the CO2 cycle. So while there is certainly a huge degree of uncertainty, claiming there is nothing being done is just wrong.
A lot is being done, we are just not entirely sure how efficacious it is yet.
- Models are unreliable
Deplore_This at 01:24 AM on 4 July, 2020@scaddenp 1187
Here is another example of scientists who disagree with the IPCC’s conclusion on GCMs where more than 500 scientists and professionals in climate and related fields sent a “European Climate Declaration” to the Secretary-General of the United Nations asking for a “long-overdue, high-level, open debate on climate change” and were denyed.
“There is no climate emergency…Climate science should be less political, while climate policies should be more scientific. Scientists should openly address the uncertainties and exaggerations in their predictions of global warming, while politicians should dispassionately count the real benefits as well as the imagined costs of adaptation to global warming, and the real costs as well as the imagined benefits of mitigation.”
“Natural as well as anthropogenic factors cause warming. The geological archive reveals that Earth’s climate has varied as long as the planet has existed, with natural cold and warm phases. The Little Ice Age ended as recently as 1850. Therefore, it is no surprise that we now are experiencing a period of warming.”
“Warming is far slower than predicted. The world has warmed at less than half the originally-predicted rate, and at less than half the rate to be expected on the basis of net anthropogenic forcing and radiative imbalance. It tells us that we are far from understanding climate change.”
“Climate policy relies on inadequate models. Climate models have many shortcomings and are not remotely plausible as policy tools. Moreover, they most likely exaggerate the effect of greenhouse gases such as CO2. In addition, they ignore the fact that enriching the atmosphere with CO2 is beneficial.”
“There is no statistical evidence that global warming is intensifying hurricanes, floods, droughts and suchlike natural disasters, or making them more frequent.” “However, CO2-mitigation measures are as damaging as they are costly. For instance, wind turbines kill birds and bats, and palm-oil plantations destroy the biodiversity of the rainforests.”
“We invite you to organize with us a constructive high-level meeting between world-class scientists on both sides of the climate debate early in 2020. The meeting will give effect to the sound and ancient principle no less of sound science than of natural justice that both sides should be fully and fairly heard. Audiatur et altera pars!”
https://clintel.nl/brief-clintel-aan-vn-baas-guterres/
- Hansen's 1988 prediction was wrong
MA Rodger at 20:19 PM on 2 July, 2020Nylo @53,
The graph Fig 1 of the 'basic' OP above without the post-2016 GISS data does indeed suggest a more robust record of warming than would be the case with 2017-19 data added, but I wouldn't go so far as to describe it as being "a very red and tasty cherry". The climate forcing 1988-to-date is a little short of Scenario B and so also is the trend in global temperature. (GISS data relative to 2016, the following years sit 0.09ºC, 0.17ºC, 0.04ºC below 2016 with 2020 potentially topping 2016.)
Regarding the forcings relative to 1988, Fig 4 of the 'advanced' OP above plots 'actual' relative to the scenarios of Hansen et al. These derive from annual emissions of all anthropogenic forcings as does the 1.5% you quote for Hansen et al for Scenario A. The paper's Appendix B describes in more detail the acceleration in emissions for the various gases in Scenario A and the tailing-off that accelerations in Scenario B.
I'm not sure you are describing this change in annual emissions.
I suspect you are looking at either accumulative CO2 emissions since pre-industrial times (an increase of 69% since 1988) or solely annual FF CO2 emissions (an increase of 67% although that is reduced to 57% if LUC CO2 emissions are included). The numbers I quote are calcuated from Global Carbon Project data.
The NOAA AGGI gives the annual forcing data from GHG emissions which shows today's annual increase in forcing is slightly reduced relative to 1988 (this the net effect of increasing CO2 emissions balanced by the drop in CFC emissions and the 'hiatus' in CH4 emissions). In more detail, the annual forcing increase dropped from the 1980s into the 1990s but has since been on the rise again. So the forcing accounted in the AGGI are running below the Hansen et al Scenarion B but AGGI does not include any change in negative forcing from aerosols which will have boosted net forcing a bit over the period (as shown in that Fig 4 of the OP).
- Models are unreliable
Deplore_This at 05:57 AM on 2 July, 2020I am an anthropogenic climate change skeptic because I’ve read criticism of the validity of the climate temperature models referenced by the IPCC. I am not a climate researcher by training or profession and to satisfy my scientific curiosity I’ve been trying to find a university course in climate temperature modeling including CO2 sensitivity analysis. From my undergraduate degree I have an extensive background in operations research, mathematics, computer science and basic physics and chemistry courses for Engineers. So I can’t imagine there is any computer modelling that will be beyond my ability.
I’ve looked at the undergraduate and graduate curriculum for the top US environmental science universities and have found only one course on climate modeling. Penn State offered METEO 523 in Spring 2020 and only 6 of 30 seats were filled and the course has been since dropped.
Can anyone suggest a climate modeling course I can pursue? Sorry to ask here but I’ve spent a lot of time searching and have come up short.
Thank you.
- 2020 SkS Weekly Climate Change & Global Warming News Roundup #25
Eclectic at 00:42 AM on 22 June, 2020MA Rodger @6 , I gather that the "industrial energy" converted into temperature rise ~ is calculated according to Slarty's own special system. I have been enjoying reading some of Slarty's blogsite, but I have only dipped my toe into it, so far. He displays a great number of algebraic equations, which I have (perhaps wrongly) not looked into ~ this is a failing of mine, deriving from my past experience of the reams of equations publicized by Lord Monckton (the Moncktonite mathematics suffer major revision every so many months . . . yet always lead to absurd conclusions).
Slarty seems to calculate on the basis that any industrial (i.e. Anthropogenic) heat energy produced in [say] England, will remain within the national borders. No flow of wind or water across those borders, nor any transfers per evaporation/condensation.
There are other peculiarities in his blog. He states that the Milankovitch cycle produces a 10 degreeC oscillation of global temperature. Perhaps he thinks Vostok represents the entire planet. Also, he seems to feel that the CO2 in the atmosphere produces "Greenhouse" by reflecting infrared radiation back to the Earth's surface.
There were one or two other points he made which seemed in error, at my first glance at his blog : but I've forgotten what they are, now. Perhaps I can dig them out later. Of course, his blog may not be quite as bad as I first gathered ~ I may have been mistaken in my own thoughts, and too hasty in my skimming, and some of the errors may be more a matter of him expressing himself in an odd way or through excessive abbreviation of ideas. Still, it's always a red-flag worry when the earnest blogger seems to arrive at a different conclusion than the world's scientists. There's usually some blunder at the bottom of it all.
- Breathing contributes to CO2 buildup
MA Rodger at 20:18 PM on 31 May, 2020antjrk,
This comment thread drifts off-topic and now has more of the feel of an exercise in reinforcing a false & crazy theory than anything else. I will thus break off my participation but with a couple of Parthian shots.
() While calcium is an essential ingredient of both bones and milk, it is not essential for the dairy industry. If agriculture stopped liming fields this would not result in cattle being unable to form skeletons or provide milk.
() The CO2 emissions from fertilisers using FF is assessed as 467Tg(CO2)/yr or ~120Mt(C) of a total anthropogenic CO2 emission of 12,000Mt(C). Essential or not (and most here appear unconvinced of your agruments for it being essential), if that 1% of anthropogenic CO2 emissions were to become a major remaining target in the fight against AGW, I would myself consider the climate crisis pretty-much done and dusted.
- Climate sensitivity is low
Deplore This at 03:36 AM on 14 May, 2020I am an anthropogenic climate change denier because I have never found any scientific evidence that supports it. The theory is based upon modeling climate sensitivity to CO2 and as you state: “In truth, nobody knows for sure quite how much the temperature will rise”.
We hear regularly from the media that 90+% of scientists believe in anthropogenic climate change but my question is how many scientists are actually trained and practice climate modeling?
I’ve looked at the undergraduate and graduate curriculum for the top US environmental science universities and have found only one course on climate modeling. Penn State offered METEO 523 in Spring 2020 and only 6 of 30 seats were filled and the course has been since dropped. So what course is available in climate modelling so I can learn the science?
Given the lack of curriculum on climate modeling it is apparent that all climate science curriculum is based upon the assumption of anthropogenic climate change without providing any scientific evidence or expertise. This isn’t science, it’s group think. So the opinion of those 90+% so called scientists is based upon blind faith rather than science. This isn’t science it’s a hoax.
I remain interested in finding a quality course in climate modeling.
- How does the way we define methane emissions impact the perception of its effects on global warming?
RedBaron at 23:37 PM on 6 May, 2020There is a flaw not recognised by this essay as well. In order for any reduction in livestock production to have an effect on CH4 emissions, would depend on how that vegetative material that used to feed livestock decomposed and produced CH4.
Burning the forage would still produce CH4. Composting the forage would still produce CH4. Letting the forage abiotically slow oxidize would still produce CH4. Replacing the livestock with wild herbivores would still produce CH4. Burying the forage in landfills would still produce CH4.
The primary factor in CH4 emissions is the amount and type of vegetative material being recycled, not necessarily whether a cow or a wild herbivore like a bison or elephant or termite does the recycling. Yes different routes vary slightly but not anywhere near what those figures suggest.
As the %'s for all those are a little different, but not all that much as you might think. More importantly to all these factors is the methanotroph to methanogen ratio in any particular environment where decaying vegetative matter is present. And of course you already mentioned that fossil methane from natural gas increases CO2 levels like any fossil fuel even after it oxidizes, while recent produced methane from decaying/digesting vegetative material does not effect long term CO2 levels any more than exhaling CO2.
For this reason I think your use of the 11-15% of anthropogenic greenhouse gas emissions figure from (Yusuf et al. 2012) and (Gerber 2013) to be very misleading, even if technically correct.
The reason I say that is immediately after you state,
"If everyone became vegan overnight so that livestock associated methane emissions stopped, the temperature would decrease, and the warming caused by livestock methane would be undone in a relatively short time"
This conclusion is not a given at all. Certainly not the "temperature would decrease" part. There is no way that even if we use the misleading 11%-15% figure, and even if we somehow figured a miraculous way to recycle all that vegetative material without producing any methane at all 0%, that 15% reductions in emissions would actually lower temperatures. Even 100% reductions in all anthropogenic greenhouse gas emissions wouldn't actually lower temperatures for a very long time. 15% reductions would certainly be helpful if possible, but it would slow warming, not actually cool.
So while I do appreciate the point you were trying to make, the flaws in the Vegan argument go much deeper than you are exposing.
- Michael Moore's 'Planet of the Humans' documentary peddles dangerous climate denial
alea at 00:26 AM on 6 May, 2020nigelj22:
He is right about one thing, that people do prioritise their individual desires, comfort and freedom over collective responsibility. People don't mind picking the easy low hanging fruit like changing to energy efficient light bulbs or recycling, but try asking them to give up their three abroad holidays per year, or downsize their huge SUV or house, or turn the thermostat down in winter and put another layer on, go vegetarian or vegan, i.e. anything that makes life a little bit less comfortable. That is at least partly why progress has been three fifths of bugger all over the last 50 years. If you want solutions, I don't have them, because they would very likely include policies/actions that you would claim to be unrealistic. The only suggestion I have is that we need to adapt to a new climate normal (increase robustness to the changes and extremes which are projected to happen over the next century), because even if we stopped anthropogenic emissions now, the CO2 in the atmosphere isn't going anywhere for centuries, but it is still going to be elevating the global temperature.
- It's CFCs
EGS at 01:42 AM on 7 March, 2020Could ozone depleting chemicals and the other GHGs (with a large revision downward of CO2 radiative forcing and amplification feedbacks?) explain a modestly warming upper troposphere, higher tropopause, and a cooling stratosphere that are among the markers of anthropogenic climate change? Wouldn’t that also align with the strong empirical evidence of very little global warming since the preindustrial era until 1950 that then really accelerated after the 1950s and 1960s as CFCs, HFCs, halons, and SF6 emissions skyrocketed from their industrial use as refrigerants, solvents, propellants, and electrical insulating gasses? The spike in anthropogenic warming from N20 and CH4 could likewise be timed with the massive intensification of agriculture enabled by large-scale application of nitrate fertilizer and changes in land use patterns (deforestation) accompanying the green revolution since the 1970s. This was a time that was also accompanied by dramatically increased diesel tractor and diesel vehicle use, skyrocketing bunker fuel emissions from the expansion of container shipping, and rising heating oil emissions from a switch from coal to oil, which could account for much of the rest of the increase in N20, much of the tropospheric O3, and a large part of the fine particulate emissions increases. The timing of the acceleration of warming would also strongly imply a weaker climate sensitivity to C02 forcing and a greater cumulative forcing of these other greenhouse gasses. It was, after all, in the 1980s and 1990s that global warming really accelerated, not earlier. Would that not also align well with the much stronger warming over the poles (mostly accounted for by CFCs, HFCs, N20, tropospheric O3), strong stratospheric cooling from the depletion of/hole in the polar stratospheric 03 layer, and the much weaker than expected tropical upper tropospheric temperature anomoly and the weaker than expected deep ocean warming?
- It's CFCs
EGS at 06:46 AM on 6 March, 2020Very recent work led by Lorenzo Polvani and an international team of scientists just published in January 2020 by Nature Climate Change (https://www.nature.com/articles/s41558-019-0677-4)
argues that large amounts of global and arctic warming are actually due to ozone depleting chemicals (CFCs, HFCs, other halons, and nitrous oxide [N20]), no less than 1/2 of all warming in the arctic and no less than 1/3 of all global warming between 1955 and 2005. These ozone depleting chemicals are trace gasses measured in parts per billion but have global warming potentials 100s to many 1000s of times greater than CO2. CFC-11 and CFC-12 are 19,000 and 23,000 times more radiatively efficient than CO2 per molecule. The global warming impact of methane has apparently also been underestimated, with one new study by Hmiel et al. in Nature arguing that anthropogenic CH4 releases have been 25-40% greater then previously thought (https://www.nature.com/articles/s41586-020-1991-8). Another study by Thompson et al. in Nature Climate Change from November 2019 showed that N20 emissions have been rising far more than the IPCC had assumed since 2009 (by an estimated factor of 2.3!) (https://www.nature.com/articles/s41558-019-0613-7). According to the US EPA, the global warming potential of N20 is 265-298 times greater than CO2 over a 100 year timescale (https://www.epa.gov/ghgemissions/understanding-global-warming-potentials). Tropospheric ozone (O3) is both a potent direct greenhouse gas and plays a role in the lifetime and effectiveness of other greenhouse gasses. According to research by Jim Hansen and others published in the Journal of Geophysical Research (2006), tropospheric O3 is estimated to have caused no less than 1/3 to 1/2 of the observed recent trends in arctic warming in the winter and spring, when O3 is easily transported to polar regions from lower latitude urban centers https://agupubs.onlinelibrary.wiley.com/doi/10.1029/2005JD006348. Tropospheric O3’s direct cumulative radiative forcing when combined with fine particulates like black carbon is believed to possibly outweigh that of all the CO2 released since the beginning of the industrial era https://www.pnas.org/content/pnas/early/2010/02/02/0906548107.full.pdf. Sulphur hexaflouride (SF6) is perhaps the most potent anthropogenic greenhouse gas, and its emissions have been rising rapidly from use as an electrical insulator. Its 100 year global warming potential per molecule is estimated at 23,000 times that of C02. Its atmospheric abundance is low at 8.60 parts per trillion volume, but it is rising at a linear rate by 0.33 pptv per year and can persist in the environment for more than 1000 years. https://www.atmos-chem-phys.net/17/883/2017/acp-17-883-2017.pdf
Would that not be evidence that climate sensitivity to CO2 must be much lower than previously modeled? These other GHGs would presumably have the same water vapor amplification feedbacks as CO2 (as non-condensing atmospheric gasses) and produce the expected lower adiabatic lapse rates of warmer water vapor, would they not? Or does water vapor resonate more readily with the discrete wavelengths of infrared radiation emitted by vibrating CO2 molecules? Are those wavebands already saturated so that any additional CO2 emissions can’t add much more radiative heat? In other words, if CO2 is as radiatively powerful as modeled, there should have been dramatically more global warming since the onset of industrialization, especially since the 1950s when these other GHGs really began to be emitted on a very large scale.
- Climate's changed before
KR at 07:00 AM on 25 February, 2020theSkeptik - Please see How substances in trace amounts can cause large effects regarding increasing the ppm of CO2. Raising the primary greenhouse gas concentration by more than 30% has a very significant effect.
And those unusually high greenhouse gas concentrations are exactly the issue - based upon simple spectroscopy, supported by direct empirical measurements of surface and orbital temperatures and radiation, and by examining all physically plausible temperature forcings (observed changes in natural forcings would have cooled the climate over the last 50 years, only anthropogenic greenhouse gas increases have warmed it).
So yes, the change in greenhouse gas concentrations which that graphic displays is hugely significant.
- Climate's changed before
MA Rodger at 22:19 PM on 24 February, 2020theSkeptik @808,
You refer to the plot of CO2, Methane & temperature found in the 'intermediate' OP which is derived from Antarctic ice cores.
(1) The CO2 and Methane data is obtained from the content of air bubbles so is not a measutre of ocean CO2 but of atmospheric CO2.
(2) You compare the increase in CO2 through recent ice age cycles with the modern anthropogenic increase and, given the larger temperature swings plotted through the ice ages you suggest "we would expect a much higher temperature in the present in contrast to what we see in the chart." Do note firstly that the climate forcing from GHGs through the ice ages still exceeds the modern anthropogenic forcing which have had little-enough time to act and that GHGs were not the sole forcing agent through the ice ages. Secondly, the temperatures plotted are from the Antarctic which hasn't regionally seen as much warming as there has been globally, and that despite polar amplification which would have 'amplified' the ice age temperature swings in Antarctica.
You also dismiss CO2 and methane as significant forcers of climate because you "assume that both greenhous gases and temperature are correlated to other parameters." What are these other 'parameters' you talk of and their means of 'correlation' to GHGs and to temperature?
- Australia's wildfires: Is this the 'new normal'?
Mark Thomas at 17:42 PM on 20 February, 2020BaerbelW @23
Thank you for replying.
OK i will properly delve into your links to reading and viewing material, which I can see is extensive and I am up for it.
May I have a personal reply that shows the position of the climate science community regarding the relavent percentage value of broad scale land clearing to climate change. In other words, what percentage do you think is from anthropogenic CO2/methane (re main GHG's), what percentage from land clearing in Australia?
From all my years of reading and with a solid scientific research back ground, I am currently seeing broad scale deforestation in Australia is 0.75 percentage value to our climate situation in Australia, (being fires drought increase in extreme weather etc), 0.25 percentage value anthropogenic CO2/methane and the nasty CFCs.
Being genuinely honest, and look forward to sensible dialogue.
Kind Regards
Mark
- Australia's wildfires: Is this the 'new normal'?
Mark Thomas at 09:26 AM on 20 February, 2020Nigelj@19, I was thinking along very similar lines. Comparing temperatrure trend over time against deforrestation rates and global warming trend, humidity and rainfall.
Forest Hydrogeology and impacts of deforestation evidence points to big contributions to climatic change, at much more than a localised climate. Articles I have refered so far in this thread have many references within (I can if people want a list). I mean now that I think about this it comes across as common sense. When you visualise Australia, and compare pre-european invasion land cover to the current land cover ... I can see it would drive up temperature, increase arid conditions and reduce moisture. I will further support this idea with references below.
The comparison of an area deforested to forested and moisture and temperature impacts is presented in my first comment (Mark Thomas @3) which shows a regional area in Western Australia before and after measurements. Shows dramatic impact.
Regarding Australia wide...
Available for free online (woohoo!! how all science should be) at AGU100 this paper presents modelling comparions on climate in Australia pre-european and modern day conditions.
'Modeling the impact of historical land cover change on Australia's regional climate' 2007 by C. A. McAlpine J. Syktus R. C. Deo P. J. Lawrence H. A. McGowan I. G. Watterson S. R. Phinn
The report discusses in detail the modelled variability in temperature and moisture. (I am going to try to link in some figures ... this is my first time writing on a science discussion site, )
The report investigation aim (Introduction) "...The question then is ‐ is Australia's regional climate sensitive to land cover change?....."
..."However, the effect of LCC [Land Cover Change] on the Australian climate has been a secondary consideration for climate change projections, despite the clearing of over 1.2 million km2 or ∼13% of the continent since European settlement.
The regions of greatest LCC are southeast Australia (New South Wales, Victoria and South Australia, cleared 1800‐mid 1900s), southwest Western Australia (1920–1980s), and more recently inland Queensland [Australian Surveying and Land Information Group (AUSLIG), 1990; Barson et al., 2000]. Nair et al. [2007], using satellite observational data, showed that replacement of half the native vegetation by croplands in southwest Western Australia resulted in a decrease of 7 Wm−2 in radiative forcing. They argue that general circulation models tend to underestimate the radiative forcing of LCC by a factor of two."
in section 3.2 discusses pre european and current forest modelling temperature trends 2002/2003 drought.

"[18] The simulated warmer and drier conditions in eastern Australia are cumulatively impacting on surface and sub‐soil moisture, and likely to be affecting vertical moisture transport processes, changing the partitioning of available water between runoff and evaporation. This has important, largely unrecognized consequences for agricultural production and already stressed land and water resources. Further, the simulated increase in temperatures in the sensitivity experiments, especially in southern Queensland and New South Wales, for the 2002/2003 drought, is consistent with the observed trend of recent droughts being warmer than previous droughts (1982, 1994) with a similar low rainfall [Nicholls, 2006]."
The report concludes
..."[19] The findings of our sensitivity experiment indicate that replacing the native woody vegetation with crops and grazing in southwest Western Australia and eastern Australia has resulted in significant changes in regional climate, with a shift to warmer and drier conditions, especially in southeast Australia, the nation's major agricultural region. The simulated changes in Australia's regional climate suggest that LCC [Land Cover Change] is likely a contributing factor to the observed trends in surface temperature and rainfall at the regional scale. While formal attribution studies are required, the outcomes raise important questions about the impact of LCC on Australia's regional climate, and highlight a strong feedback effect between LCC and the severity of recent droughts impacting on Australia's already stressed natural resources and agriculture."
Now at a global research level for Land Cover Change .....
Research paper in Science Direct, presented in the Global Environmental Change Journal, Volume 43, March 2017, Pages 51-61
Trees, forests and water: Cool insights for a hot world
".....As illustrated in Fig. 2, solar energy that might otherwise drive transpiration and evaporation remains in the local landscape as heat, raising local temperatures. This can result in dramatic changes across different land-use environments. Heatwave conditions can amplify these effects. Warmer temperatures appear to result in greater temperature differentials between forested and open-field environments, though broad-leaved species may have stronger impacts on cooling than conifers (Renaud and Rebetez, 2009, Zaitchik et al., 2006). Maintaining tree cover can reduce high temperatures and buffer some of the extremes otherwise likely to arise with climate change."

Fig. 2. Surface temperature distribution in a mixed landscape with forest.
For me, I am seeing that ecology needs to play an equal part of the conversation regarding climate change mitigation as much as CO2. The more I read about land cover changes and their impacts the more I see it needs to be a bigger part. They are not seperable. I note the following conclusion from the above reference 'Trees, forests and water: Cool insights for a hot world'.
... in section 9 "Though the 2015 UNFCCC Paris Agreement has again turned attention to the carbon-related role of forests, the agreement likewise emphasizes that mitigation and adaptation agendas are to be handled in synergy. Much can still be done to improve implementation.
The effects of forests on water and climate at local, regional and continental scales provide a powerful adaptation tool that, if wielded successfully, also has globally-relevant climate change mitigation potential....."
Thankyou Nigelj for encouragement to do comparison trends of climate and land based conditions and potential impacts, I see how important this is to turning the tide of climate change and anthropogenic damage, I have a new project it seems :)
- Australia's wildfires: Is this the 'new normal'?
Mark Thomas at 09:06 AM on 18 February, 2020Greetings all, just joined and first comment. I am a scientist (environmental chemistry), I am not a climate scientist, and I am openly a non-agressive sceptic of catastrophic AGW. I do however recognise the collective overwhelming impact of Anthropogenic Global Destruction AGD including the changes to global air quality. So that being said, I would like to share some information that I have seen little discussion on that greatly effects our worlds climate.
A major and little talked about fact in relation to Aust. temperature changes, Australia has removed near 40% of all forests.
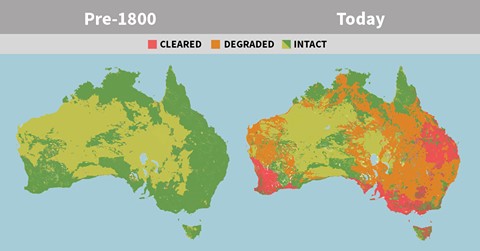
There is clear research showing the massive impact deforestation has on regional temperature and rainfall.
I came across the following paper when researching deforestation impacts on climate. ” The effect of land clearing on rainfall and fresh water resources in Western Australia: a multi-functional sustainability analysis” published in the “International Journal of Sustainable Development & World Ecology” 2013.
From the abstract: “…..We compare coastal and inland rainfall to show empirically that 55% to 62% of the observed rainfall decline is the result of land clearing alone. [an area south coast of Western Australia] Using the index of sustainable functionality, we show that the economic consequences associated with this change of land use on fresh water resource availability have been underestimated to date and disproportionately affect the environment and poorest members of the population.”Article in ABC news interviewed the author of the above paper and discusses in depth “When trees make rain: Could restoring forests help ease drought in Australia?” September 2018, states “….Around 50 per cent of native forests in the state’s south-west [western australia] were cleared between the 1960s and 1980s, which coincided with a decrease of around 16 per cent in inland rainfall compared to coastal rain, according to University of Western Australia researcher Mark Andrich.”
LINKSo when you take into the consideration the understood impact of broadscale continental deforestation seems to dwarf the impact of CO2 alone, and explains clearly why we have the dire situation combined with AGW.
To sum up, remove 40% of the vegetation from your garden, stop 30% of rainfall penetrating, remove say 30-50% of the insects and animal species diversity..... and see how it handles a couple of hot days/seasons.
So when we talk about Australia fires, I think broadscale deforestartion is a major influence.
So regarding deforestation and possible overwhelming climatic impacts in Australia am i barking up the wrong tree.... ??
- Murry Salby's Correlation Conundrum
Bob Loblaw at 06:24 AM on 17 February, 2020It looks like Max Polo's tenure here has ended, but for the benefit of anyone reading this far and not wanting to read the thread over at AndThenTheresPhysics, here is the lowdown on what Max gets wrong in his post above.
Max does fine until he gets to the point where he breaks natural uptake into two components, Un = Unn + Una.
- There is no physical basis to seperate those two fluxes. Max's equation is imply an algebraic distraction.
- One might divide natural uptake into physically-real components such as ocean vs. terrestrial, biotic vs. chemical, etc. Each of these would react differently over time, because there are different process involved.
- Each of those simply responds to the current atmospheric CO2 concentration, though - with no differentiation between CO2 that was emitted from natural sources, and CO2 that was emitted from anthropogenic sources.
- Where Max says "Unn = “natural” carbon that would get absorbed by natural sinks in absence of human emissions", he is wrong. His Unn term is actually carbon that would get absorbed by natural sinks if atmospheric CO2 had not increased. Except CO2 has ncreased. And natural uptake changes as a result. It is now Max's Unn+Una, algebraically, but it is not two different things - it's just natural uptake.
CO2 uptake varies with time. The Mauna Loa (Keeling) curve shows this clearly when the seasonal cycle is included. It does this for physical reasons, not algebraic ones.

The rest of Max's algebraic manipulations are meaningless. There is only one "natural uptake" term that can be used: Max's Un. And Un>En, so nature is a net carbon sink, not a source.
Max's "nature can be a net emitter" only applies when you fail to include a portion of the natural uptake, which is exacly what Max has done (his Una term). It's like saying "my gambling debts are not draining my bank account, because my bank account shows a net increase if I ignore my gambling expenses". There is a pyschololgical term for what that gambler is thinking.
- The five corrupt pillars of climate change denial
BillyJoe at 10:01 AM on 25 December, 2019blub:
"The models are not robust at all between about 2000-2015"
Didn't you mean 1998-2012? In any case, you are cherry-picking. Why did you not comment on the entire record? Is it because the entire record shows that the models are indeed robust. At the very least, because of natural cycles, you have to look at a minimum 30 year intervals in order to see the signal from the noise. By picking 1998-2012, you are looking at the noise, not the signal, which is obvious if you look at the entire record.
"but have been recalibrated because of the heating hiatus"
No, there is no evidence for any recalibration at all between 1998 and 2012. If you disagree please show your evidence and your references.
"This is far from settled science"
When we say "settled science" we don't mean every detail is settled, only that certain details are settled. And "settled" means that "the vast majority of climate scientists agree that an assessemnt of all the evidence leads to this conclusion". As examples: CO2 is increasing, global tempertures are increasing, anthropogenic sources are almost entirely responsible for the increase in CO2, adverse overall climate consequences are already happening and will get worse especially if we go above 1.5 degrees C. This is all "settled science".
"only a handful of "real" climatologists..even understand climate modeling correctly".
There are not just a "handful" of "real" climatologists who understand climate modeling correctly, and those who do agree that the models are robust. As in every field there are contrarians, and those with fringe on climate science who disagree.
The rest of your comment consists, likewise, of cherry-picked links. This is not how science is done. All the papers and all the evidence must be taken into account. This is what the IPCC does and you should avail yourself of the conclusions contained in their reports or distilled by reputable science communicators.
- The five corrupt pillars of climate change denial
blub at 18:09 PM on 24 December, 2019"All these arguments are false and there is a clear consensus among scientists about the causes of climate change. The climate models that predict global temperature rises have remained very similar over the last 30 years despite the huge increase in complexity, showing it is a robust outcome of the science."
The models are not robust at all between about 2000-2015, but have been recalibrated because of the heating hiatus during this time. This is far from settled science, but only a handful of "real" climatologists not self proclaimed climate scientists even understand climate modeling correctly.
The fast majority of scientists and I would assume public knows that is warming and CO2 has some influence, but it’s the warming cause is not understood entirely and therefore model predictions may be erroneous.
The following links took me 30min of researching:
https://link.springer.com/article/10.1007%2Fs00704-018-2387-7
Quantifying the importance of interannual, interdecadal and multidecadal climate natural variabilities in the modulation of global warming rates.
https://link.springer.com/article/10.1007/s00382-019-04955-2?shared-article-renderer#ref-CR12Author: Essentially, this work emphasizes the vital role of natural variability in changing the local linear trends which represent the warming rates of corresponding periods. Our results imply that to rightly attribute the climate change and accurately forecast future climate, more attention should be paid to various quasi-periodic natural variabilities, particularly ones at interannual, interdecadal and multidecadal scales. Of upmost importance, the key points to improve the simulation and prediction skills of climate models lie in correctly distinguishing the true anthropogenic warming from natural variability and accurately simulating the phase, period and amplitude of important natural variability, in which the phase is particularly important. Unfortunately, even the state-of-the-art CMIP5 models still confuse the natural climate variability and the anthropogenic warming trend and show low skills for natural variability simulations, which is the primary cause that they fail to simulate the recent global warming hiatus (Wei and Qiao 2017).
Models are not missing something or are they?:
Evidence that global evapotranspiration makes a substantial contribution to the global atmospheric temperature slowdown
https://link.springer.com/article/10.1007%2Fs00704-018-2387-7A greening world enhances the surface-air temperature difference
https://www.sciencedirect.com/science/article/pii/S0048969718350733?via%3Dihub - There is no consensus
PatrickSS at 02:20 AM on 16 December, 2019Hi All. I think it's essential that we all think for ourselves on this topic. I wanted to do that, and I started recently by looking at the scientific consensus.
I now have lots of problems with the information on this page, which I think is misleading in several different ways. From what I can see, this is an argument between the people who think that doubling CO2 will raise the world temp by about 1C (which they think will not be a major problem) and those who think that doubling CO2 will raise the world temp by about 3C (which, they think, would be a major problem). So it is very misleading to say, above, that "97% of climate experts agree humans are causing global warming", because both sides agree on that.
Secondly I have a lot of problems with the way that the consensus is reported both here and in eg Wikipedia. I decided to look at the data. I looked at what seemed to be the most recent paper on this, by Bart Verheggen and colleagues, called Scientists’ view about attribution of global warming.
https://pubs.acs.org/doi/abs/10.1021/es501998e
In the light of my first point above, the only question that you really want to hear about is their Q12, "How concerned are you about climate change as a long-term global problem?". What is quite extraordinary is that Bart and colleagues don't mention this question, or the responses to it, in the whole of their article. How could that happen?
Fortunately they have published a summary of the responses:
https://www.pbl.nl/en/publications/climate-science-survey-questions-and-responses
Now we discover that only 33% of climate scientists are more than "somewhat concerned", and 8.5% are "not very concerned" or "not concerned at all".
That doesn't really look like a consensus.
The main argument in the abstract of Bart's paper is that the authors who publish a lot on climate science are more likely to agree that anthropogenic gasses are the dominant driver of recent climate change. John Cook's graph, above, makes a similar point. Given that scientists, such as Judith Curry, who take a "contrarian" view of climate change complain that they can't get their work published, this doesn't see like a very good argument.
With the best will in the world, none of this looks good for the consensus.
Would it be possible to change the information on this page to encourage people to look at the original data in Bart's report? And also to highlight areas of agreement - such as that most contrarians are "lukewarmers" who agree that human activities cause some warming? That way lay-people such as myself would be in a much better position to think about this for ourselves.
- Skeptical Science New Research for Week #41, 2019
Daniel Bailey at 11:26 AM on 8 November, 2019That the climate changed naturally before the impacts of humans became the dominant forcing of climate is uncontentious.
That the impacts of human activities are now the dominant forcing of climate is equally uncontentious, from a scientific basis.
Scientists have evaluated all natural forcings and factors capable of driving the Earth's climate to change, including the slow, long-term changes in the Earth’s movement around the Sun (Milankovitch cycles or orbital forcings), and it is only when the anthropogenic forcing is included that the observed and ongoing warming since 1750 can be explained.
Natural vs Anthropogenic Climate Forcings, per the NCA4, Volume 2, in 2018:

Scientists have also quantified the warming caused by human activities since preindustrial times and compared that to natural temperature forcings.
Changes in the sun's output falling on the Earth from 1750-2011 are about 0.05 Watts/meter squared.
By comparison, human activities from 1750-2011 warm the Earth by about 2.83 Watts/meter squared (AR5, WG1, Chapter 8, section 8.3.2, p. 676).

In the early 20th century human activities caused about one-third of the observed warming and most of the rest was due to low volcanic activity. Since about 1950 it's all humans and their activities.
https://journals.ametsoc.org/doi/10.1175/JCLI-D-18-0555.1
https://onlinelibrary.wiley.com/doi/full/10.1002/wcc.522Further, the detection of the human fingerprint in the observed tropospheric warming caused by the increase in atmospheric concentration of greenhouse gases like CO2 has reached 6-sigma levels of accuracy.
https://www.nature.com/articles/s41558-019-0424-x
There have been many, many scientific studies over the past 175 years examining the properties of greenhouse gases, the radiative physics of carbon dioxide and the role it plays in the Earth’s atmosphere. One of the most comprehensive, recent and openly-accessible is the US 4th National Climate Assessment (Volume 1, released in 2017 and Volume 2, released in 2018). You can download the whole thing or by chapter:
https://science2017.globalchange.gov/
https://science2017.globalchange.gov/downloads/https://nca2018.globalchange.gov/
https://nca2018.globalchange.gov/downloads/FAQ’s:
https://nca2018.globalchange.gov/chapter/appendix-5/#section-1In short, human activities (primarily via the human burning of fossil fuels) have warmed the globe, which in turn are impacting the Earth’s climate.
- In 1982, Exxon accurately predicted global warming
Grant777 at 06:23 AM on 7 November, 2019MsGteacher,
I believe it's important for students to see how both sides of politics to skew data in their favorable conclusions. I love how you want them to think in a socratic oriented way. "Reading between the lines" is an important characteristic to develop at their age. It's easy assume in modern times that our civilization has all the answers. This new generation is exposed to many characteristics of instant gratifications - technology that provides instant feedback at a touch of a figure, etc... Its easy for young minds to see a problem and instantly want solutions to said problem. But what if we don't have all the answers? It is evident from previous climate models that durastic overestimates of environmental destruction took place, but getting them to think critically to why that was the case, would be a great take away. Why were the predictions in "The Inconvienant Truth" so far off from what we see approaching year 2020?
The basic knowledge of a high school student can easily look into the science of the molecule CO2, the positive feedback loops within the carbon cycle, and so on to result in a cynical veiw of Anthropogenic influences of Global Warming; although there are many things left out of standard text books. In pyschology, its learned that people in general feed on a negative situation 2x greater than a positive one. So thinking into the individuals studying climate change - an extremely complex system, one could see how derived parameters within a climate model might favor positive feedback loop characteristics over unknown or unpredictable negative feedback loops that would counterreact human influences over time.
Why were previous climate models overestimated? Precisely from human induced illogical assumptions in future outlook. What parameters did they miss to make them so durastically wrong?
Possibly increases to carbon sinks? https://www.nasa.gov/feature/goddard/2016/carbon-dioxide-fertilization-greening-earth
Creating an environment more favorable to organisms like Diatom? https://sciencing.com/diatom-ecosystem-5157.html
Also, solutions to "aid" our influences on our climate should be socratically reviewed. It'd be a good exercise with your students to do the same study I did for a college presentation on whether EV's are as eco-friendly as their advertisements want you to believe. You can go to Tesla or other Ev's sites and find their car's Voltage/mile ratings, while taking your state's annual energy CO2 emissions / voltage produced from EIA.gov and compare it with some of the best hybrid model ICE cars. You'll find for states like West Virginia, driving a Tesla or any EV for that matter produces more CO2 than even a car getting 30 mpg. And that CO2 is all being released in one area at the power plant - easily escapable to the atmosphere instead of while driving an internal combustion engine in nature etc where CO2 sinks could readily soak it in. Also I discovered these inaccuracies without taking into account the amount of power lost in resistors over time when transferring electricity a great distance.
It makes it evident to me that people like jumping to a solution without vetting it properly. Really, it comes down to using peoples' fear in a topic like AGW for government subsities in one's new business venture. Its a good eye opener to the world. I hope this might help.
- Brief overview of new IPCC report on oceans and ice risks
Daniel Bailey at 09:26 AM on 16 October, 2019"there is nothing skeptical here with all that about carbon dioxide levels causing climate change"
That the climate changed naturally before the impacts of humans became the dominant forcing of climate is uncontentious.
That the impacts of human activities are now the dominant forcing of climate is equally uncontentious, from a scientific basis.
Scientists (the actual skeptics) have evaluated all natural forcings and factors capable of driving the Earth's climate to change, including the slow, long-term changes in the Earth’s movement around the Sun (Milankovitch cycles or orbital forcings), and it is only when the anthropogenic forcing is included that the observed and ongoing warming since 1750 can be explained.
Natural vs Anthropogenic Climate Forcings, per the NCA4, Volume 2, in 2018:
Scientists have also quantified the warming caused by human activities since preindustrial times and compared that to natural temperature forcings.
Changes in the sun's output falling on the Earth from 1750-2011 are about 0.05 Watts/meter squared.
By comparison, human activities from 1750-2011 warm the Earth by about 2.83 Watts/meter squared (AR5, WG1, Chapter 8, section 8.3.2, p. 676).
What this means is that the warming driven by the GHGs coming from the human burning of fossil fuels since 1750 is over 50 times greater than the slight extra warming coming from the Sun itself over that same time interval.

In the early 20th century human activities caused about one-third of the observed warming and most of the rest was due to low volcanic activity. Since about 1950 it's all humans and their activities.
https://journals.ametsoc.org/doi/10.1175/JCLI-D-18-0555.1
https://onlinelibrary.wiley.com/doi/full/10.1002/wcc.522Further, the detection of the human fingerprint in the observed tropospheric warming caused by the increase in atmospheric concentration of greenhouse gases like CO2 has reached 6-sigma levels of accuracy.
https://www.nature.com/articles/s41558-019-0424-x
There have been many, many scientific studies over the past 175 years examining the properties of greenhouse gases, the radiative physics of carbon dioxide and the role it plays in the Earth’s atmosphere. One of the most comprehensive, recent and openly-accessible is the US 4th National Climate Assessment (Volume 1, released in 2017 and Volume 2, released in 2018). You can download the whole thing or by chapter:
https://science2017.globalchange.gov/
https://science2017.globalchange.gov/downloads/https://nca2018.globalchange.gov/
https://nca2018.globalchange.gov/downloads/FAQ’s:
https://nca2018.globalchange.gov/chapter/appendix-5/#section-1In short, human activities (primarily via the human burning of fossil fuels) have warmed the globe, which in turn are impacting the Earth’s climate.
Please demonstrate actual skepticism by reading the furnished sources before replying. - The upcoming ice age has been postponed indefinitely
Daniel Bailey at 08:53 AM on 14 October, 2019In response to your question about the timing of the next potential glacial phase inception, here's what the AR5, WG1, Chapter 5 has to say about that:
"It is virtually certain that orbital forcing will be unable to trigger widespread glaciation during the next 1000 years. Paleoclimate records indicate that, for orbital configurations close to the present one, glacial inceptions only occurred for atmospheric CO2 concentrations significantly lower than pre-industrial levels. Climate models simulate no glacial inception during the next 50,000 years if CO2 concentrations remain above 300 ppm. {5.8.3, Box 6.2}"
Further:
"Even in the absence of human perturbations no substantial build-up of ice sheets would occur within the next several thousand years and that the current interglacial would probably last for another 50,000 years. However, moderate anthropogenic cumulative CO2 emissions of 1,000 to 1,500 gigatonnes of carbon will postpone the next glacial inception by at least 100,000 years....under natural conditions alone the Earth system would be expected to remain in the present delicately balanced interglacial climate state, steering clear of both large-scale glaciation of the Northern Hemisphere and its complete deglaciation, for an unusually long time"
Looking beyond that, research has found that the ability to offset the next 5 glacial phase inceptions lies within the purview of humans:
"Our research shows why atmospheric CO2 will not return to pre-industrial levels after we stop burning fossil fuels. It shows that it if we use up all known fossil fuels it doesn't matter at what rate we burn them.
The result would be the same if we burned them at present rates or at more moderate rates; we would still get the same eventual ice-age-prevention result."
And
"Burning all recoverable fossil fuels could lead to avoidance of the next five ice ages."
- There is no consensus
Daniel Bailey at 09:47 AM on 9 October, 2019There has long been a consensus among climate scientists, based on multiple types of scientific evidence, that greenhouse gas emissions are altering the Earth’s climate. The strength of the scientific consensus on climate change has been established by numerous research studies employing a variety of methods, including surveys of scientists (Carlton et al., 2015; Doran & Zimmermann, 2009; Rosenberg et al., 2010; Stenhouse et al., 2014; Verheggen et al., 2014), analysis of public statements in scientific assessment reports and multi-signatory statements about climate change (Anderegg et al., 2010), and analysis of peer-reviewed studies about climate change (Cook et al., 2013; Oreskes, 2004). These peer-reviewed studies demonstrate a consensus among climate science experts that humans are causing global warming. Estimates of the extent of the consensus among experts—climate scientists who publish peer-reviewed climate research—vary between 90 to 100%; as of 2016 the best estimate, based on a number of studies, was 97% (Cook et al., 2016).
NASA’s climate change website presents the state of scientific knowledge about climate change. This includes a webpage on the scientific consensus about human-caused climate change, which captures the robust nature of the scientific consensus by citing multiple peer-reviewed studies from research groups across the world. This approach for assessing and portraying the veracity and consensus of a research result, in this case the scientific consensus on climate change, is consistent with NASA’s scientific research portfolio – namely the reliance on up to date peer-reviewed scientific literature.
https://climate.nasa.gov/scientific-consensus/
Here’s a recap of the published research articles appearing in peer-reviewed refereed journals examining the ever-strengthening, consilient consensus present in the primary literature:
A. Oreskes et al 2004 - The Scientific Consensus on Climate Change
Science 03 Dec 2004, Vol. 306, Issue 5702, pp. 1686; DOI: 10.1126/science.1103618
https://science.sciencemag.org/content/306/5702/1686B. Doran and Zimmerman 2009 - Examining the Scientific Consensus on Climate Change
EOS, Volume 90, Issue 3, Pages 22–23, doi: 10.1029/2009EO030002
https://agupubs.onlinelibrary.wiley.com/doi/abs/10.1029/2009EO030002C. Anderegg et al 2010 - Expert credibility in climate change
PNAS, vol. 107 no. 27, 12107–12109, doi: 10.1073/pnas.1003187107
https://www.pnas.org/content/107/27/12107.fullD. Rosenberg et al 2010 - Climate change: a profile of US climate scientists’ perspectives
Climatic Change, August 2010, Volume 101, Issue 3–4, pp 311–329; DOI 10.1007/s10584-009-9709-9
https://link.springer.com/article/10.1007/s10584-009-9709-9E. Cook et al 2013 - Quantifying the consensus on anthropogenic global warming in the scientific literature
Environmental Research Letters, 15 May 2013, Volume 8, Number 2; doi:10.1088/1748-9326/8/2/024024
https://iopscience.iop.org/article/10.1088/1748-9326/8/2/024024F. Verheggen et al 2014 - Scientists’ Views about Attribution of Global Warming
Environ. Sci. Technol., 2014, 48 (16), pp 8963–8971, doi: 10.1021/es501998e
https://pubs.acs.org/doi/abs/10.1021/es501998eG. Stenhouse et al 2014 - Meteorologists' Views About Global Warming: A Survey of American Meteorological Society Professional Members
Bulletin of the American Meteorological Society, 2014, Volume 95 No. 7, pp 1029–1040, doi: 10.1175/ BAMS-D-13-00091.1
https://journals.ametsoc.org/doi/full/10.1175/BAMS-D-13-00091.1H. Carlton et al 2015 - The climate change consensus extends beyond climate scientists
Environ. Res. Lett. 10 (2015) 094025, pp 1–12, doi:10.1088/1748-9326/10/9/094025
https://iopscience.iop.org/article/10.1088/1748-9326/10/9/094025/metaI. Cook et al 2016 - Consensus on consensus: a synthesis of consensus estimates on human-caused global warming
Environ. Res. Lett. 11 (2016) 048002, pp 1–7, doi:10.1088/1748-9326/11/4/048002
https://iopscience.iop.org/article/10.1088/1748-9326/11/4/048002/metaAlso linked from NASA’s Scientific Consensus page, but worthy of repeating, a list of scientific organizations that hold the position that Climate Change has been caused by human activities and actions.
https://climate.nasa.gov/scientific-consensus/
http://www.opr.ca.gov/facts/list-of-scientific-organizations.htmlIn essence, there aren’t any (as in none, not even one) national or international scientific societies disputing the conclusion that most of the warming since 1950 is very likely to be due to human emissions of greenhouse gases.
To sum: the science underlying and affirming the human-causation is based on over 170 years of research, research integral to the science forming the structural framework of our modern world today.
From weather balloons to airplanes, from Pershing-2 to cruise missiles guidance and delivery systems, from CD & DVD players to microwave ovens, and from cellphones, GPS locators, HD TVs and the Internet, the radiative physics of CO2 pervasively form the bedrock underpinning our technology today.
And the ever-strengthening, consilient consensus present in the primary literature merely acknowledges that.
- Greta Thunberg is a painful reminder of decades of climate failures
Mal Adapted at 03:02 AM on 23 September, 2019Excellent historical summary, Dana. I'm a boomer, who went through the 1970s and '80s as a conservationist without being aware of anthropogenic global warming. In 1988 I happened to be newly employed in the Laboratory for Terrestrial Physics at NASA's Goddard Space Flight Center, when GISS's James Hansen made his historic appearance before Congress. I remember the Earth scientists in LTP discussing Hansen's claim, and quickly (within weeks, IIRC) reaching a consensus that it was well-supported by the evidence. Again if memory serves, three basic items clinched it for me personally: the known radiative properties of CO2, the steady annual increase in atmospheric CO2 recorded by C.D. Keeling, and estimates of the rate of the anthropogenic transfer of fossil carbon to the atmosphere (e.g. Marland et al. 1985). The 1989 EPA Report to Congress was further persuasive. The costs of ensuing climate change were still mostly hypothetical at that time, however.
In the early 1990s, with a Democratic POTUS in place after three terms of Reagan-Bush, the 'Wise Use' movement was gaining momentum in the US, with the 1994 Republican takeover of Congress an early payoff for its backers. I was thus aware but still shocked at the success of efforts to conflate concern about climate change with political environmentalism and therefore liberalism, and the subsequent public backlash against climate science. Having since learned damning details of the long-term strategy, by fossil fuel producers and investors, to build an AGW-denial industry that could forestall collective action to decarbonize the US economy as long as possible, I'm over being shocked. Now, as the public's attention is caught by ever greater weather extremes, dare I be optimistic about Greta Thunberg's global youth movement? Al Gore says in the NYTimes that I can be. With due respect to the former VPOTUS through the political debacles and missed opportunities of the '90s, I'm not sure his is the voice America needs to hear now. OTOH, the US contingent of all those protesting youths will start voting soon. More power to 'em.
- Climate denier scientists think these 5 arguments will persuade EU and UN leaders
MA Rodger at 22:02 PM on 12 September, 2019The OP suggests this silly denialist letter to the EU "represents the best case that climate deniers can make against the existence of a climate crisis." I feel that needs some qualification as it is a small set of denialists who came up with the silly five point 'oh-no-it's-not' rebuttal.
At the end of January we hear of a large number of academics writing to the Belgian "federal and regional governments." I cannot see the actual letter sent but it did result in swivel-eyed denialists from the Netherlands responding with a point-by-point counter-argument which was quickly translated for the English-speaking deniosphere.
(The authorship of the denial is given as the Climate Intelligence Foundation which is described as "a new Foundation that is funded by worried wealthy citizens. The Foundation focuses on independent public information. She does that by telling the entire climate story." somewhat similar to the nonsense spouted by the UK's GWPF who make out they are an educational charity (& thus trouser taxpayers money to fund their lies). The odd thing with this authorship for an OP posted 1st Feb 2019 is the Climate Intelligence Foundation (soon gaining the name CLINTEL) was not started until the end of March 2019, according to one of its co-founders. who says in this video that it will be set up "tomorrow" with the launch seemingly a couple of days later.)
The point-by-point counter-argument of early Feb runs to seven points. The first five of these present identical argument to the silly denialist letter, although the letter has hardened the message a bit. The first five Feb points were - (1) Climate has always changed with warming from 1850, (2) Calling recent warming 100% anthropogenic is unscientific, (3) There is no discernable trends in floods & droughts & plagues of frogs, (4) Models are hypersensitive to CO2 so any warming CO2 causes will be mild and nature can cool as well as warm. (5) The cost to Belgium & Holland of AGW mitigation is massive for "negligible and immeasurable" gain.
(These five from February are pretty-much the same as the five in the silly denialist letter of August. The February version adds (6) AGW mitigation is not more cost-effective than doing nothing, (7) They mix up a clean environment, which all agree with, with AGW mitigation.)
So the grand denialist message is no more than a knee-jerk response to a letter from Belgian academics supporting stronger action on AGW. That it has folk like Richard Lindzen signing-up to it when he disagrees with parts of it is presumably more a mark of solidarity than a mark of wholehearted agreement.
- It's cosmic rays
MA Rodger at 20:18 PM on 6 September, 2019unknownwallet @111,
(I should point out that you do not address the bogus cosmic ray theory which is the actual subject of this comment thread.)
You say "i'd really to ask someone to prove me wrong" so let's kick off with your statement number one (which is also illustrated top left in the collection of graphics in your third URL).
By volume, the percentage of water vapour in the atmosphere is 0.4% (and roughly half that by weight), thus much lower than the 2% value you present. In a dry atmopshere, today's CO2 levels top 400ppm(v) or 0.04% (0.06% by weight). Again this is greatly different to your value of (0.02 x 0.0362 =) 0.072%.
Today's CO2 levels are (1 - 280/400 =) 30% anthropogenic thus 0.012% of the total atmosphere by volume (0.018% by weight) where as you say 3.4% of CO2 is due to human activity and thus 0.0025% of the atmosphere.
(I should also mention the graphic below top left on your third URL which gives different values again 1% for all GHGs, of which 4% CO2, of which 4% is anthropogenic.)
The raw volumes/weights of GHGs in the atmosphere is not in a very good gauge of their impact on the climate. Water vapour, for instance, is only present at the levels we see because the long-lived GHGs (which are predominantly CO2) It is long-lived GHGs that raise global temperatures and it is only this increased temperature that to allow the atmosphere to hold such levels of water vapour. And despite there being ten-times-more water vapour (by volume) than CO2 in today's atmosphere, its contribution in boosting the GH-effect is far less than 10x (even when cloud is factored in).
The one value you provide that is entirely a mystery but also fundamental to your argument is the percent of CO2 - "only 3.4% of CO2 is due to human activity." Where does that 3.4% value come from?
- Residence Time and Prof Essenhigh
daveburton at 21:52 PM on 25 August, 2019Eclectic wrote, "your heated-wire analogy is even wider of the mark..."
It is just a simple example illustrating a general principle. It's how negative feedback systems work. If the removal rate increases with system output level, that's a negative feedback mechanism. A constant forcing input will then result in a plateau at "equilibrium," where the negative feedback has caught up with the constant input.
That's true when the input forcing is energy added to your toaster via electricity, and the negative feedback mechanism is radiative & convective heat loss from a nichrome wire.
It's also true when the input forcing is CO2 added to the atmosphere, and the negative feedback is CO2 removal from the atmosphere via dissolution in the oceans and terrestrial plant uptake.
The principle is true regardless of whether the negative feedback is linear or nonlinear. For the nichrome wire example, there are actually three significant negative feedbacks, all with different transfer functions: radiative heat loss goes up in proportion to the 4th power of the temperature relative to 0K, convective heat loss goes up in approximate proportion to the temperature difference between the wire and ambient air, and the resistance of the wire also goes up with temperature. The fact that all three have different-shaped transfer functions doesn't affect the conclusion: because they are negative feedbacks, a constant input (forcing) must result in a plateuing output, gradually approaching equilibrium.
Eclectic continued, "The design of the Simple Model fits at best tangentially with physical reality."
It fits extremely well for the period for which we have accurate measurements:
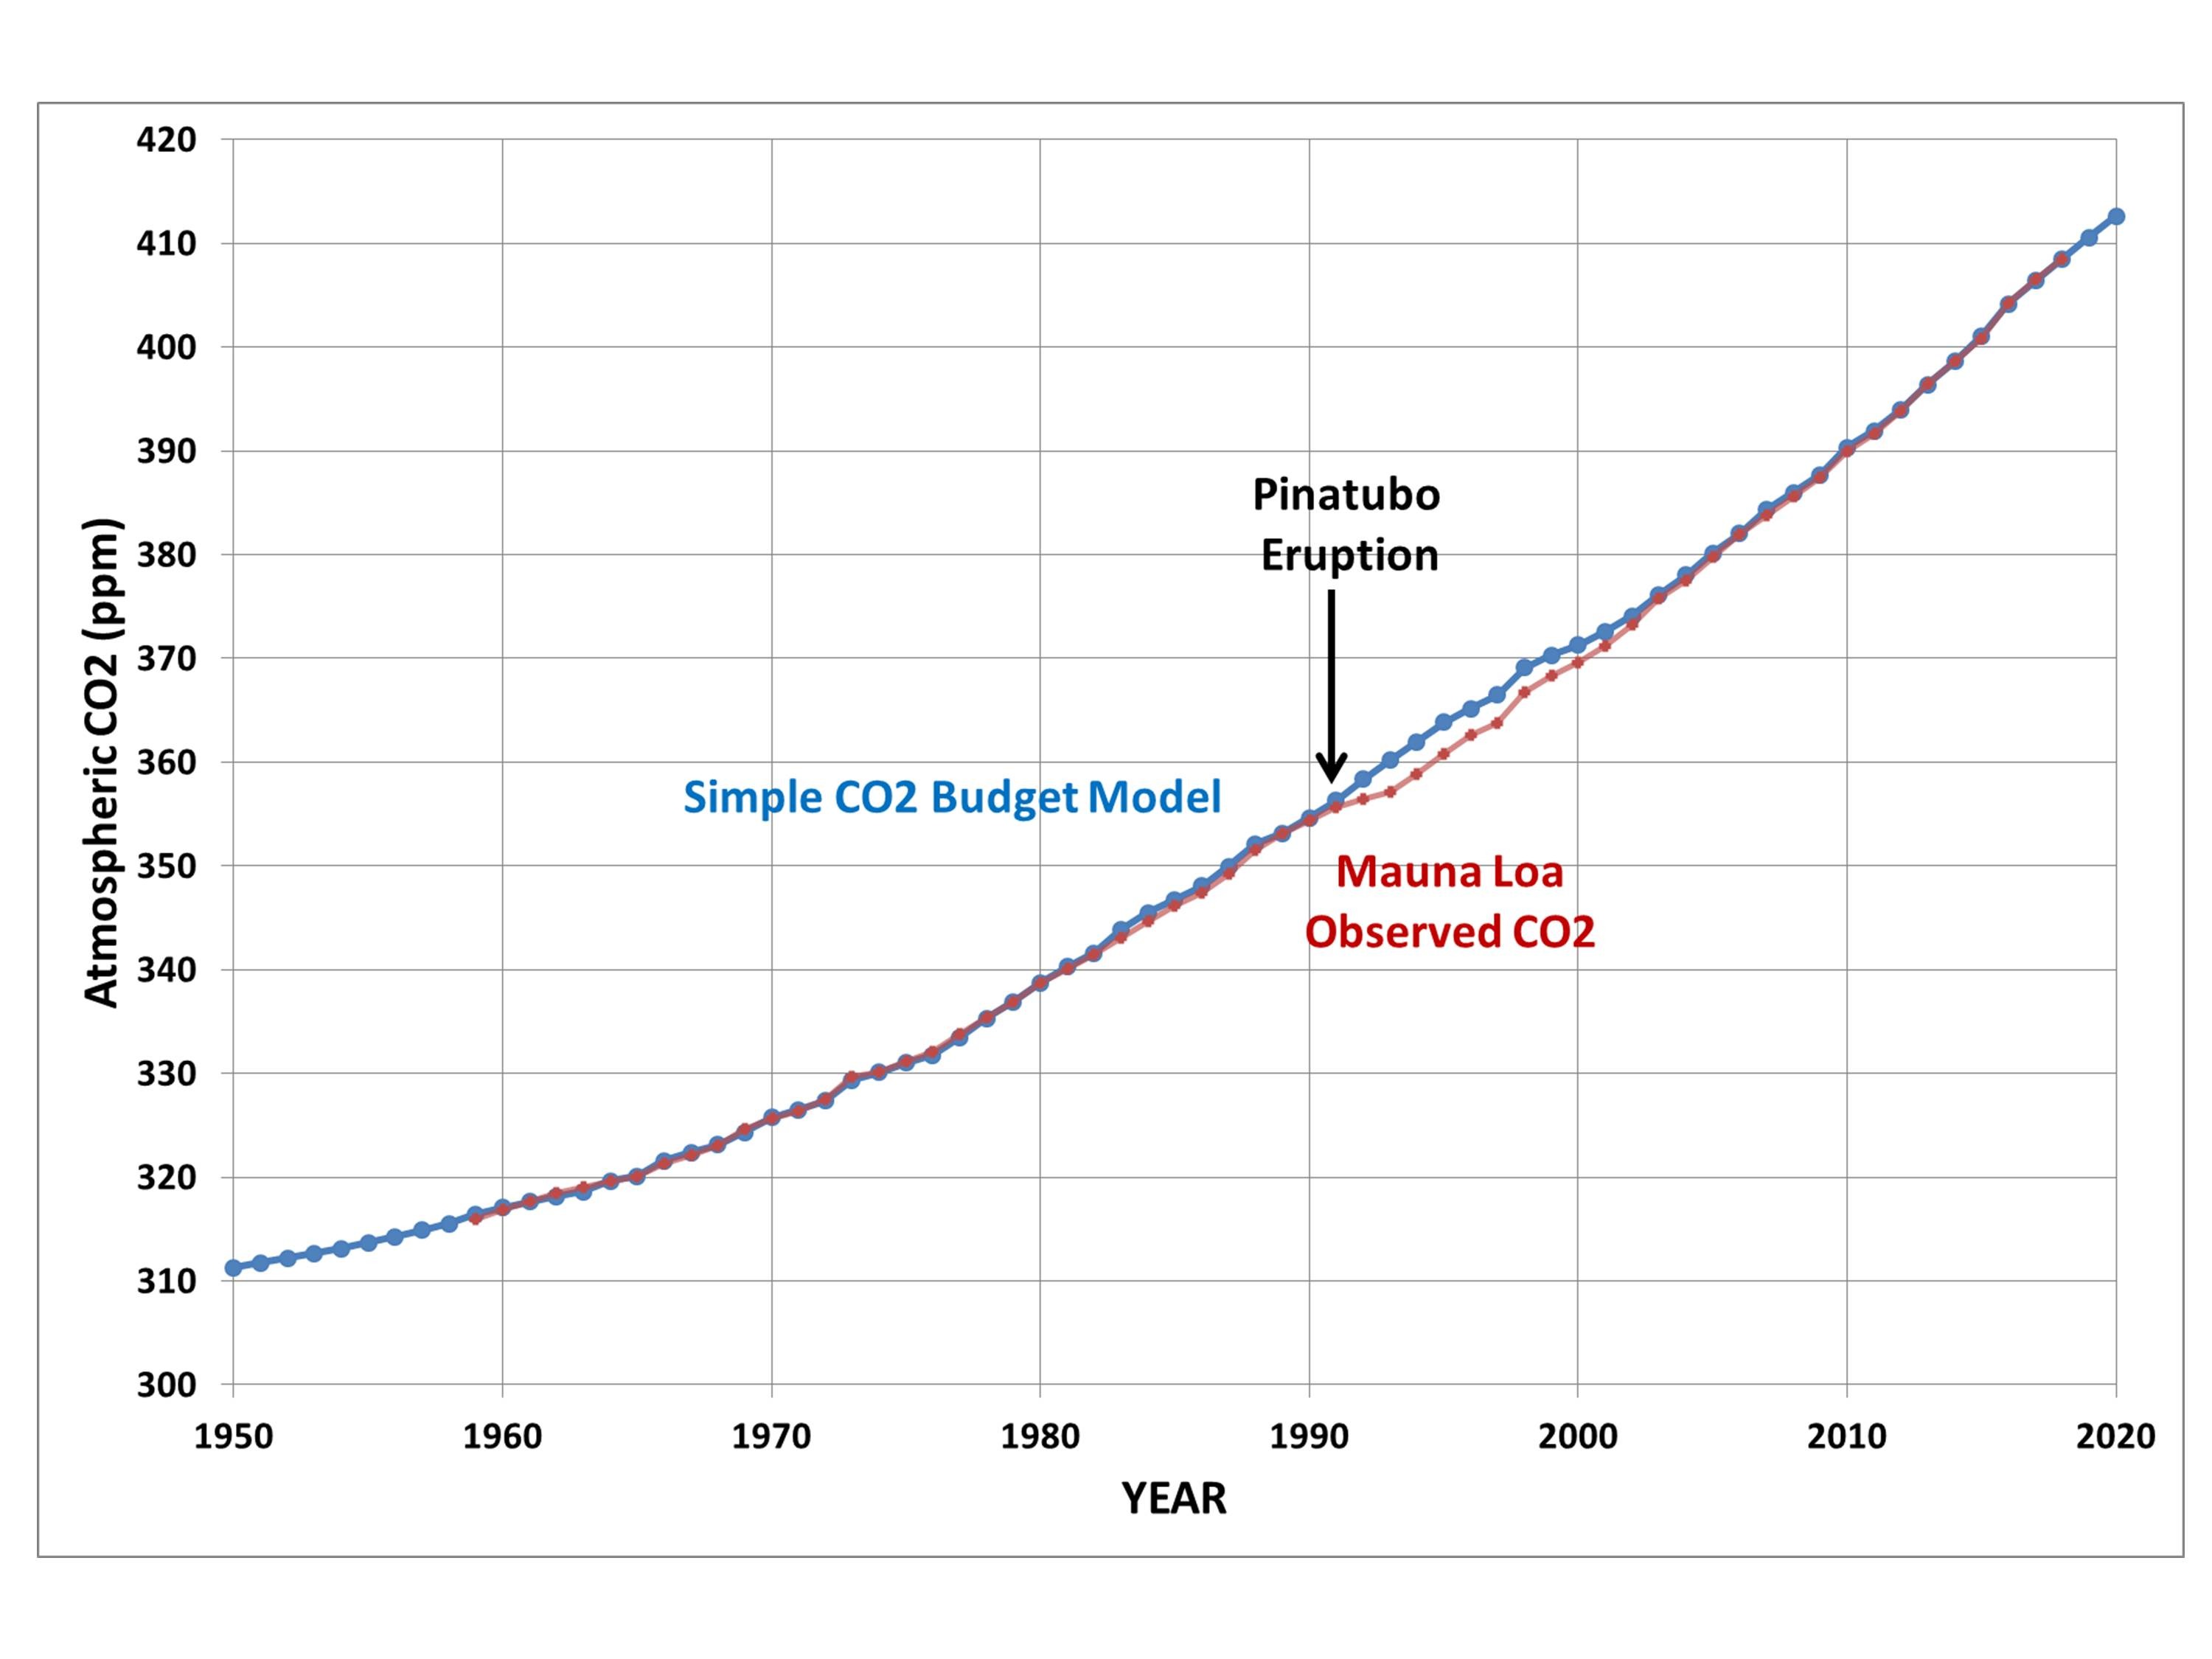
Eclectic continued, "nor do we have the luxury of time to sit back and observe another 40 years or so, as the Simple Model diverges from the (complex) real world."
Well, I obviously don't, at my age.
But mankind does have that luxury, and you should not expect Roy's Simple Model to diverge much from reality over the next 40 years. It is the "long, fat tail" (due to increased carbon levels in non-atmospheric reservoirs) which is not modeled by the Simple Model. Regardless of what happens with CO2 emission rates, CO2 removal over the next 40 years will be dominated by the removal mechanisms which the Simple Model models well.Eclectic continued, "the paleo evidence demonstrates the falsity of Spencer's too-simple Simple Model."
All models are false, but some are useful. Roy's Simple Model is very useful. It is a very good fit to measured reality, and it will continue to be a good fit as long as the CO2 removal mechanisms which are currently most important continue to be most important. When CO2 levels drop below 300 ppmv, and the accumulation of anthropogenic carbon in non-atmospheric reservoirs becomes an important factor affecting atmospheric CO2 levels, then his Simple Model will diverge from reality.
MA Roger wrote, "Yes, the oceans are big. Yes, the oceans contain contain sixty-times the carbon found in the pre-industrian atmosphere (which was in full equilibrium with the oceans). But what has that got to do with your "fact"?"
Mankind has increased CO2 level in the atmosphere by about 47%. We've increased carbon content in the oceans by only about 0.4%.
So, why does that matter? Because it is that accumulation of carbon in non-atmospheric reservoirs that is not modeled by Roy's Simple Model. In other words, his Simple Model assumes the other carbon reservoirs have infinite capacity.
That's a pretty good simplifying assumption, as long as the anthropogenic increase in atmospheric CO2 dwarfs the anthropogenic increase in carbon in other reservoirs. It will diverge from approximating reality during the "long, fat tail," when the anthropogenic increment in atmospheric carbon dioxide no longer dwarfs the anthropogenic increase in carbon in other reservoirs.
MA Roger wrote, "it is very odd that they would ever allow atmospheric levels to remain constant while the ocean absorbed a large constant flux of dissolving CO2."
Atmospheric levels will remain constant when transfer of carbon to the oceans and other carbon reservoirs removes CO2 from tha air as quickly as anthropogenic emissions are adding it. (They're currently removing it only about half as fast as we're adding it.)
MA Roger asked, "Have you actually examined the workings of Spencer's model?"
Of course.
MA Roger wrote, "If you set the future anthropogenic emissions to a fixed value... atmospheric CO2 levels tend to a constant value"
Which is, of course, correct.
MA Roger wrote, "while negative emissions, suck out 15Gt(C)/yr and by AD2191 the atmosphere is entirely denuded of CO2. daveburton, doesn't that strike you as "very odd"?"
Not at all. If you start with a physically impossible assumption, you get a physically impossible result. The only thing I can think of which could possibly remove a net 15 GtC/year from the atmosphere when CO2 levels are below 300 ppmv, is some idiot genetically engineering a fast-growing, fast-propagating C4 tree.
Please don't do that! The Earth doesn't need another K-T Extinction! - Residence Time and Prof Essenhigh
MA Rodger at 20:49 PM on 24 August, 2019daveburton @32,
Yes, the oceans are big. Yes, the oceans contain contain sixty-times the carbon found in the pre-industrian atmosphere (which was in full equilibrium with the oceans). But what has that got to do with your "fact"?
The ocean carbon content is a complex mix of carbonate species that populate our salty seas. The actual amount of dissolved carbon dioxide in the whole global ocean is a tiny portion of the total, perhaps 200Gt(C), less than a quarter of the carbon dioxide in the atmosphere. It is this alone that that the atmosphere directly balances with (this balance achieved only when it appears at the surface).
Given the complex set of carbonate species within the oceans and the complex ocean currents, it is very odd that they would ever allow atmospheric levels to remain constant while the ocean absorbed a large constant flux of dissolving CO2. (When I say "very odd" I mean it is utter nonsense.) And were it not so, the accepted scientific works on the subject would be themselves very odd.
Have you actually examined the workings of Spencer's model? (The spreadsheet of it is linked on this Spencer blogpage) If you set the future anthropogenic emissions to a fixed value (Spencer sets it to 10.109Gt(C)/yr) , atmospheric CO2 levels tend to a constant value:-
CO2[atm-ppm] = 195 + 20 x Emissions[GtC]
So drop emissions to zero and see the pre-industrial CO2 level restored in two centuries. while negative emissions, suck out 15Gt(C)/yr and by AD2191 the atmosphere is entirely denuded of CO2.
daveburton, doesn't that strike you as "very odd"?
- Residence Time and Prof Essenhigh
daveburton at 15:09 PM on 23 August, 2019Thanks, Mr. Moderator!
I'm sorry, I guess trying to post code in-line was just a bad idea. The tiny program is in this archive, as calc_est_co2_removal_rates_v02.pl along with everything else needed to run it under Windows, and some other stuff:
http://sealevel.info/CO2_Residence_Times/allfiles2.zip
Eclectic, Dr. Spencer's simple model is doubtless a good approximation of reality as long as CO2 levels are well above 300 ppmv, which corresponds to atmospheric CO2 levels and removal rates that are known with good accuracy. For CO2 levels below 315 ppmv (dates older than 1958) the numbers get fuzzier.
Did you notice the relatively high "natural equilibrium" level he found (295 ppmv)? That might reflect the anthropogenic additions to larger carbon reservoirs, like ocean and soil, and it might be evidence of the widely assumed "long, fat tail." - Residence Time and Prof Essenhigh
daveburton at 10:31 AM on 23 August, 2019Trying again, with explicit line-breaks added...
Mr. Moderator, I meant no offense, but I'm not aware of any comment policy that I violated, and I do not understand why you deleted so much of my comment.
MA Rodger, here's where the "about fifty year" practical residence/adjustment time comes from. Well, actually, a number of scientists have independently calculated approximately the same figure, but this is how I did it.
Start with the observation that the rate at which natural systems (oceans & terrestrial biosphere, mainly) remove CO2 from the air is governed chiefly by the CO2 level in the air. When the CO2 level is higher, so is the removal rate. When the CO2 level is lower, so is the removal rate.
Some people think the removal rate is governed by the emission rate, and that it's necessarily "about half" (leaving an "airborne fraction" which is also about half). They are mistaken. There is no physical mechanism by which any of the major contributors to the removal rate could be governed by the emission rate. It is the CO2 level, not the CO2 emission rate, which primarily governs the removal rate.
For the oceans, the removal mechanism is dissolution into surface water per Henry's Law, and then then transport to the ocean depths by currents and calcifying coccolithophores, and complex chemistry which is beyond my ken.
For the terrestrial biosphere it is "greening."
AR5 estimates that the terrestrial biosphere removes about (2.5/9.2) = 27% [p. 6-3] or 29% [Fig 6.1] of anthropogenic CO2 emissions from the atmosphere, each year, and that the oceans remove another 26% [Fig 6.1]. (There are wide error bars on those numbers, but the ≈55% sum has narrower error bars than the two addends have.)
Of course, other things also affect the CO2 removal rate, as is obvious, for example, from the detectable effect of very large volcanic erruptions on measured CO2 levels. But the most important factor governing the CO2 removal rate from the atmosphere is clearly the CO2 level in the atmosphere.
Those numbers are known, with fair precision. For the last sixty years we have very good records of both atmospheric CO2 levels and production/use rates of fossil fuels & cement (from which can quantify the main sources of anthropogenic CO2 emissions).
From those data we can calculate how much CO2 was removed from the atmosphere by natural sinks (oceans, biosphere, etc.), each year.
Since we also know the atmospheric CO2 level each year, we can easily build a spreadsheet, and fit a curve, showing the approximate net rate of CO2 removal as a function of the CO2 level.
Dr. Roy Spencer did that, and found it is very closely approximated by a very simple function, which you can read about here:
http://www.drroyspencer.com/2019/04/a-simple-model-of-the-atmospheric-co2-budget/
Using Dr. Spencer's "simple model," I wrote a tiny Perl program to simulate the effect on atmospheric CO2 level of a sudden cutoff of CO2 emissions. Counting 280 ppmv as "pre-industrial," 63% of the anthropogenic CO2 is gone from the atmosphere in 54 years, and 2/3 is gone in 60 years:#!/usr/bin/perl
# estimate CO2 removal rate in ppmv/yr as a function of CO2 level in ppmv,
# per Dr. Roy Spencer's "simple model"
# ref: http://www.drroyspencer.com/2019/04/a-simple-model-
# of-the-atmospheric-co2-budget/
sub removal_rate {
local($co2level) = shift;
local($removalrate) = 0;
local($co2elevation) = $co2level - 295.1;
local($ratio) = 47.73;
if ($co2level <= 295.1) {
$removalrate = 0;
} else {
$removalrate = $co2elevation * 0.0233;
}
return $removalrate;
}
# SIMULATE DECLINE IN CO2 LEVEL IF EMISSIONS SUDDENLY WENT TO ZERO
$co2level = 410;
$year = 2019;
print "Simulated CO2 level decline, with level starting at
$co2level ppmv in $year, and zero emissions:\n";
while ($co2level > 300) {
printf("$year %5.1f\n", $co2level);
$year += 1;
$removalrate = &removal_rate( $co2level );
$co2level -= $removalrate;
}
Here's the result of a simulation run, with CO2 starting at 410 ppmv in 2019, and zero emissions:
2019 410.0
2020 407.3
2021 404.7
2022 402.2
2023 399.7
2024 397.2
2025 394.8
2026 392.5
2027 390.3
2028 388.0
2029 385.9
2030 383.8
2031 381.7
2032 379.7
2033 377.7
2034 375.8
2035 373.9
2036 372.1
2037 370.3
2038 368.5
2039 366.8
2040 365.1
2041 363.5
2042 361.9
2043 360.4
2044 358.8
2045 357.3
2046 355.9
2047 354.5
2048 353.1
2049 351.7
2050 350.4
2051 349.1
2052 347.9
2053 346.6
2054 345.4
2055 344.3
2056 343.1
2057 342.0
2058 340.9
2059 339.8
2060 338.8
2061 337.8
2062 336.8
2063 335.8
2064 334.9
2065 333.9
2066 333.0
2067 332.2
2068 331.3
2069 330.4
2070 329.6
2071 328.8
2072 328.0
2073 327.3 <== residence/adjustment time (e-folding time) = 54 years (using 280 ppmv as base)
2074 326.5
2075 325.8
2076 325.1
2077 324.4
2078 323.7
2079 323.0 <== two-thirds of the anthropogenic CO2 is gone in 60 years (using 280 ppmv as base)Of course we know that this simple model would not accurately model the "long, fat tail," with CO2 levels under 300 ppmv. But the point I made previously is that, for practical purposes, that doesn't matter, because we all know that CO2 levels that low are harmless.
- Residence Time and Prof Essenhigh
MA Rodger at 05:09 AM on 23 August, 2019daveburton @24,
You seem to think that the (410-280=) 130ppm anthropogenic CO2 increase in the atmosphere would drop by 63% over a period of "about 50 years" (according to daveburton @22) and presumably conclude that today's CO2 levels would leave us with (280+0.37x130=) 330ppm after that time period. Even if your talk of e-folding time were applicable to the draw-down period of CO2 from the atmosphere, I don't think this use of the 63% is correct.
The anthropogenic emissions total 650Gt(C), enough to raise atmospheric levels from 280ppm to 585ppm if it were emitted all at once. The 410ppm in today's atmosphere has thus already lost 43% of its added CO2 and if emissions stopped today we could expect something like a further 37% reduction over 1,000 years, leaving perhaps a level of 340ppm in AD3000. And there it will stop for tens of thousands of years if natural processes are allowed to run their course.
While I have no inkling what you are considering with this multiplier of 20x for (20x50years=) 1,000 years residency time, I do wonder how it should be re-calculated for a residency time of tens of thousands of years now we will be leaving CO2 above your threshold 340ppm level for such long periods.
- Residence Time and Prof Essenhigh
daveburton at 02:21 AM on 23 August, 2019Paul Pukite, it appears that you've missed my point. Don't you know what "from a practical perspective" means?
I thought this was clear, but I guess not: "Since I don't think anyone believes that a CO2 level of 320 or 340 ppmv could have any deleterious effects (compared to 275 or 280), the long tail (representing CO2 levels below 330 ppmv) should be disregarded."
Let me try again to explain it.
The folks who claim very long anthropogenic CO2 residence times (or adjustment times, if you prefer) do so to magnify the supposed harmful effects of elevated CO2 levels. It is a key parameter when calculating the so-called "social cost of carbon," used to set things like carbon tax levels and offset prices.
It is not a minor consideration. A 1000-year residence time is used to justify 20x the tax rate of a 50-year residence time.
Are you with me so far?
But everyone, even the most fervent alarmists, agree that there are no harmful effects from CO2 levels "elevated" to less than, say, 340 ppmv. So, since that "long, fat tail" represents CO2 levels below 330 ppmv, it is obviously a mistake to use it to magnify the supposed harms of CO2 emissions.
In the CO2 decay curve, the first e-folding time reduces the anthropogenic CO2 increment by about 63%. I think everyone understands that there are no plausible harms from CO2 levels that low. All that matters is the first e-folding time, which is about fifty years. - Residence Time and Prof Essenhigh
Paul Pukite at 00:58 AM on 21 August, 2019DaveBurton said:
"Some folks claim much longer residence times for anthropogenic CO2, but, from a practical perspective, they're wrong"
The residence time should actually be called an adjustment time and because of the fat-tail physics of diffusion, the value of that time is actually indeterminate and can be considered to be hundreds or thousands of years.
This is basic condensed matter physics and you can read more about this topic in our book Mathematical Geoenergy and specifically in Chapter 9 Section 6.
The issue with people like Dave Burton is that they have probably only encountered 1st-order models in their technical experience, and that's why they bring up concepts like "the first e-folding time" which is a dead giveaway to their lack of broader scientific knowledge.
More than 100 comments found. Only the most recent 100 have been displayed.
More than 100 comments found. Only the most recent 100 have been displayed.


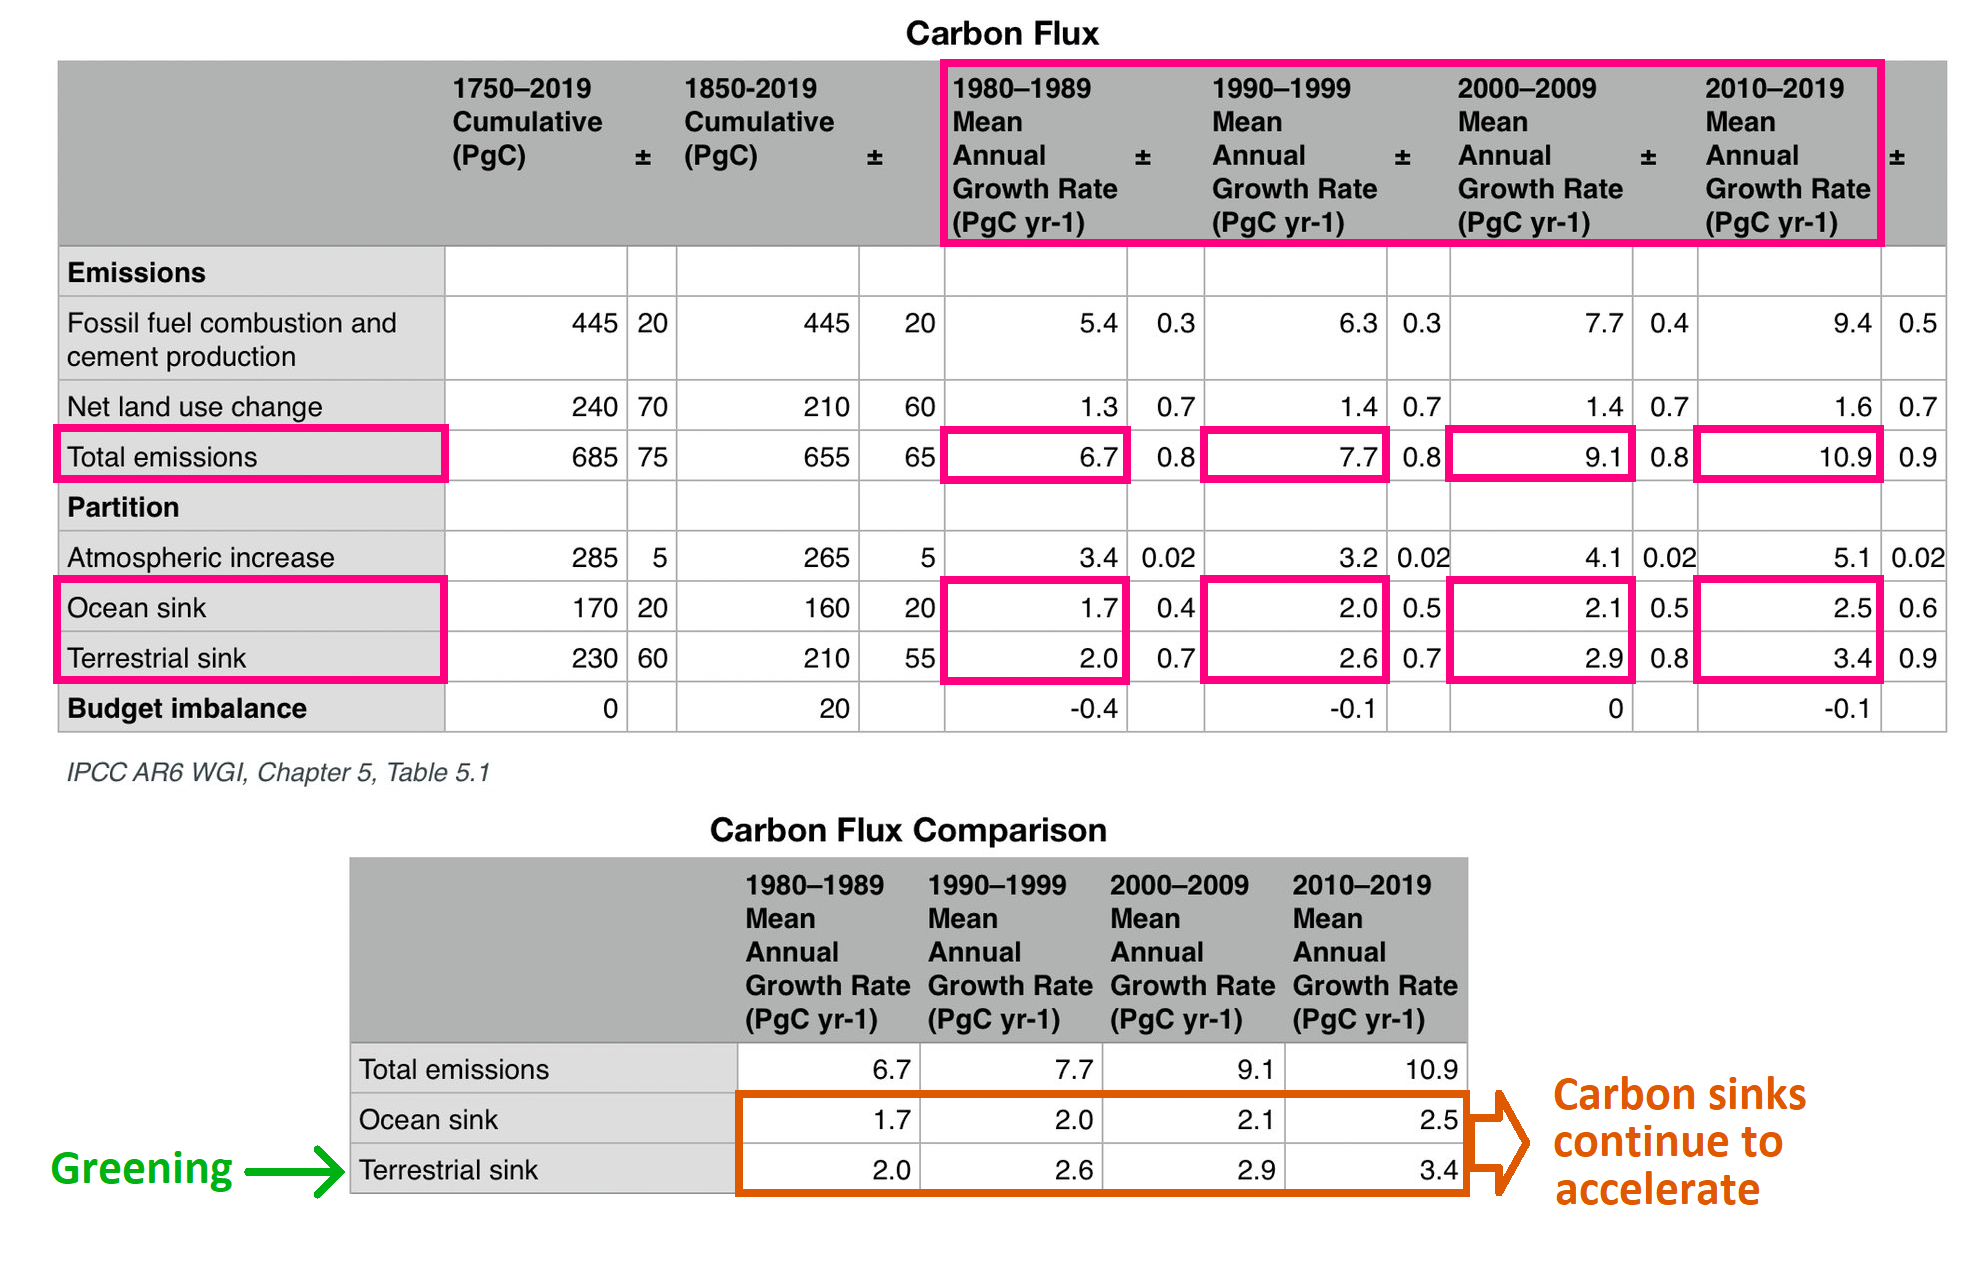
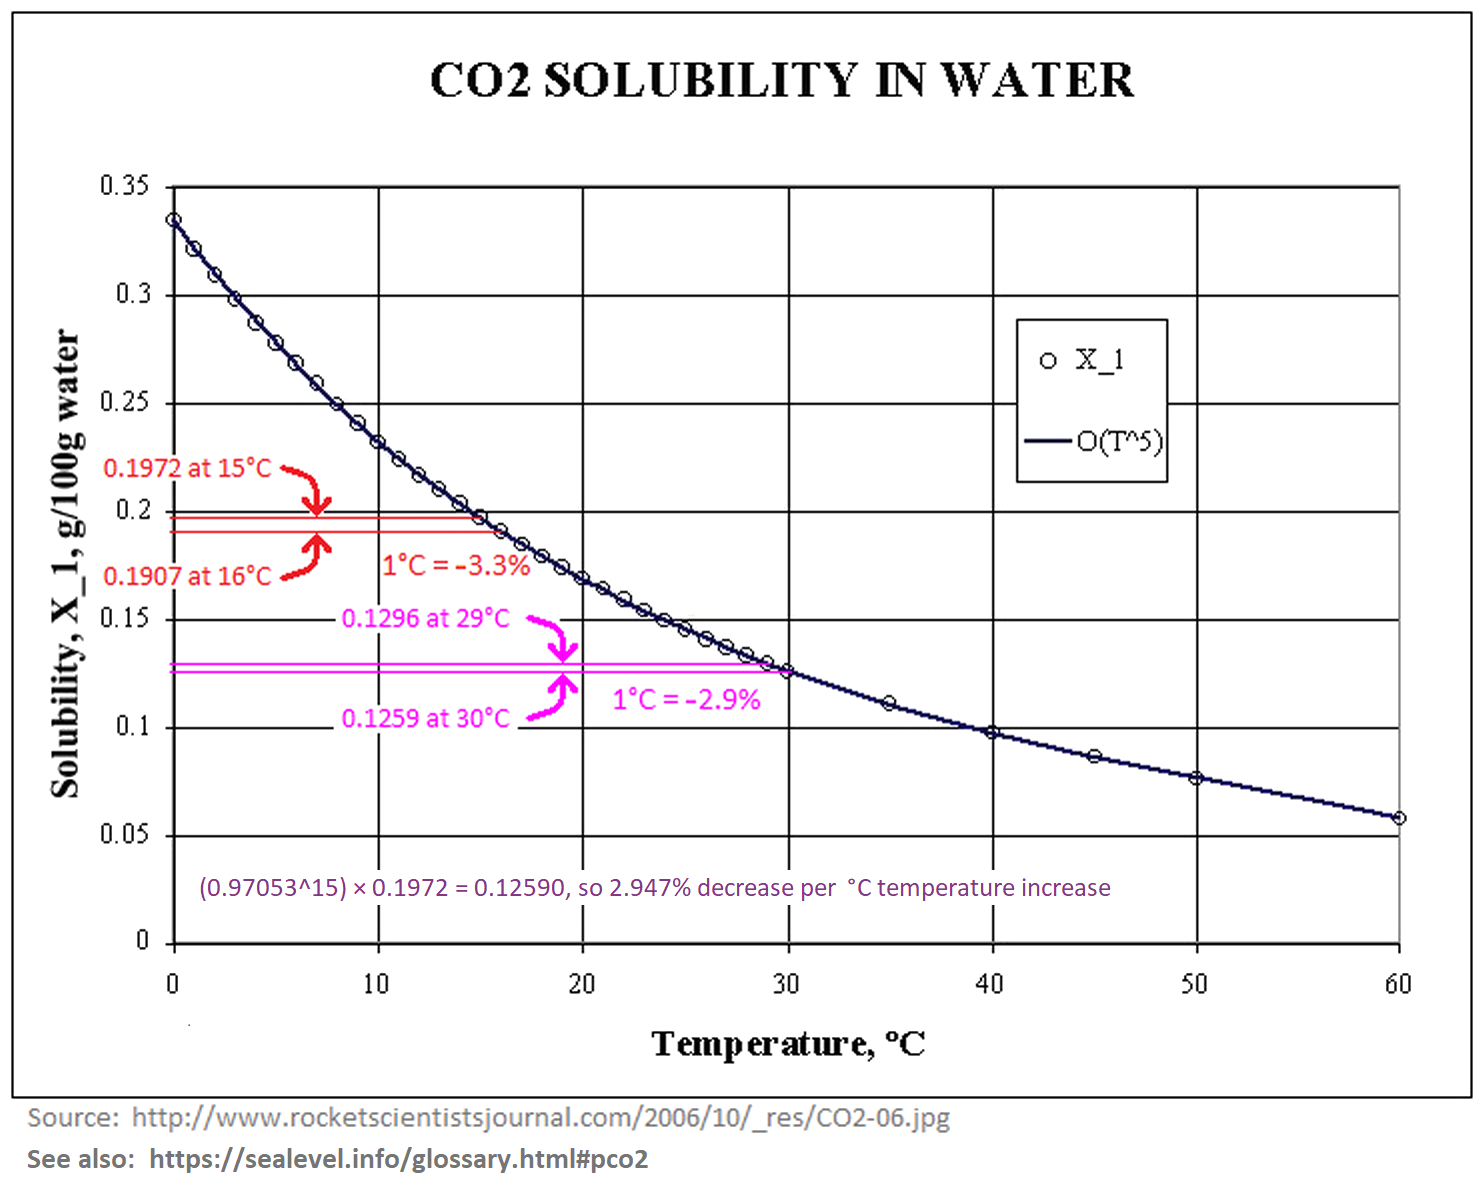
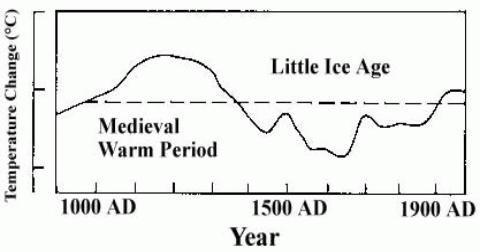
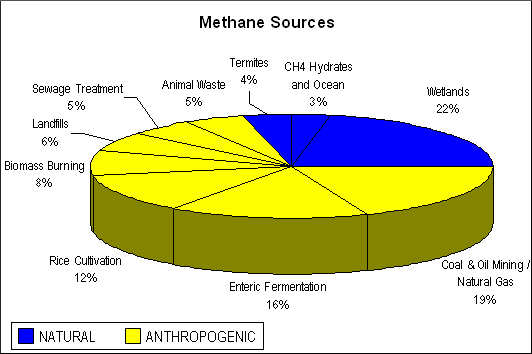
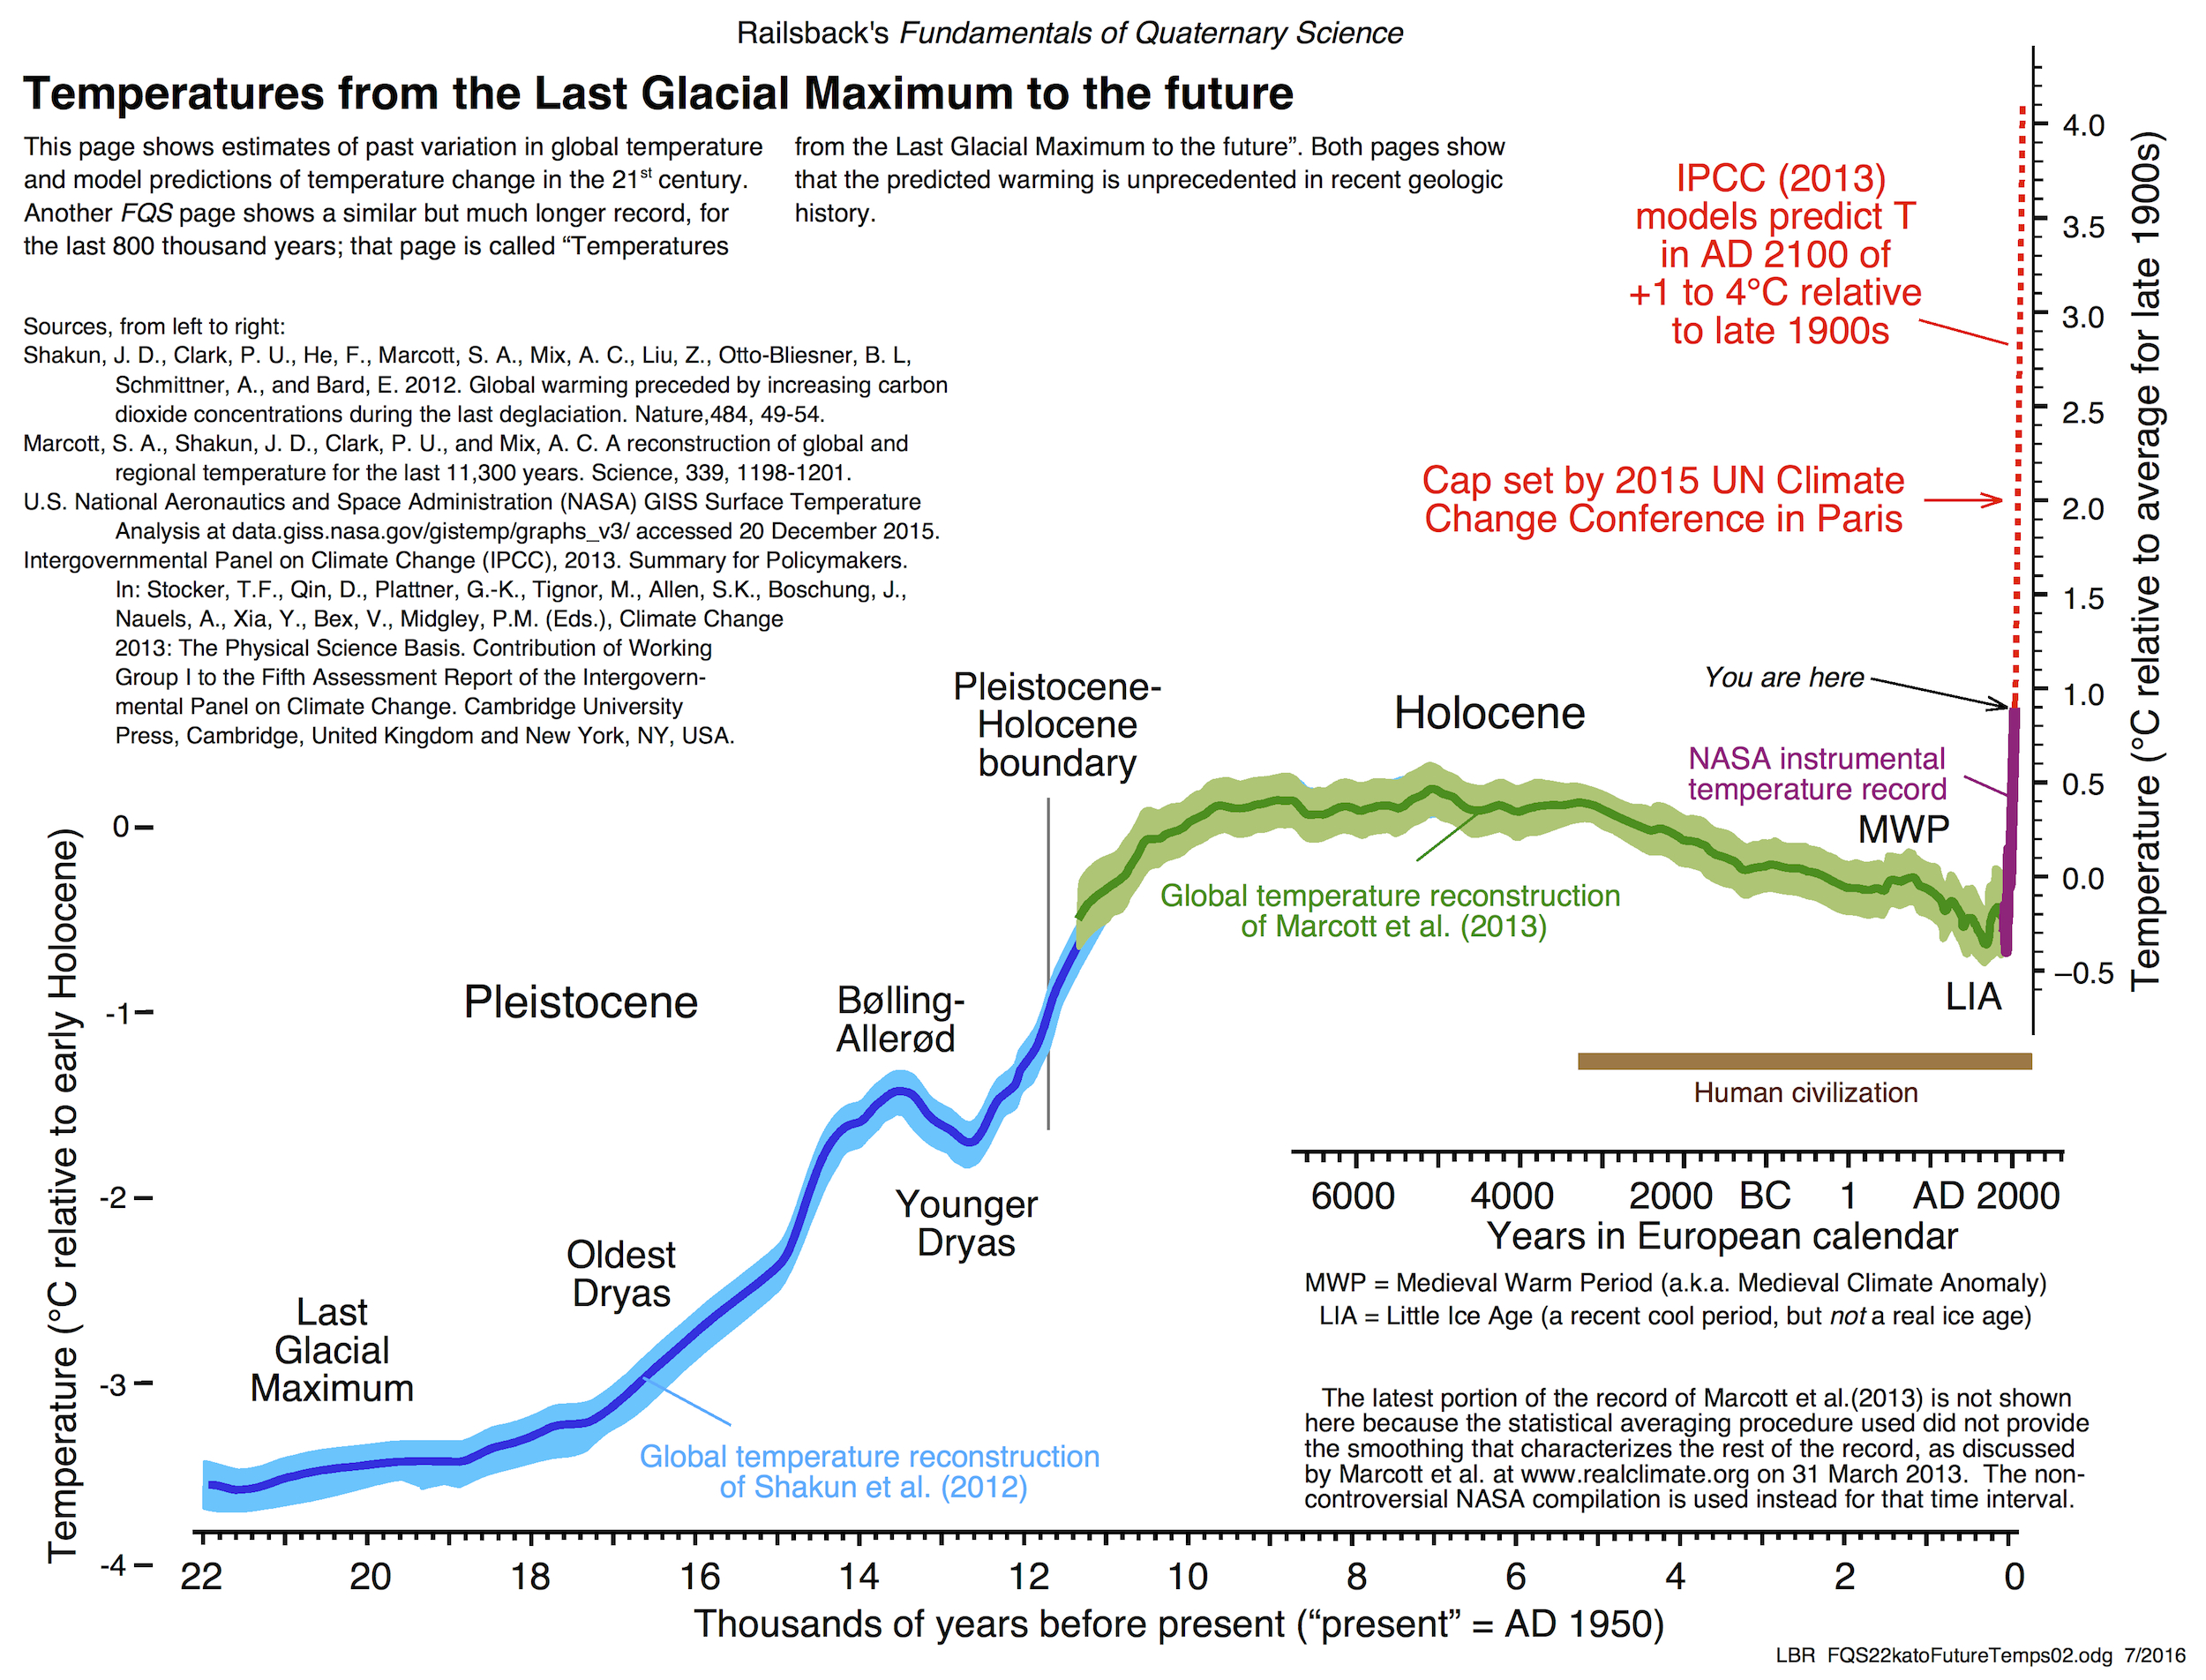
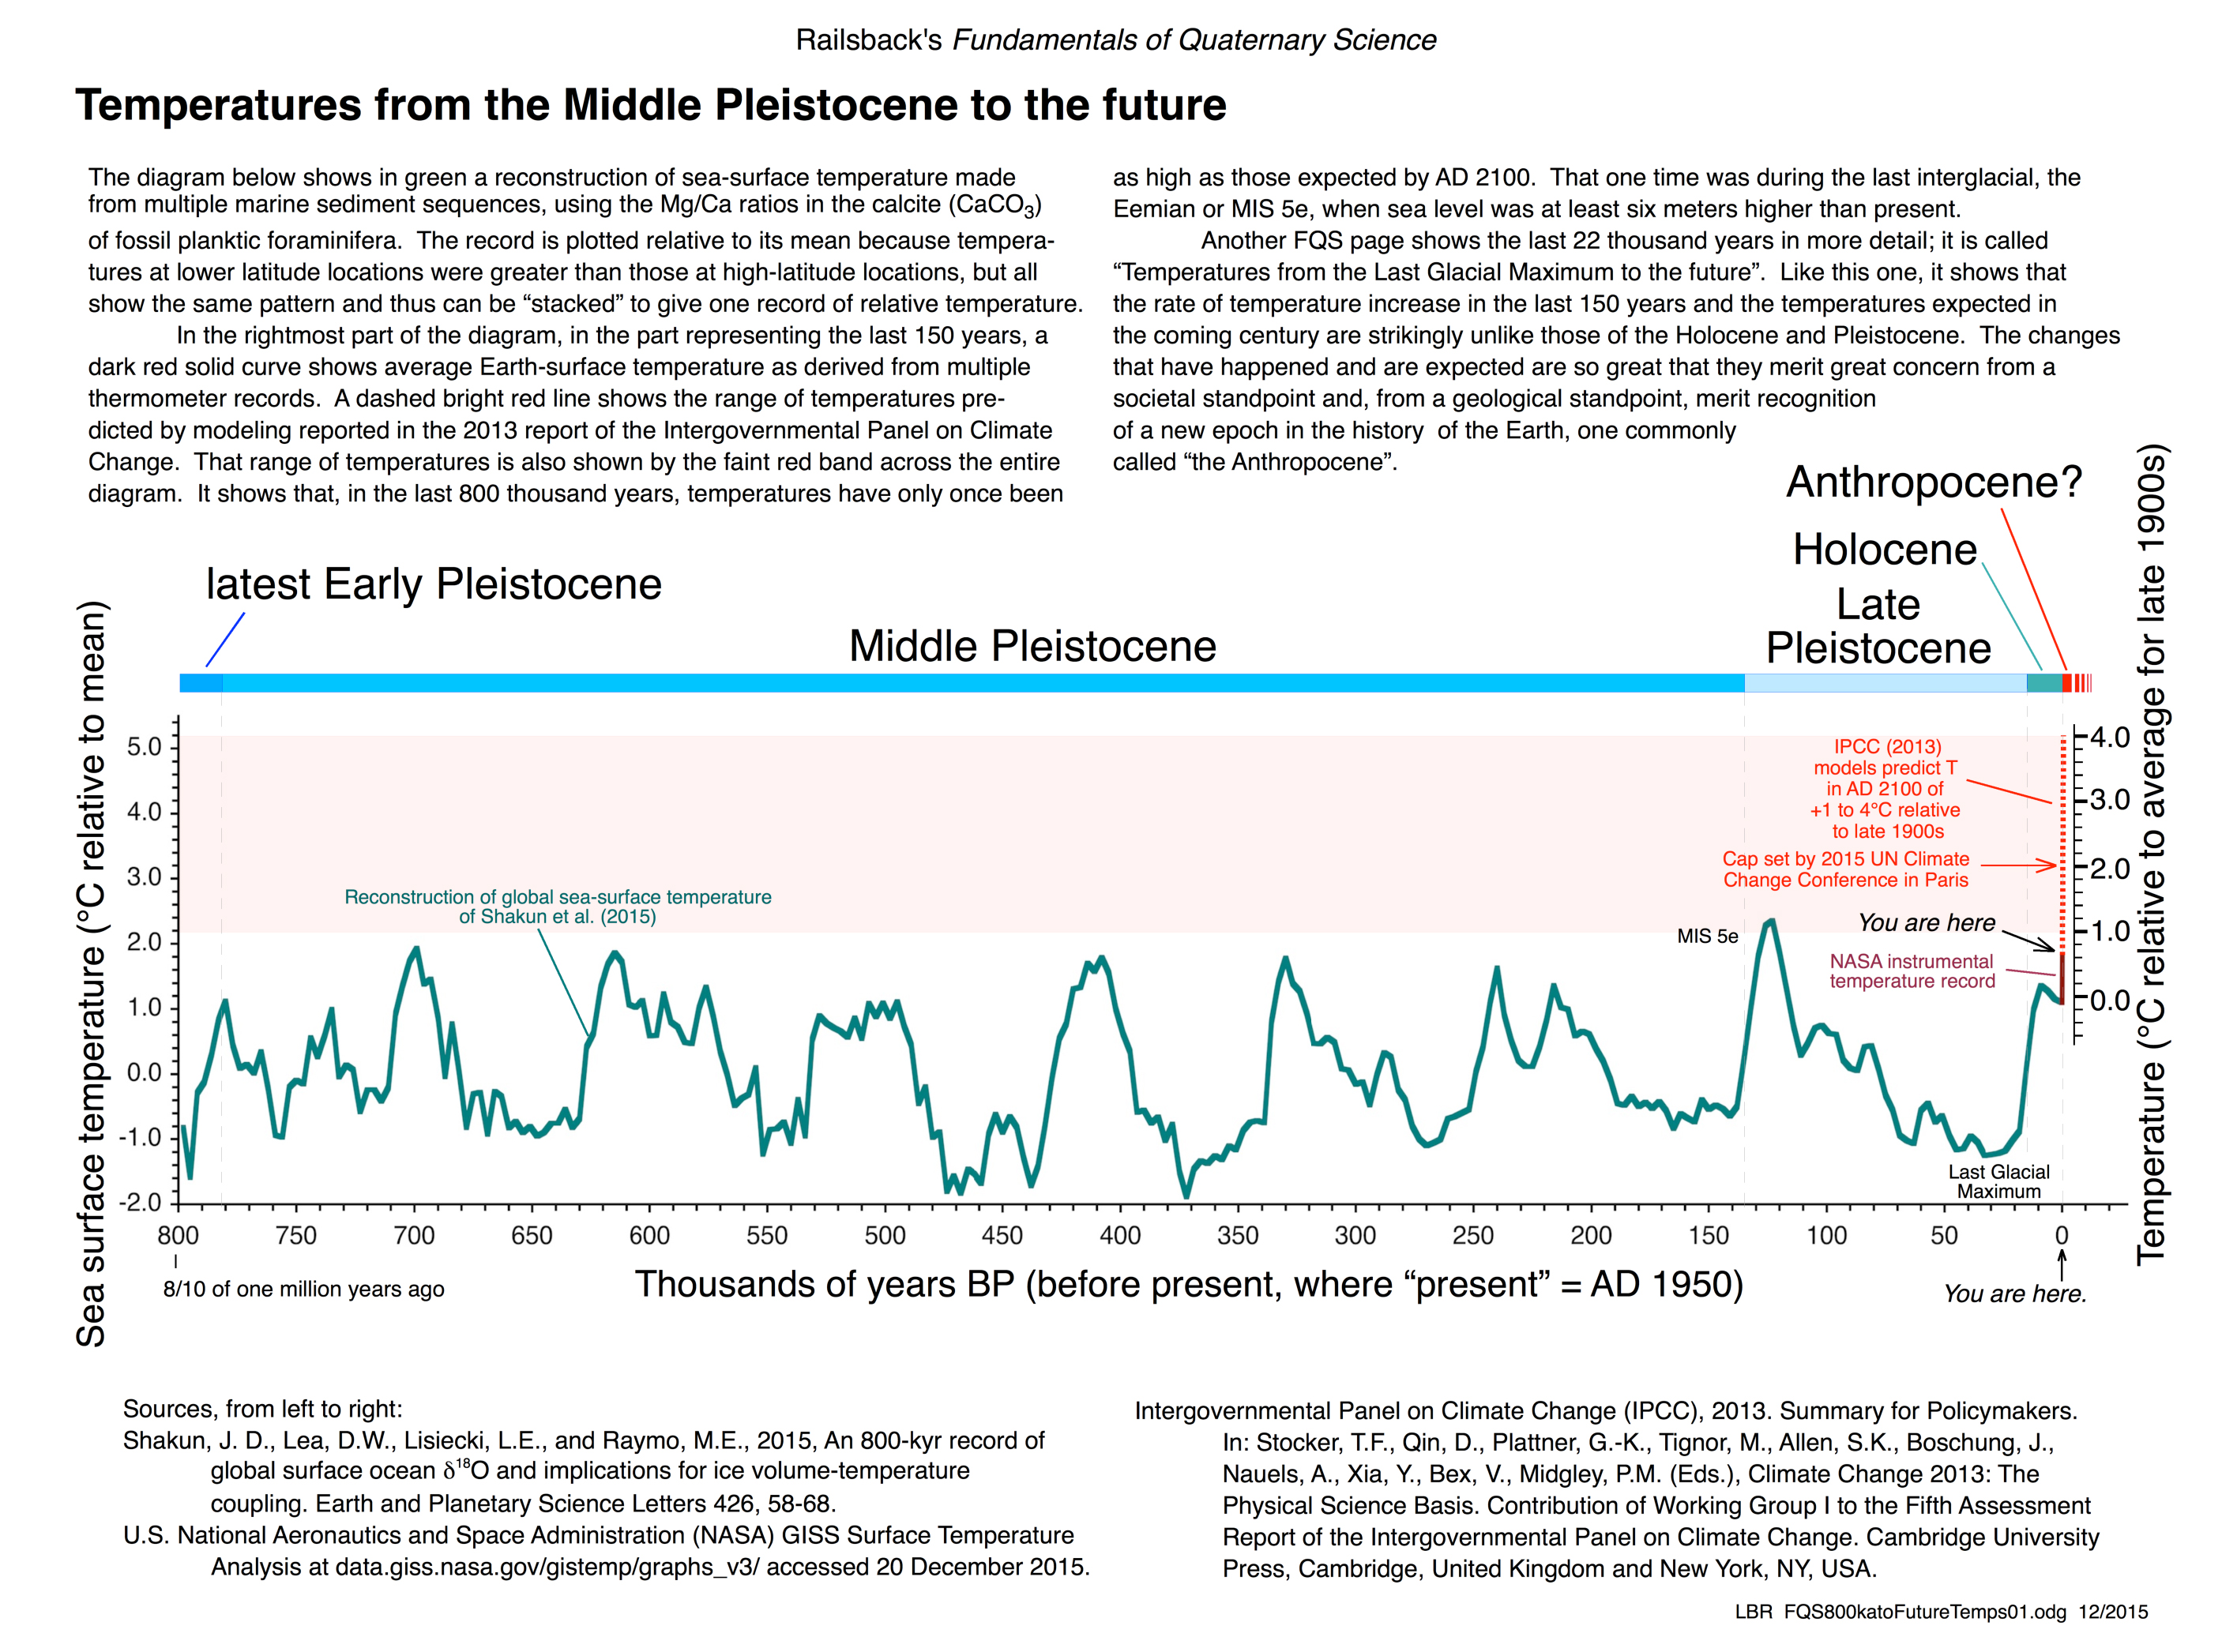
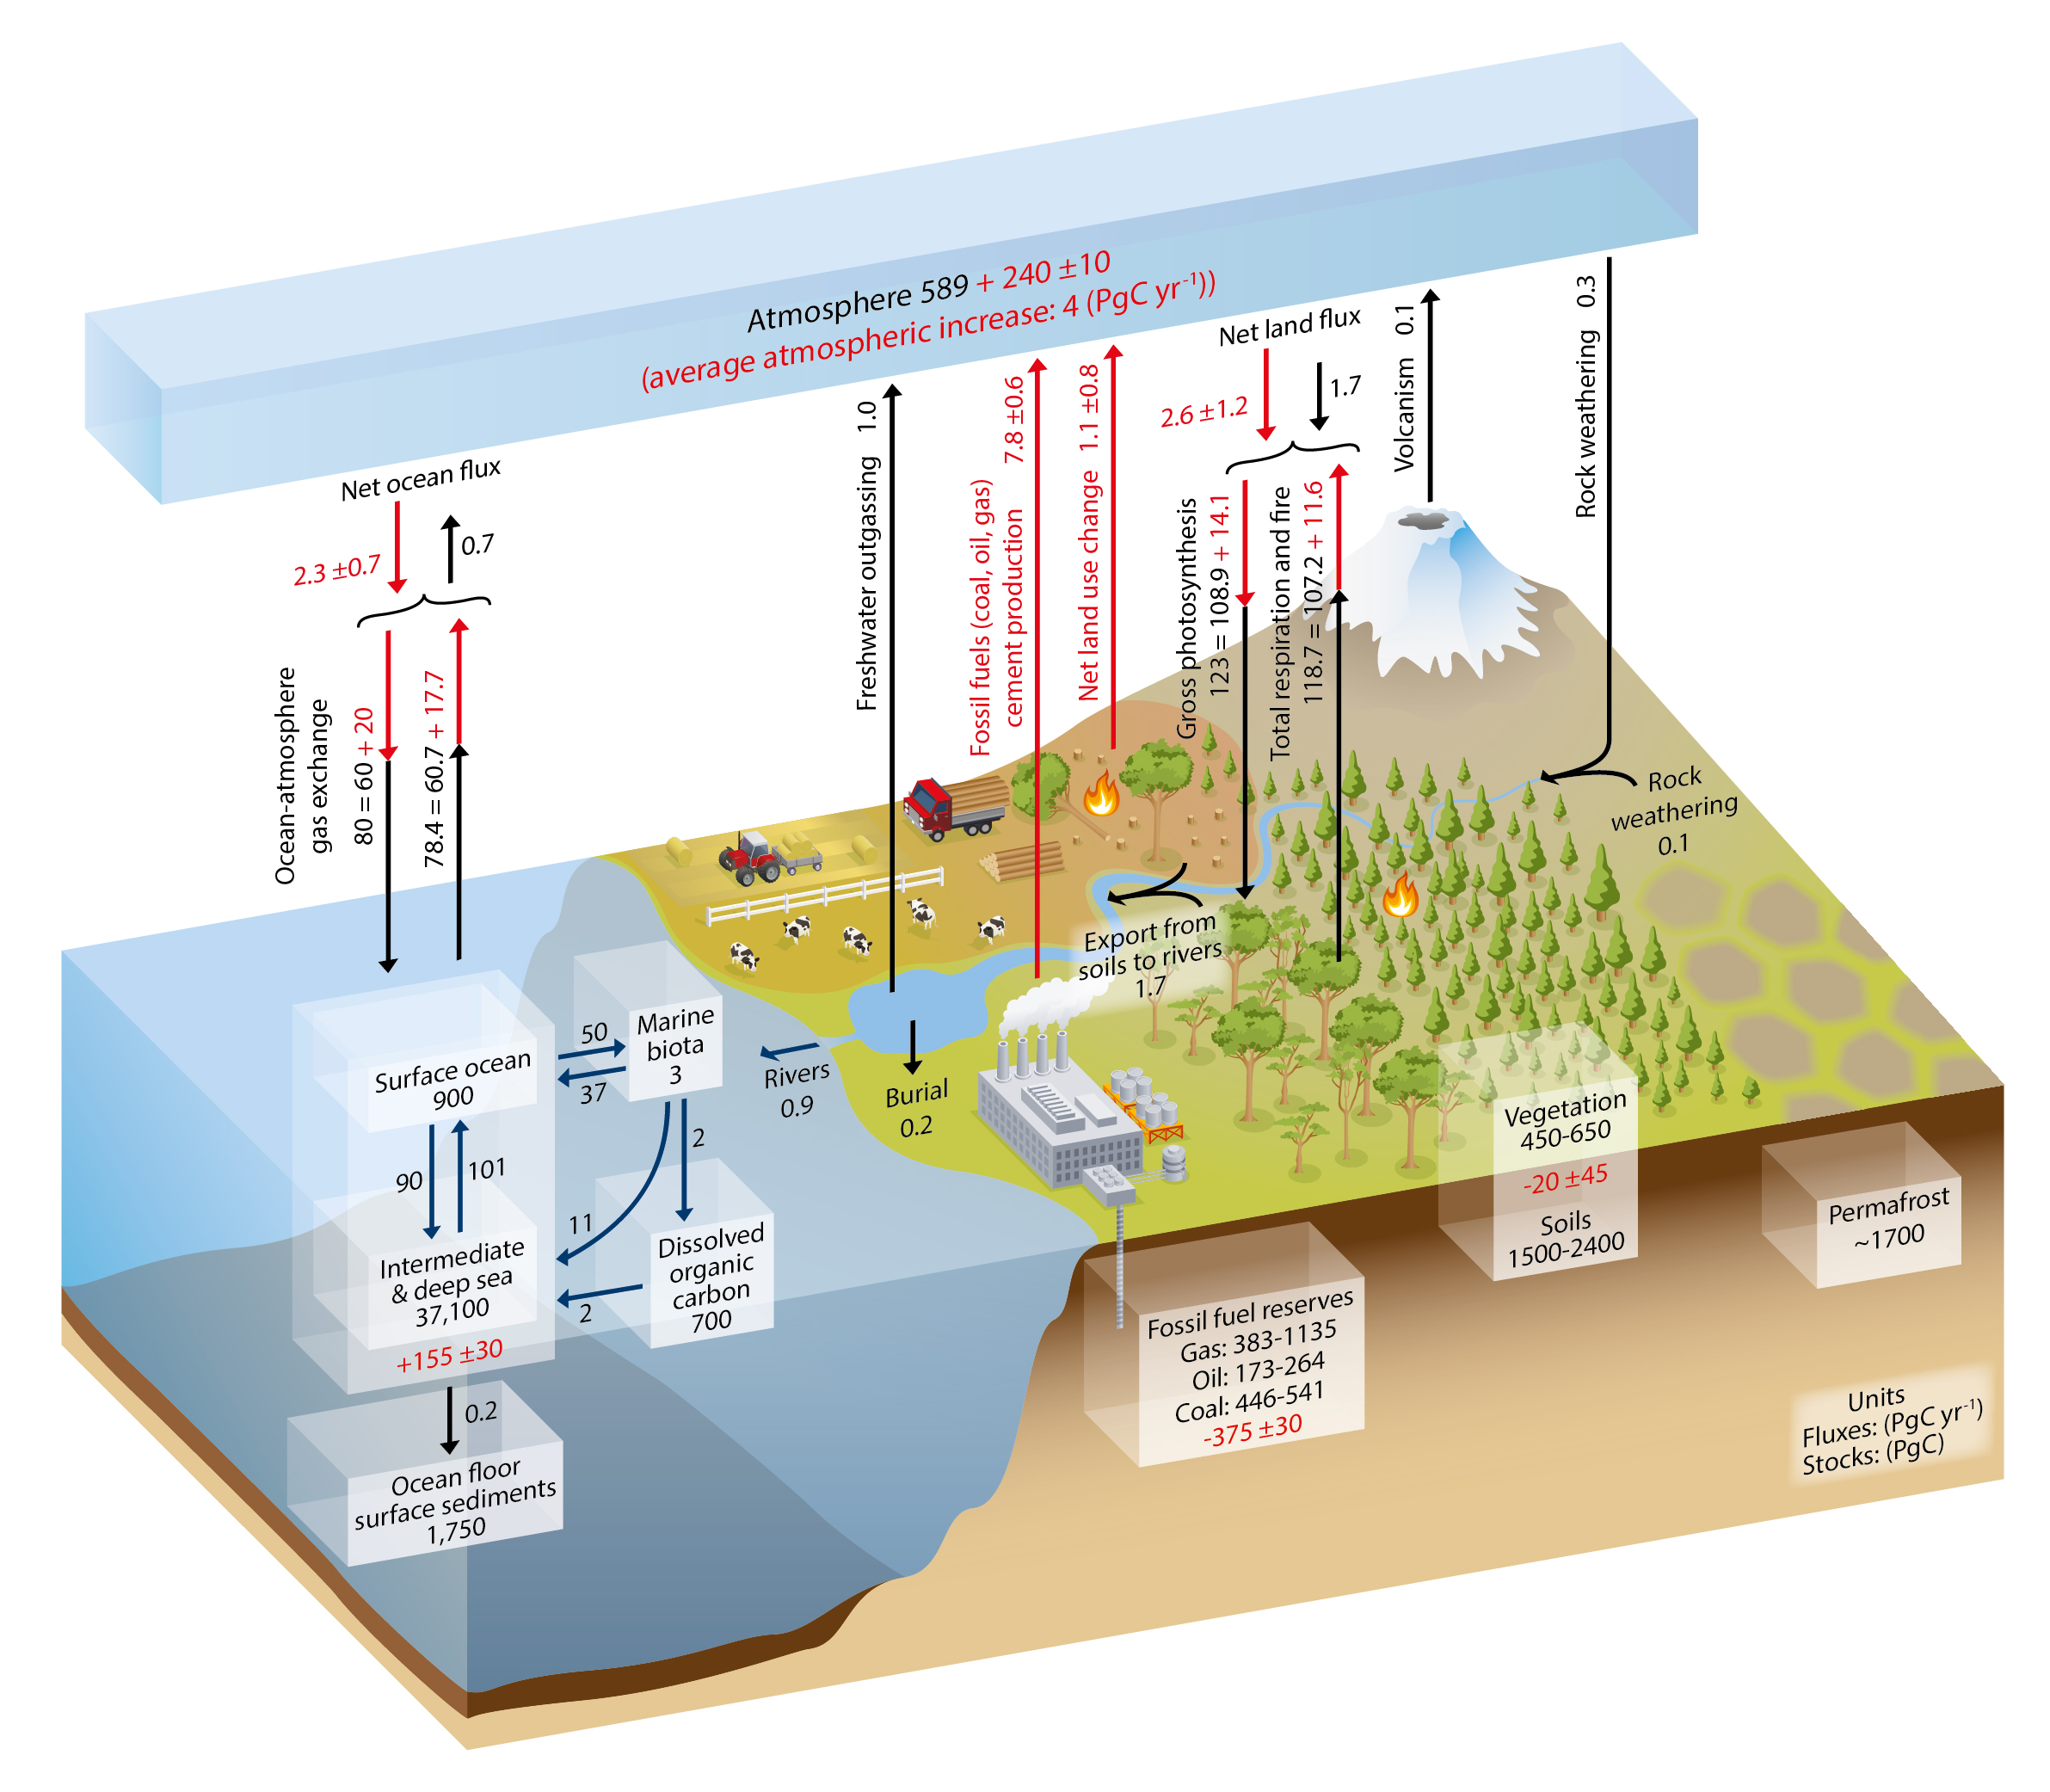
THE ESCALATOR

(free to republish)