


 Arguments
Software
Resources
Comments
The Consensus Project
Translations
About
Support
Arguments
Software
Resources
Comments
The Consensus Project
Translations
About
Support
![]()
![]()
![]()
![]()
![]()
![]()
![]()
![]()
![]()
![]()


![]()


Latest Posts
- Skeptical Science New Research for Week #18 2024
- At a glance - Clearing up misconceptions regarding 'hide the decline'
- Pinning down climate change's role in extreme weather
- 2024 SkS Weekly Climate Change & Global Warming News Roundup #17
- Fact Brief - Is Antarctica gaining land ice?
- Simon Clark: The climate lies you'll hear this year
- Skeptical Science New Research for Week #17 2024
- Water is at the heart of farmers’ struggle to survive in Benin
- At a glance - The difference between weather and climate
- India makes a big bet on electric buses
- 2024 SkS Weekly Climate Change & Global Warming News Roundup #16
- EGU2024 - An intense week of joining sessions virtually
- Skeptical Science New Research for Week #16 2024
- How extreme was the Earth's temperature in 2023
- At a glance - Is the science settled?
- What is Mexico doing about climate change?
- 2024 SkS Weekly Climate Change & Global Warming News Roundup #15
- Fact Brief - Did global warming stop in 1998?
- Skeptical Science New Research for Week #15 2024
- EGU2024 - Picking and chosing sessions to attend virtually
- At a glance - The Pacific Decadal Oscillation (PDO) is not causing global warming
- Climate Adam: Is Global Warming Speeding Up?
- 2024 SkS Weekly Climate Change & Global Warming News Roundup #14
- Gigafact and Skeptical Science collaborate to create fact briefs
- Skeptical Science New Research for Week #14 2024
- How can I make my retirement plan climate-friendly?
- At a glance - Global warming and the El Niño Southern Oscillation
- A data scientist’s case for ‘cautious optimism’ about climate change
- 2024 SkS Weekly Climate Change & Global Warming News Roundup #13
- Skeptical Science New Research for Week #13 2024
Comment Search Results
Search for david evans
Comments matching the search david evans:
- 2022 SkS Weekly Climate Change & Global Warming News Roundup #46
One Planet Only Forever at 12:42 PM on 15 December, 2022EddieEvans @11,
There is indeed serious ethical concern regarding the actions of someone like E.E. David, Jr. But the more serious ethical concerns are people in leadership roles (in Exxon, other businesses, and Government) who choose to be influenced by harmful misunderstandings presented by people like E.E. David, Jr.
I recommend focusing more on the behaviour of Leaders.
The common sense understanding should be that leaders need to be ethically responsible for: paying attention, learning to limit harm done, and helping to make amends for harm done. Leaders who are not 'ethical in that sense’ will fail to develop sustainable improvements (in business or government). Leaders choosing to compromise their judgment because of ‘other interests’ (like popularity or profitability), will most likely make harmful decisions and fail to produce lasting benefits (because the harm being done gets harder to hide or excuse).
I try to focus on the need for ethical governing/limiting of harmful impacts, with ‘ethics’ being understood to be about limiting harm done and helping to correct for harm done. It leads to understanding that ‘it would be great if everyone self-governed that way’.
Everyone pursuing increased awareness and understanding of what is harmful and trying to help minimize and repair harm done is clearly a fantasy. There will always be some people trying to hide or excuse harm done because of benefits obtained (by them or their group). That is the absurd result of ‘ethical perspectives’ claiming to seek things like ‘the Greatest Good’ (like Utilitarianism). That type of thinking can justify ‘an individual (or group) obtaining massive benefit to the detriment of all others’ (they are shown to be self-defeating theories by Derek Parfit’s ethical evaluations in “Reasons and Persons” published in 1984 – cited more than 14,000 times. Parfit’s presentation includes ‘responsibility towards future generations’).
Clearly there will always be a need for people who will not responsibly ethically self-govern to be 'Governed and limited by Ethical Others'. The problem becomes more challenging when ‘ethically compromised’ competitors win significant leadership influence through popularity or profitability.
That is a long way of saying that “What happened at the leadership levels regarding climate science was most likely the result of unethical people winning significant influence over leadership”. The result was probably not because of the actions of people who present misunderstandings. The problem is leaders who seek out and act based on harmful misunderstandings. The people developing harmful misunderstanding share in the blame. But decision-makers who seek out, and allow themselves to believe, harmful misunderstandings are the root of the problem. And that systemic problem has to be corrected to develop sustainable improvements.
Also, in case there was a misunderstanding, I wish to clarify that the Sustainable Development Goals include Climate Change. In addition to Climate Action being identified as Goal 13, limiting Climate Change impacts makes it easier to achieve, and improve on, many of the other SDGs.
- There's no tropospheric hot spot
MA Rodger at 19:23 PM on 23 August, 2022Cedders @33,
And having had a read of that PDF...
Cedders @33,
Having examined the PDF (16 pages not 24), it is quite evident that it is a pile of utter nonsense, a "welcome to the lunatic asylum" message and not anything in any way scientifically-based.
The author is Piers Corbyn, a well-kown denialist and an elder brother of Jeremy Corbyn (a long-serving left-wing Labour MP who bizarrely gained the heady position of Leader of the Labour Party for 4½ years).
Piers Corbyn is described in Wikithing as "an English weather forecaster, businessman, anti-vaxxer and conspiracy theorist" and does feature here at SkS being (1) Cited within a spot of denialism of 2015 in the Daily Express tabloid/comic, (2) The main source of a pile of climate nonsense of 2013 from the then Mayor of London Alexander Boris von Pfiffle Johnson, a man now renowned throughout the known world for not being particularly truthful, (3) Listed here at SkS as a denialsit with zero peer-reviewed writings.
The 16 page thesis linked up-thread @33 is a 2019 thesis presented to the Reading University Debating Journal and sitting at the top of a list of 24 such theses posted 2018-19, top of the list because it is the most recent (the journal lasted less than a year), a list which addresses such important topics as 'Why Self-Service Checkouts are the Invention of the Devil' and 'The Great University of Reading Catering Con: Man Shall Not Live off Sandwiches Alone' and an anonymous piece 'Why I Support the Conservatives: The Most Successful Party in British History'.
The Piers Corbyn thesis begins by citing David Legates' dismissal of the 97% AGW consensus before dismissing that because "it is about facts; and no Global-Warming Inquisition is going to prevent me exposing their nonsensical theories."
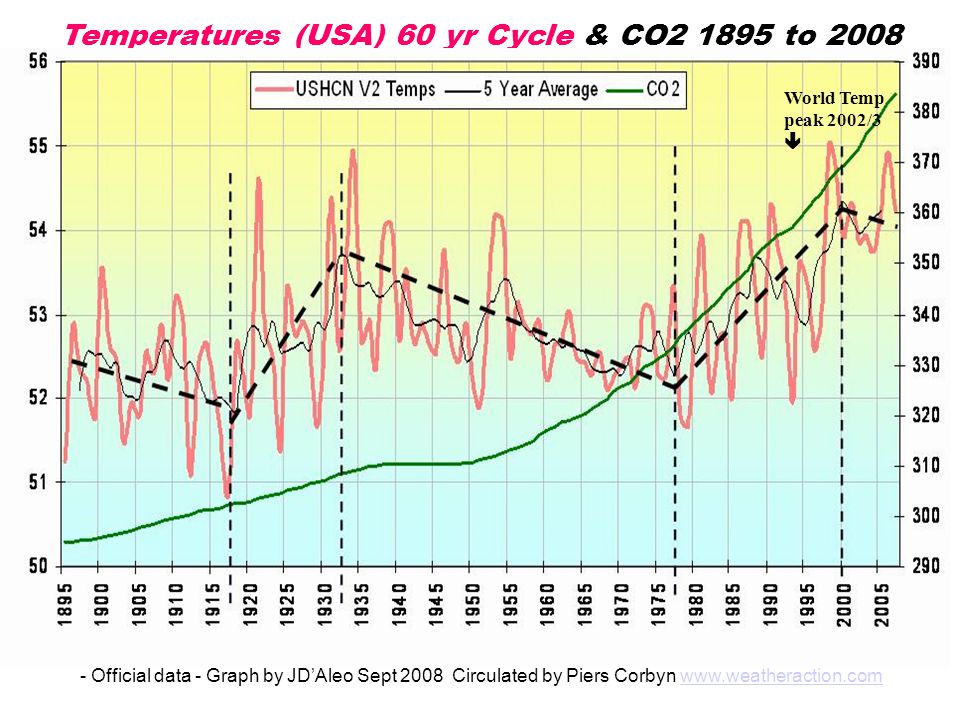
Corbyn then kicks off by asserting anthropogenic CO2 comprises 4% of atmospheric CO2 (thus confusing FF carbon with naturally-cycled carbon) and that CO2 is not the main controller of global temperature (here presenting a graphic which confuses the US temperature with global temperature - shown below in this comment).
A further assertion is then presented, that CO2 is the result of warming oceans with six references/notes provided in support which seem to all point back to crazy denialist Murry Salby.
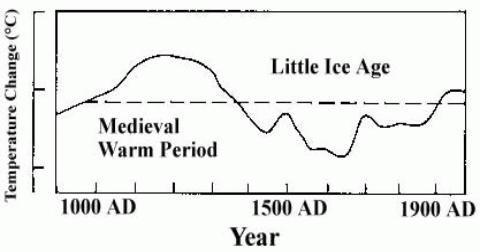
So, a la Salby, the present rise in CO2 is claimed to result from the good old Medieval Warm Period. A graphic is presented comparing a denialist 1,000y temperature record (based on the schematic FAR Fig 7c) with the much-confirmed scientifically-based Hockey Stick graph.
This brings us to the halfway page of Corbyn's denialist rant.
The thesis continues with pageful of misunderstanding of how the GH-effect works, ending with accusations that this misunderstood 'theory' breaks the 2nd Law of Thermodynamics (or it does if you misinterpret the 2nd Law of Thermodynamics).
Happily, this misunderstanding is considered to be not supported by "better scientists" who consider the lapse rate. And this indeed is a 'better' consideration. But here Corbyn perhaps confuses the tropical 'hot spot' (which is caused by increased tropical rainfall transporting more latent up into the troposphere) with some CO2 effect. (The 'hot spot' results from a warmer tropics and not per se any enhanced GH-effect.) And he fails to address the reasons why there is difficulty detecting this tropical 'hot spot'. Indeed he brands it as a 'coldspot' that he seems to say is caused by "more CO2 & other GHGs" which cause a diurnal fluctuation in the IR "heat-exit height" to become greater and, due to the 4th-power in the SB equation, this causes cooling. Whether such a phenomenon extends beyond the tropics (thus globally more-than negating the 'hot spot') is not properly explained but, due to the lapse rate this phenomenon can apparently also negate "the original expected surface warming."
A first graphic box is presented with three unsubstantiated bullet points explaining "Why CO2 theory does not work" alongside two similar "apart from"s.
A second graphic box also titled "Why CO2 theory does not work" states:-
In the real atmosphere there are day/night temperature fluctuations (eg in upper atmosphere). They are larger with more CO₂ because CO₂ (infra red absorber / emitter) gains & loses heat easier than N₂ & O₂ and so enables all the air to adjust quicker.
This is a fundamentally different explanation from the previous fluctuation in IR "heat-exit height" explanation described earlier, and it is still wrong.
(A packet of air with X concentrations of CO2 will both emit and absorb an IR photons of quantity P. With absorb=emit, it is thus in equilibrium. Add CO2 so the concentration is doubled to 2X, and the emitting photons will double to 2P and the absorbed photons will also double to 2P so absorb=emit and the same equilibrium is maintained. The main result is that twice the level if IR emission has half the pathlength before absorption so at any point the IR flux remains unchanged. And CO2 does not "gain & lose heat easier than N₂ & O₂" when it remains thermally coupled to the N₂ & O₂. )
The remainder of this second graphic box on PDF page 9 is a little too confused to rebut with any confidence. A diurnal range of "about 5 or 6 deg" is given which is apparently a temperature range yet whatever “deg” means (presumably Kelvin), the bulk of the troposphere has a far smaller diurnal range than even 5ºF. The mechanism for the enhanced cooling from the "heat-exit height" is presented as due to a fluctuating temperature losing more heat (by radiating IR) than a constant temperature (which is true). A rather dodgy-looking equation is followed by the note "Detail subject under research" but no reference is given and three-years-on there is no sign of such "research."
And a third graphic box is shown on the next page also titled "Why CO2 theory does not work," this third such graphic mainly presenting a pair of images from Australian denialist David M. W. Evans who has his own SkS page of climate misinformation.
The thesis then turns to the proposition that it is not CO2 but solar forces that "rules climate temperature" with the dotted line on the graphic below described as such a ruling influence. It apparently shows how the "9.3yr lunar-nodal crossing & the full 22yr solar magnetic cycle" allegedly shift the jet stream and "many circulation patterns." The graphic's 60-yr periodicity is less than convincing,being fitted to US rather than global temperature which, when extended beyond the 1895-2008 period shows itself to be simple curve-fitting (eg the Berkeley Earth US temperature record 1820-2020 does not show it, even to a blind man). The graphic was presented by Corbyn at the Heartland Institute's 2009 conflab in NY in which Corbyn [audio] insists other findings demonstrate “something is going on” but why it is this graphic being reused in this 2019 thesis is not clear – perhaps the forecast of world temperature dropping to 1970s levels by 2030 is too evident on other slides he used in that Heartland presentation.
To support his thesis Corbyn mentions an alleged cover-up by the likes of the BBC in reporting only global warming when the 'true' data shows cooling, the reported support for all this Piers Corbyn craziness from oil companies who shy away only because they want to use AGW to "make higher profits" and how these AGW-inspired mitigation agendas are already directly responsible for needlessly killing "millions" annually.
The thesis ends with a challenge:-
It is for this reason that I, Piers Corbyn, challenge whoever is willing in Reading University or other appropriate institutions to a debate on the failed Global warming scam vs evidence-based science.
So I interpret the thesis as a "welcome to the lunatic asylum" message from Piers Corbyn.
- There is no consensus
Sun at 15:13 PM on 4 April, 2022Dr. David Evans made the statement: "Yes, it's important to get our response right. If the alarmist is correct, then we should cut down our carbon emissions of the planet from overheating. If the alarmist is wrong, it's important not to cut back our carbon emissions or we'll create widespread poverty unnecessary.
- We're coming out of the Little Ice Age
Cedders at 18:39 PM on 19 March, 2017The focus of this article is the LIA, so none of the three rebuttals address the Thames Frost Fairs mentioned by David Evans. As Robin at 57 mentions, these fairs were not every winter. BBC article: "between 1309 and 1814, the Thames froze at least 23 times and on five of these occasions -1683-4, 1716, 1739-40, 1789 and 1814 - the ice was thick enough to hold a fair".
As a Londoner, I can say it now seems implausible the Thames would freeze at London Bridge because it has been embanked by Bazalgette, flows fast in both directions, and is navigable and tidal as far as Teddington Lock. However, when it was shallower and slower, flow could become blocked at the Old London Bridge, which was demolished in 1831. There may be research into how important the LIA was as a factor in Thames freezing, but I recall reading how it was mostly down to commercial and architectual changes.
Separately, research published Jan 2017 clarifying the 'pre-industrial' global temperature baseline as mid-eighteenth century rather than 1850-1900 makes a difference of about 0.1 °C, which actually has policy implications related to Paris targets, shaving off a few years of inaction. That seems to give an indication of the order of magnitude of any difference the LIA made at a global scale.
- Just who are these 300 'scientists' telling Trump to burn the climate?
Nick Palmer at 00:31 AM on 2 March, 2017I thought I'd see how many of the usual suspects were in it. Interestingly, I didn't find Christy or Peiser in there...
ABDUSSAMATOV, Habibullo Ismailovich
ANDERSON, Charles R
BALL, Tim
BARTLETT, David
BASTARDI, Joseph
BELL, Larry S
BOEHMER-CHRISTIANSEN, Sonja A
BRIGGS William M.
D'ALEO, Joseph S.
DOUGLASS JR.
DYSON, Freeman
EASTERBROOK, Donald J.
EVANS, David M. W.
HAPPER, William
HUMLUM, Ole
IDSO, Craig
LEGATES, David R.
LINDZEN, Richard
MANUEL, Oliver K.
MISKOLCZI, Ferenc Mark
MOCKTON, Christopher
MOORE, Patrick
MORNER, Nils-Axel
MOTL, Lubos
SCHMITT, Harrison H.
SINGER, Fred S.
SOON, Willie
SPENCER, Roy W.
WHITEHEAD, David - Models are unreliable
scaddenp at 12:45 PM on 25 February, 2016I just had a quick look at Mann 2015 where this all started and at CMIP5 website. According to website, the runs were originally done in 2011. The CMIP5 graph is Mann, is the model ensemble but run with updated forcings. To my mind, this is indeed the correct way to evaluate the predictive power of a model, though the internal variability makes difference fom 2011 to 2015 insignificant. The continued predictive accuracy of even primitive models like Manabe and Weatherall, and FAR suggests to me that climate models are a very long way ahead of reading entrails as means of predicting future climate.
I wonder if Sks should publish a big list of the performance of the alternative "skeptic" models like David Evans, Scafetta, :"the Stadium wave" and other cycle-fitting exercises for comparison.
- 2015 SkS Weekly Digest #42
Tristan at 10:03 AM on 19 October, 2015Meanwhile, over at Gina Rinehart's favourite website, Dr David Evans, PhD has gone full Galileo, and his wife has so far devoted 13 posts to it.
- We're coming out of the Little Ice Age
Tom Curtis at 08:30 AM on 12 March, 2014greg84 @65:
"I was curious when was human industry significant enough to impact climate (roughly)?"
It depends on what you mean by impact.
William Ruddiman believes (and I believe that he has shown) that absent anthropgenic emissions from land clearing and agriculture, CO2 concentrations would have fallen from a high aroun 8,000 years ago to at least 240 ppmv, or lower. That fall may well have been enough to kick us into a new iceage by now, and would certainly have resulted in LIA conditions being the norm rather than the exception. (Note, the linked paper is the earliest presentation of his hypothesis, which is supported by a number of more recent papers, and by more than just Ruddiman. His theory is, however, not universally accepted among climate scientists.)
From about 1650, coal burning in London was sufficient that there was a selective advantage for dark forms of the Peppered Moth due to soot coating trees. So from then there was an appreciable anthropogenic forcing from black carbon.
More directly related to your question, in 1940, the forcing from CO2 relative to 1832 was 0.47 W/m^2, or 29.4% of the 1.6 W/m^2 in forcing 2008. (The exact figure and percentage will change, depending on your base year. I have used 1832 for convenience as I have a spreadsheet with CO2 concentrations back to 1832.) That is clearly significant, but also not enough to account for the majority of the warming trend from 1900-1940. Deniers like David Evans, however, tend to talk as though it was completely irrelevant. In fact, that forcing is larger than the probable chang in solar forcing over that period. It is, however, likely smaller than the volcanic forcing over that period. The near complete absence of volcanoes from 1910 to 1940 is the probable primary cause of the warming in that period; supplemented by (in order of magnitude) anthropogenic forcing, and solar forcing; with those two combined being approximately of the same magnitude as the volcanic forcing.
The interesting thing is that since 1940, there has not been a pause in volcanism, so that the volcanic forcing has been negative. Likewise, the solar forcing, after peaking in 1950, has declined so that in 2008 it was almost as low as the 1910 minimum. Consequently, while anthropogenic forcings account for only about 25% of the early twentieth century warming (give or take), they account for nearly 100% of the warming from 1900 to 2013.
In a recent poll of climate scientists, 86.76% thought that 50% or more of the warming since 1850 was anthropogenic. Given a distinct, and clearly natural cooling trend from 1850 to 1900, that figure would rise significantly if the start year had been 1900, and to near unanimity for a start year of 1950. The modal (most preferred) value was 80%, with twice as many thinking it was above 80% as thought it was below 50%. Science is not settled by consensus, of course. But scientists hold their opinions for good reasons. Anybody challenging so strong a concensus must show very good reasons to do so. Unfortunately no such good reasons have been presented.
- We're coming out of the Little Ice Age
greg84 at 07:40 AM on 12 March, 2014"The IPCC blames human emissions of carbon dioxide for the last warming. But by general consensus human emissions of carbon dioxide have only been large enough to be significant since 1940—yet the warming trend was in place for well over a century before that." (David Evans)"
Hello,Is this 1940's thing in dispute? I read through the LIA stuff here, but it only talks about the LIA itself. It is in the "myth" section, but unless I'm missed something, I didn't see anything saying anything otherwise. I was curious when was human industry significant enough to impact climate (roughly)?
- IPCC overestimate temperature rise
TomPainInTheAsk at 13:08 PM on 29 September, 2012
The WUWT "Skeptics Case" is written by Dr David M.W. Evans. It vividly compares "Predicted to actually measured" in Figure 3. But is that a fair summary?
The Evans article is targeted to non-experts (like me), is well-written and has great graphics. Everything in it may be wrong or misleading, but it tells a convincing story. - What is the Climate Science Legal Defense Fund?
doug z at 18:24 PM on 15 July, 2012
Tom Curtis wrote at 11:03 AM on 15 July, 2012
"doug z @32, I am glad, then, to hear that you will be ignoring Anthony Watts, Jonova, Christopher Monckton, David Evans, and the host of so-called climate skeptics"
Tom, I will ignore anyone and everyone who refuses to back up accusations, including all those you listed if you can name specific instances where they have done that.
Given that we are discussing a specific instance where Karoly has done exactly that, then I take it that you agree with me that his credibility is in jeopardy unless he puts up or has the decency to apologise. - What is the Climate Science Legal Defense Fund?
Tom Curtis at 11:03 AM on 15 July, 2012
doug z @32, I am glad, then, to hear that you will be ignoring Anthony Watts, Jonova, Christopher Monckton, David Evans, and the host of so-called climate skeptics who make repeated accusations of fraud against climate scientists without a shred of evidence, and without even the good grace to correct their errors when proven wrong.
I believe McIntyre also belongs on that list, but at least he gives the appearance of backing up his claims so that he has a fig leaf to hide behind. - Madness over sea level rise in North Carolina
Rob Painting at 05:58 AM on 29 June, 2012
Sphaerica - Steve Case is correct - sea level has increased in a near-linear manner over the last two decades. But as discussed in this post David Evans: All at Sea about Ocean Warming and Sea Level Rise), that's not greatly surprising considering the trend in aerosols and ENSO. However, El Nino seems to be forming, and we're likely to see a return to an El Nino-dominant period sometime soon. Sea level is therefore likely to spike upwards for a time. Indeed, globally-averaged sea level has already risen over 10mm in the last year:

The longer-term problem is that ice mass loss from the Greenland & Antarctic Ice Sheets is accelerating and this, coupled with the Earth's current energy imbalance (that dictates further warming is effectively dialed in), suggests an acceleration of sea level rise is likely at some point in the future. This will be influenced by how the trend in human-made and natural volcanic reflective aerosols develop too. - Models are unreliable
scaddenp at 12:23 PM on 1 June, 2012
(snip)
As to JoNova/David Evans misinformation - well look around Skepsci for take downs, (eg hot spot and Evans (snip)
Hansen's 1984 model - yes it had sensivity wrong for well understood reasons. see Lessons from past predictions 1981 (and rest of that series for interest). And yes, climate sensitivity is still uncertain, but very unlikely to be less than 2 (or more than 4) - but claiming a past prediction is falsified by data on sensitivity doesnt fly when sensitivity wasnt a robust prediction.
(snip) - Models are unreliable
Peter42 at 12:18 PM on 1 June, 2012
Tom Curtis “How reliable are climate models?” (# 527: 10.38 am 1 June 2012)
To Tom Curtis:
I’m seeking clarification here, so I hope these question does not fall into the category of “dogpiling” (a term I’m loathe to use, given its homophonic noun alternative). I note your criticism of David Evans’ chart overlaying Hansen’s 1988 predictions with NASA satellite data of global air temperatures, where you demonstrate that the current CO2 level corresponds closely to Hansen’s prediction for Scenario B. Is your main point in that part of your analysis, that Evans should have noted that Scenario B “actually occurred”? Or is there more that I have missed? I’m a bit confused by your paragraph “So, for every gas modeled, the actual 2011 concentration is greater than the projected scenario B concentration, often much greater. In two cases, even the scenario C projected concentration is greater than the actual concentration; yet Evans says that Scenario A emissions is what happened.” Does the four row table above that paragraph, show the 1988 figures used in Hansen’s modelling?
My last question is whether there is any issue with the Evans chart of the actual NASA air temperatures – the black line?
I’d appreciate your help. Thank you. - Models are unreliable
Tom Curtis at 10:38 AM on 1 June, 2012
Clyde @552 links to an atrocious analysis by David Evans, who by all accounts (particularly his own) is an expert in computer modeling. Evans criticizes two models which are supposedly representative of IPCC model predictions, the 1988 prediction by Hansen, and the projections by the IPCC First Assessment Report (FAR). He says of them:
"The climate models have been essentially the same for 30 years now, maintaining roughly the same sensitivity to extra CO2 even while they got more detailed with more computer power."
Oddly, in the IPCC Third Assessment Report (TAR) we read:
"IPCC (1990) and the SAR used a radiative forcing of 4.37 Wm-2 for a doubling of CO2 calculated with a simplified expression. Since then several studies, including some using GCMs (Mitchell and Johns, 1997; Ramaswamy and Chen, 1997b; Hansen et al., 1998), have calculated a lower radiative forcing due to CO2 (Pinnock et al., 1995; Roehl et al., 1995; Myhre and Stordal, 1997; Myhre et al., 1998b; Jain et al., 2000). The newer estimates of radiative forcing due to a doubling of CO2 are between 3.5 and 4.1 Wm-2 with the relevant species and various overlaps between greenhouse gases included. The lower forcing in the cited newer studies is due to an accounting of the stratospheric temperature adjustment which was not properly taken into account in the simplified expression used in IPCC (1990) and the SAR (Myhre et al., 1998b). In Myhre et al. (1998b) and Jain et al. (2000), the short-wave forcing due to CO2 is also included, an effect not taken into account in the SAR. The short-wave effect results in a negative forcing contribution for the surface-troposphere system owing to the extra absorption due to CO2 in the stratosphere; however, this effect is relatively small compared to the total radiative forcing (< 5%).
The new best estimate based on the published results for the radiative forcing due to a doubling of CO2 is 3.7 Wm-2, which is a reduction of 15% compared to the SAR. The forcing since pre-industrial times in the SAR was estimated to be 1.56 Wm-2; this is now altered to 1.46 Wm-2 in accordance with the discussion above. The overall decrease of about 6% (from 1.56 to 1.46) accounts for the above effect and also accounts for the increase in CO2 concentration since the time period considered in the SAR (the latter effect, by itself, yields an increase in the forcing of about 10%)."
(My emphasis)
A 15% reduction in estimated climate sensitivity is not "roughly the same sensitivity". What is more, early climate models included very few forcings. Evan's comment on that in his video saying (falsely) that they only include CO2, and do not include natural forcings. However models used in the Third and Fourth Assessment reports most certainly used natural forcings, as well as a wide range of anthropogenic forcings. Therefore the claim that "[t]he climate models have been essentially the same for 30 years now" is simply false.
More troubling is the graphic Evan's uses:

First we have the label indicating the projections dependent on CO2 emissions as if CO2 was the only forcing modeled by Hansen. Indeed, in the video, Evans explicitly states just that, ie, that CO2 was the only modeled forcing. In fact Hansen included five different anthropogenic gases in each model run, so checking just CO2 emissions does not check how well reality conformed with any particular scenario.
Far worse, he labels scenario A as "CO2 emissions as actually occurred". What actually occurred, and entirely unpredicted by Hansen, was that the Soviet Union collapsed resulting in a massive reduction of very polluting Soviet Block industry, with a consequent massive reduction of CO2 emissions from the Soviet Block:

As a result, current CO2 levels (ignoring seasonal variation) are only 390.5 ppmv, which compares to the 391 ppmv projected by Hansen for 2011 in scenario B. In other words, Evans is claiming that CO2 emissions followed scenario A whereas in reality they have not yet caught up to scenario B.
Here are the current concentrations of the other GHG used in Hansen's model:
Gas | Actual__ | Hansen (Scenario)
___CH4 | 1810 ppb | 1920 (Scenario C)
___NO2 | _323 ppb | _330 (Scenario B)
_CFC11 | _240 ppt | _275 (Scenario C)
_CFC12 | _533 ppt | _961 (Scenario B)
So, for every gas modeled, the actual 2011 concentration is greater than the projected scenario B concentration, often much greater. In two cases, even the scenario C projected concentration is greater than the actual concentration; yet Evans says that Scenario A emissions is what happened.
Given the size of the discrepancies, there are only two possibilities. Either Evans did not bother looking up the data before making his assertion - an assertion he has made repeatedly while strongly emphasizing his expertise. Or he is flat out lying.
Seeing Clyde introduced Evans' rubbish to this discussion, he now needs to answer several questions:
Do experts make assertions about data which they have not bothered looking up?
Do they lie?
And why, given that they are supposedly so skeptical, have no fake "skeptics" picked up on these errors and criticized Evans for them?
Finally, for a proper analysis of those predictions, I recommend the posts by Dana on Hansen's 1988 predictions, and on the predictions of the First Assessment Report. I don't think Dana claims to be an expert on climate modeling, but at least he treats the data with integrity. - Models are unreliable
Clyde at 05:21 AM on 1 June, 2012
Sorry about the post above.
More evidence the computer models are not good at predicting future climate change.
One minor "type O" & things come out wrong. - David Evans: All at Sea about Ocean Warming and Sea Level Rise
chriskoz at 23:25 PM on 21 May, 2012
Regardeless of the ensuing content of this video, when I hear Evans introducing himself at the start:
"Hello, my name is Doctor David Evans [...] I have 6 university degrees..."
Something does not sound right. Does anyone know a credible and honnest scientist who introduces him/herself in such boastful way? In Japanese culture for example, it would be considered very very rude, perhaps in English culture he may get away with it: I'm notr sure as English is not my mother tongue. - David Evans: All at Sea about Ocean Warming and Sea Level Rise
Bernard J. at 17:22 PM on 20 May, 2012
Dana1981 at #13.
James Hansen states the 400,000 Hiroshima bombs equivalence at 7:45 in his video "Why I must speak out about climate change". - David Evans: All at Sea about Ocean Warming and Sea Level Rise
R. Gates at 15:54 PM on 19 May, 2012
This is an excellent counter to David Evans and his cherry-picked denialist nonsense. The focus here on ocean heat content is spot on. You might want to update your 2000m graph as the latest data for Jan-Mar 2012 Is in and ocean heat content down to 2000m is at an all-time instrument record high. It is nearly impossible for skeptics to explain this away, so they can only discredit it or focus on the tropospheric temps. With Solar max 24 coming next year (no matter how weak) and a likely El niño in the next year or so, tropospheric temps should be hitting record highs as well. Skeptics will have to work harder to find cherries to pick, but expect folks like David Evans to be bringing us his little baskets filled as much as he can for as long as there are gullible and receptive minds to consume his psychotropic cherries. - ABC documentary demonstrates the how and why of climate denial
LukeW at 09:30 AM on 28 April, 2012
Anna's knowledge of the topic was pretty mediocre and she fluffed it every time it got serious. Megan Clarke was using well rehearsed lines after her media training. CSIRO avoiding the stasis in warming by going to a decadal mean meme. But it all probably rated well as it was only entertainment.
Jo Nova and David Evans should have been let go much longer and some back room lads and lassies from CSIRO and BoM let loose to talk REAL science.
Could have done some serious analysis of alternative energy including nuclear with Prof Barry Brooks.
But instead another unconvincing bit of info-tainment paff with celebrities. Clive Palmer didn't give a rats - it was all just profile. All rubbish really. - Cliff Ollier: Swimming In A Sea of Misinformation
indulis at 20:22 PM on 25 April, 2012
Prof Cliff Ollier is also part of the Australian Climate Science Coalition which includes such well known and respected thinkers in the climate field such as:
- Prof Bob "My logic is impeccable CO2 lagged temperature rises in the past, so it can't be the cause now" Carter
- Dr David "I will ignore BEST and continue to claim that 'heat islands' are being used to "inflate official temperatures" Evans
- Professor Ian "The CO2 is mostly from volcanoes, I will ignore carbon isotope analysis of atmospheric CO2, and any facts to the contrary from the USGS- anyway the world is not warming!! Plimer
Not one of whom has published a single scientific paper in a reputable (peer reviewed) journal.
The ACSC web site also has links to the Heartland Climate Conference and other denier hangouts. - It hasn't warmed since 1998
Tom Curtis at 12:00 PM on 11 March, 2012
sOnathan @171, I recommend to you the two excellent replies by Chris and Rob Painting (and Dikran's sage advise). As they have covered much of the territory I would have, I will try to restrict my comments to points they have not already covered.
1) Ocean Heat Content
The obvious point here is that David Evans has picked a high point in the data as his start point, thereby artificially increasing the apparent discrepancy between the data and the models. This is made obvious by comparing the graph shown by David Evans with that shown by Rob Painting. Evans justifies his start point by saying,
"We’ve only been measuring ocean temperature properly since 2003, using the ARGO system."
That claim is simply false. Prior to Argo, a number of different methods where used to measure ocean heat content, of which the largest was the XBT in which over 5 million eXpendable BathyThermographs were deployed from the 1960s onwards. They do not give perfect information, but imperfect information is not the same as no information. The habit of ignoring imperfect information because it does not tell you what you want to here is, to put it mildly, not scientific.
What is more, the Argo program was not yet extensive enough in 2003 to give significantly improved data compared to the XBT program:

It is only in 2006 that it became an effectively global program. But had Evan's zeroed the curves in 2005 or 2006 it would not have told the right story, which I guess is exactly the point.
2) Hansen's 1988 predictions
You have to wonder why Evans chooses to focus on a 1988 model when computing power was to crude for the model to include aerosols, a known significant factor, instead of on later models from the 2001 IPCC report, or the 2007 IPCC report. This is particularly the case because Hansen's predictions are known to be wrong, and are predicted to be wrong by the global warming community. This is primarily because the forcing factor of CO2 was determined in 1998 to be overstated by 18%. Therefore, as a criticism of AGW, Evans' blogpost is fourteen years out of date.
More concerning is Evans little edit to the 1988 forecast graph indicating that scenario A is what happened. For reference, here is a comparison between actual 2010 GHG concentrations and Hansen's scenario B projections for 2010:
Table 1: Scenario B greenhouse gas (GHG) concentration in 1984, as projected by Hansen's Scenario B in 2010, and actual concentration in 2010
GHG
1984
Scen. B 2010
Actual 2010
CO2 344 ppmv 389 ppmv 392 ppmv
N2O 304 ppbv 329 ppbv 323 ppbv
CH4 1750 ppbv 2220 ppbv 1788 ppbv
CCl3F 0.22 ppbv 0.54 ppbv 0.24 ppbv
CCl2F2 .038 ppbv 0.94 ppbv 0.54 ppbv
To be fair, Hansen's scenario A projection for CO2 was 391.5 ppmv, which is pretty close. But CO2 concentrations where well less than Hansen's scenario A projections in the 1990s due to the collapse of the Soviet Union, and caught up again in the 2000s due to the rapid industrialization of China. The net effect is that on average the CO2 forcing was well below the Scenario A projection, and because of thermal lag, it is the earlier (and lower) part of that projection which has the most significance for current temperatures. It should also be noted that NO2 concentrations and CFC 12 concentrations are less than Hansen's scenario C projections.
Overall the effect is as if GHG concentrations had tracked just below Hansen's scenario B. The interesting question to ask Evans is, why did he state Scenario A is what happened, and how did he check? The answer, as it cannot have been a thorough check will reveal that what he is doing is not science, but propaganda.
This is also shown by his use of the HadCRUT3 temperature index, which is known to have less than global coverage, which is known to create inaccuracies. What is more, it is also known that it is obsolete and is about to be replaced by HadCRUT4, which like GISTEMP shows 2010 as being hotter than 1998. That would lift the end point of the temperature graph to just below Hansen's scenario B projection. Given the actual development of GHG concentrations, that's not such a bad projection, but of course, again, its the wrong story.
(For far more details on Hansen's 1988 projections, I suggest you read Dana's excellent article on the topic.)
I notice Evan's finishes with a call for a debate. Well, apparently unknown to Evans, there is an actual scientific debate about AGW that goes on in the scientific literature. Unfortunately for Evans, in that debate you are required to handle your data with integrity, which it would appear would leave Evans shooting blanks. In fact, the stunning dearth of "skeptical" voices in the scientific literature really seems to come from that one requirement.
Until so-called skeptics actual start publishing their theories in respectable, climate oriented scientific journals, the proper assumption is that they cannot because their argument evaporates when you are required to handle data with integrity. It therefore follows that on climate they really have nothing interesting to say. - It hasn't warmed since 1998
s0nathan at 03:38 AM on 11 March, 2012
I am trying to find a response to the data collected by Dr David Evans. It show climate modeling has not proceeded as predicted

and flattening in the ARGO data.

Four fatal pieces of evidence
- David Evans' Understanding of the Climate Goes Cold
oneiota at 20:55 PM on 18 November, 2011
@39
Mark I followed your link and somehow ended up at jonova's site
Wow that is a mud wresting pit! KR to great credit has taken up the argument and the rebuttal is sound and patient but alas it has fallen on "itchy ears".
The argument is not one that can be won by science alone I fear.
A biblical quote applies:
"2 Tim 4:2 Preach the Word; be prepared in season and out of season; correct, rebuke and encourage--with great patience and careful instruction.
2 Tim 4:3 For the time will come when men will not put up with sound doctrine. Instead, to suit their own desires, they will gather around them a great number of teachers to say what their itching ears want to hear.
2 Tim 4:4 They will turn their ears away from the truth and turn aside to myths."
From what I have learned here each of the four points (myths perpetuated) raised by Evans can be debunked but the deaf cannot hear the truth above the noise trapped in their heads. - Modern scientists, following in Galileo’s footsteps
Albatross at 14:10 PM on 30 September, 2011
Stevo @29,
Thanks. You made me look closer at the Galileo Movement, and what I read is very interesting/disturbing. Look who the advisors are for the Galileo Movement in Australia:
Professor Tim Ball
Warwick Hughes
Professor Fred Singer
Professor Dick Lindzen
Bill Kininmonth
Professor Bob Carter
Professor Ian Plimer
David Archibald
Professor Peter Ridd
Professor Garth Paltridge
Dr Vincent Gray
Dr Jennifer Marohasy
Jo Nova
Des Moore
John Nicol
David Flint
Andrew Bolt
John McLean
David Evans
Pat Michaels
Joe D'Aleo
Viscount Monckton
[Source]
Their purported guiding principles ironically include:
"Honesty: rely on factual data, ensure decisions are based on facts;
Fact based science: protect and use science, a key to human progress, objective and fair decisions and freedom"
and under "Purpose and Aims" ironically include:
"Protect science and restore scientific integrity"
Sounds great does it not? But, there is a very big problem with those proclamations, because unfortunately those lofty ethics and goals do not seem to be endorsed or even practised by several of their advisers, as has been demonstrated multiple times here at SkepticalScience and elsewhere. Some of the names on that list shocked me. What are Drs. Lindzen and Gray thinking? - Monckton at odds with the very scientists he cites
Tom Curtis at 01:53 AM on 19 July, 2011
Rob Honeycutt @22, you obviously like your humor black.
Not only is he (as you put it) an all round bad seed, he is also intimately connected with all the major deniers in Australia. These are the "independent advisers" of the ironically named "Galileo Movement":
Professor Tim Ball
Warwick Hughes
Professor Fred Singer
Professor Dick Lindzen
Bill Kininmonth
Professor Bob Carter
Professor Ian Plimer
David Archibald
Professor Peter Ridd
Professor Garth Paltridge
Dr Vincent Gray
Dr Jennifer Marohasy
Jo Nova
Des Moore
John Nicol
David Flint
Andrew Bolt
John McLean
David Evans
Pat Michaels
Joe D'Aleo
Viscount Monckton
Jo Nova in particular, has been sharing the podium with Monckton on his speaking tour. While she has been saying,
"We sceptics are not calling for anyone to be silenced."
he has been getting up and saying:
"So to the bogus scientists who have produced the bogus science that invented this bogus scare I say, we are coming after you, we are going to prosecute you and we are going to lock you up!"
Apparently they do not see the disconnect. What is transparently lacking is responsible media who put to those involved why they are willing to associate with a man like Monckton (no more accurate description can be given with in comment policy). - 2010 - 2011: Earth's most extreme weather since 1816?
Tom Curtis at 13:38 PM on 30 June, 2011
Norman @94 (By special request)
Norman is arguing against my contention (@88) that:
"You think there is an important distinction only because you have in your mind that an Earthquake is a big thing hitting a large region. Of course, the damaging region of most earthquakes is in fact small, but you typically think of the big newsworthy quakes. In contrast your idea of a weather related disaster is just a single thunderstorm or twister. In fact, for statistical purposes it is a weather front, or a tornado outbreak; so while a big earthquake is pretty much guaranteed to damage nearby cities, a large weather related disaster is very likely to hit multiple states, or even countries."
(Emphasis added)
Against this contention he supplies the following evidence:
"The quake just before 4:37 a.m. was centered six miles from West Salem, Ill., and 45 miles from Evansville, Ind. It was felt in such distant cities as Milwaukee, Des Moines, Iowa, and Atlanta, nearly 400 miles to the southeast.
"It shook our house where it woke me up," said David Behm of Philo, 10 miles south of Champaign. "Windows were rattling, and you could hear it. The house was shaking inches. For people in central Illinois, this is a big deal. It's not like California."
In West Salem itself, a chimney on one house fell and there were reports of cracks in walls. "We're very thankful we had no one injured," said Harvey Fenton, the town's police and fire chief.
He was at first unsure what to make of the sudden rumbling when it woke him up.
"A major shaking is the best way I can describe it," said Fenton, 58.
Fifteen miles to the southeast, in Mount Carmel, a woman was trapped in her home by a collapsed porch but was quickly freed and wasn't hurt, said police dispatcher Mickie Smith. A century-old apartment building there, a former schoolhouse, was evacuated because of loose and falling bricks."
(emphasis added)
As the point of contention is the damaging radius of small earthquakes, evidence that a small earthquake has a damaging radius of around 10 miles (six miles from West Salem to the epicentre in approximately the directionof Evansville, and hence Mount Carmel, which was 15 miles from West Salem). I assume Norman has focussed on the fact that the earthquake was felt up to 400 miles away. However, what is at issue is not detection, but whether the event would have been recorded as a natural disaster, and for that, the relevant issue is the radius of damage, not of detection.
Norman also presents evidence that magnitude 7 quakes can have damaging radii of up to 100 miles. Again, I do not see how this does anything but support my claim that "a big earthquake is pretty much guaranteed to damage nearby cities", and nor is it relevant to my claim that "a large weather related disaster is very likely to hit multiple states, or even countries".
To put this into context, there are seven earthquakes listed by wikipedia as occurring in the US in 2010. They were:
The Eureka Earth Quake (6.5), 463 buildings damaged, $43 million in losses;
The Illinois earthquake (3.8) no damage or injuries;
The Pico Rivera earthquake Not worth more than a stub, so no futher information;
The Baja California Earthquake (more details later);
The Borrego Springs earthquake (5.4) apparently no injuries or damage;
The Potomac-Shenandoah earthquake , again only worth a stub; and
The Indiana Earthquake (3.8) no injuries or damage.
The important thing to note is that of these earthquakes, only two would count as natural disasters according to the criteria of Neumayer and Barthel, 2011, and only one, the Baja California earthquake, would count as a major natural disaster by their criteria. As it happens, the Baja Earthquake is listed as number 17 on Munich Re's list of 50 major natural disasters in 2010. They list it as causing, 2 fatalities, overall losses of $US 1.15 billion, and describe as follows:
"Mw 7.2. 6,000 homes damaged. Water and sewage systems damaged.
Telecommunication, electricity cut off. Injured: >230, evacuated/displaced: 25,000"
Five other natural disasters in the US make the 2010 list of major natural disasters:
15) Severe storms and floods in New York and New Jersey, causing 11 fatalities, $US 1.7 billion in damage, and "Thousands of homes, businesses, cars damaged/destroyed. Losses to airport facilities and infrastructur[e]";
22) Severe storms, tornadoes, and floods in Tennessee causing 32 fatalities, $US 2.7 billion in damages, and ">70 tornadoes. Thousands of homes and cars damaged. Water supply affected. Crops destroyed, livestock killed. Losses to infrastructure.";
26) Severe storms, tornadoes, and flash floods in "USA esp CO" (Connecticut?) causing 1 fatality, $US 0.85 billion in damages, and "Buildings, cars damaged. Losses to infrastructure and agriculture.";
33) Severe storms and tornadoes in "USA esp MT, MN", causing 4 fatalities, $US 0.83 billion and "Buildings, cars damaged. Losses to infrastructure and agriculture."; and
42) Wildfires in " USA: esp. CO" causing no fatalities, $US 0.31 billion in damage, and "170 homes, mobile homes, numerous cars destroyed, thousands of buildings damaged."
(Number 50 on the list is also from the US, but does not meet the Neumeyer and Barthel's criteria for a "major disaster".)
Bear in mind that the annual rate of "major disasters" have doubled over the last thirty years. Norman's contention that weather related natural hazards are not increasing is only plausible if detection rates of major natural disasters have risen by close to 100% or more over that period. If they have only risen by 50%, then there is still a substantial increase in events over that period. Looking at the list of major weather related disasters above, clearly that claim is not reasonable. - Geologists and climate change denial
thingadonta at 14:09 PM on 9 June, 2011
While I generally sympathise with parts of the aobve article, there are points at which I do not.
First to David Horton's misunderstanding of extactive industries (if I read him right).
1) Extractive industries have been going on since the stone age, and will go on for at least 10,000 years more. For most minerals, you simply can't 'run out' of them. We only mine the very highest grade top of the resource pyramid, and the huge volumes of various minerals in the earths crust will sustain most minerals for tens of thousands of years. (Flannery also got this concept totally wrong in the Future Eaters book, where he said mining industries in Australia are on the way down-look at Austrlia's mining industry now).
Take for example, Aluminium. We only mine it where the earth's processes have concentrated it to a point which is economic to extract, however Al is in virtually every rock-you will only 'run out' of Al when we run out of rocks. Pretty much the same goes for all other minerals, with a few possible exceptions such as those produced organically only under special conditions, such as liquid fossil fuels. (But we have tar sand oil resources for several hundred years+ yet, but these are nore difficult to extract).
So, in contrast to Horton's comment that we cant 'keep digging up minerals and burning or melting them in huge volumes as in the last 200 years', we have at least 10,000 years of Al resources in Australia alone at current extraction rates, and other minerals. However if David means these minerals wont run out, but simply are too energy intensive and contribute too much to global warming, then that is a very different argument. But even then, there will always be mineral demand as long as I sit on this chair and write on this PC.
2) To the above arcticle.
You havent mentioned rate.
Rate of warming and the way the earth responds by reducing energy pertubations is as important as the long term level of change. (This is why David Evans abandoned the AGW consensus. In his words there is good evidence that the earth responds to warming by depressing further warming). The geological record strongly suggests that earth changes are generally very slow (the old catastrophist versus gradualist positions). Although there are exceptions. One scientist puts it: 'Earth history is like the life of a soldier, long periods of boredom followed by short periods of terror'. The AGW argument is solely in the field of 'short period of terror'.
So with reference to past climate change, the rate is as important as the degree. 1.5-6 degrees of warming with doubling C02 might be in the ball park (I think more like 0.1-0.5), but not if it takes 1000 years.
( -Ideology snipped- ).
Economic geologists work daily with uncertainty, and they feel that market forces are generally better, in the long run, at regulating human exageration, which is why they are skeptical of AGW, because it is an academic-based movement largely outside of market regulation.
If an economic geologist exagerates an oil find, drilling and science coupled with investors (ie market forces) eventually finds this out, but if an academic exagerates rate and degree of warming, only less effective and much weaker market and social forces are in place to bring this kind of exageration down to earth, eg longer term observation (eg lack of warming) and democratic principles (voters voting out a carbon tax, for example). 'Peer review' is useful as an internal regulator but can be weak, peers can be self-selecting and are also prone to consensus groupthink etc. - Special Parliament Edition of Climate Change Denial
CBDunkerson at 01:31 AM on 17 May, 2011
Bud, the David Evans claim that CO2 driven warming was disproved in the 1990s is based on the supposed necessity of a tropospheric hot spot (which really isn't indicative of CO2 warming at all) and its absence in decades old weather balloon data (which have been proven to be inaccurate).
See: There's no tropospheric hot spot
Note also that he's a mathematician, not a climate scientist.
As to Happer's claim that there is little support for positive feedback effects... pure fiction. The positive feedback from water vapor has been conclusively demonstrated for a long time now. See: Water vapor is the most powerful greenhouse gas - Special Parliament Edition of Climate Change Denial
Bud at 01:10 AM on 17 May, 2011
Amazing that you could find a group of people to produce such meaningless statistics. Consensus is not a scientific process. In using claimed authority, the argument is relying upon testimony, not facts. A testimony is not an argument and it is not a fact. 97% of practicing climate scientists is a meaningless, worthless statistic...whether or not it could be proved true. Most of these climate scientists are dependent on continuing money from governments for the pay checks to study global warming, so most of them are heavily biased to keep the gravy train rolling.
However, there are many Auzzie scientists who dispute the fallacy of AGW. Here's just one recent example:
“The whole idea that carbon dioxide is the main cause of the recent global warming is based on a guess that was proved false by empirical evidence during the 1990s. But the gravy train was too big, with too many jobs, industries, trading profits, political careers, and the possibility of world government and total control riding on the outcome. So rather than admit they were wrong, the governments, and their tame climate scientists, now outrageously maintain the fiction that carbon dioxide is a dangerous pollutant.”
David Evans consulted full-time for the Australian Greenhouse Office (now the Department of Climate Change) from 1999 to 2005, and part-time 2008 to 2010, modelling Australia’s carbon in plants, debris, mulch, soils, and forestry and agricultural products. He is a mathematician and engineer, with six university degrees, including a PhD from Stanford University in electrical engineering. The comments above were made to the Anti-Carbon-Tax Rally in Perth, Australia, on March 23.
http://opinion.financialpost.com/2011/04/07/climate-models-go-cold/ - David Evans' Understanding of the Climate Goes Cold
José M. Sousa at 19:21 PM on 15 April, 2011
Maybe it is worth saying that he is not a climate modeler nor has he published a single peer-reviewed article on climate change according to desmogblog:
http://www.desmogblog.com/who-is-rocket-scientist-david-evans - Hansen's 1988 prediction was wrong
wingding at 21:02 PM on 3 April, 2011
Another misleading analysis of Hansen's 1988 scenarios
this time bob carter and david evans getting it hideously wrong.
Note the substitution of tropospheric temperatures when the projections were for surface temperatures.
Note the complete disregard of non CO2 greenhouse gases in order to claim scenario A best fits reality. Check the comments. There is a quote mine of Hansen 1988 to support that disregard.
Worse of all a complete lack of research. It's like they haven't even bothered reading any analyses of the 1988 scenarios, including in some of hansen's later papers. Like they didn't even use google.
There's enough wrong in that article for a skepticalscience correction imo. If you google some of the text in the article you will find it's been copy pasted around over the years.
Another bad thing is how none of the commenter seem to know it's wrong. - Satellites show no warming in the troposphere
expat at 16:29 PM on 9 August, 2009
Refer to
http://sciencespeak.com/MissingSignature.pdf
This is a discussion by David Evans of the radiosonde data 1879-1999 which appears to show that there is no tropical hotspot. Since a tropical hotspot is a feature of the positive feedback due to water vapour, assumed by IPCC models, is this not a clear disproof of predictions of significant AGW? - There is no consensus
HealthySkeptic at 15:30 PM on 17 April, 2009
Yes Quietman,
And David Evans is just one of a growing number of scientists who work or have worked in AGW-related fields to finally 'see the light' as it were. - There is no consensus
Quietman at 11:01 AM on 7 April, 2009
John
One of your countrymen, Dr. David Evans made the statement: "Yes, it's important to get our response right. If the alarmist are correct, then we should cut down our carbon emissions of the planet with overheat. If the alarmist are wrong, it's important not to cut back our carbon emissions or we'll create wide spread poverty unnecessary. There is no real substitute, except the get the real science right."
Dr. Evans recently converted from AGW alarmist to AGW skeptic. - There is no consensus
Risky at 23:20 PM on 29 December, 2008
Re: Post #77 from Austerlitz - if you pin your hopes on 'skeptics' like David Evans, maybe you should see this article (by David Evans) posted on the Lavoisier Group website (Australian 'skeptics' org with links to the coal industry, among others).
http://www.lavoisier.com.au/articles/greenhouse-science/climate-change/evansd2007-12.php
See the 5th from last paragraph, starting 'I emphasise that we are making a bet...'. Evans estimates that the likelihood that CO2 emissions are the dominant cause of global warming is only 20%, not 90% as per the IPCC estimate. Note the wording - 'dominant' cause.
I understand Richard Lindzen is now also similarly lukewarm on the odds. Maybe others could confirm.
If there was only a 20% chance of your house burning down, would you go without insurance?
With skeptics like that, who needs believers?
P.S. I am not a scientist (published or otherwise), but a risk management professional. I am curious as to what the risk appetite of those participating in the global warming debate is - just how much risk of dangerous climate change is acceptable? - There is no consensus
paledriver at 07:39 AM on 31 July, 2008
here's those credentials for you, auster....
"Who is 'Rocket Scientist' David Evans?
22 Jul 08
UPDATED: David Evans has sent along his definition of a rocket scientist. See below for details.
This title grabbed our attention: Top Rocket Scientist: No evidence C02 causes global warming. And it should. It is a pretty bold statement and the implications would be pretty big news.
So we decided to compile a backgrounder on 'The Top Rocket Scientist."
Here's the research database entry on David Evans:
No peer-reviewed articles on climate change
According to his own resume, Evans has not published a single peer-reviewed research paper on the subject of climate change. Evans published only a single paper in 1987 in his career and it is unrelated to climate change.
Evans has published an article for the Alabama-based Ludwig von Mises Instutute, a right-wing free-market think tank.
Evans also published a "background briefing" (pdf) document for the Australian chapter of the Lavoisier Group, a global warming "skeptic" organization with close ties to the mining industry.
"I am not a climate modeler"
From 1999 to 2006 Evans worked for the Australian Greenhouse Office designing a carbon accounting system that is used by the Australian Government to calculate its land-use carbon accounts for the Kyoto Protocol. While Evans says (pdf) that "[he] know[s] a heck of a lot about modeling and computers," he states clearly that he is "not a climate modeler."
Background
David Evans lives in Australia and gained media attention after an article he wrote titled, No Smoking Hot Spot was published in The Australian in June, 2008.The article claims that climate change is not caused by C02 emissions because there is no evidence of "a hot spot about 10km up in the atmosphere over the tropics." Evan's claim has been thoroughly debunked by Tim Lambert, a computer scientist at the University of New South Wales.
According to his bio, Evans claims to be a 'Rocket Scientist' and one article claims that he is a 'Top Rocket Scientist.' While Evans background does show that he has a PhD in electrical engineering, there is no evidence that he was ever employed as a rocket scientist.
Evans answered our inquiry about his claim to being a rocket scientist with the following explanation:
In US academic and industry parlance, "rocket scientist" means anyone who has completed a PhD in one of the hard sciences at one of the top US institutions. The term arose for people who *could* do rocket science, not those who literally build rockets.Thus the term "rocket scientist" means someone with a PhD in physics, electrical engineering, or mathematics (or perhaps a couple of other closely related disciplines), from MIT, Stanford, Caltech, and maybe a few other institutions.
I did a PhD in electrical engineering at Stanford in the 1980s. Electrical engineering is your basic high tech degree, because most high technology spawned from electrical information technology. I specialized in signal processing, maths, and statistics.
The definition provided by Evans would appear to be at odds with the conventional use of the term 'rocket scientist' which according to various sources is "One specializing in the science or study of rockets and their design." For example, here's an entry on Answers.com about Hermann Oberth a famous Rocket Scientist who published a book about rocket travel into outer space in 1932 and is considered one of 3 founding fathers of modern rocketry and astronautics.
Evans also claims to be "building a word processor for Windows." DeSmogBlog contacted Microsoft Corp. and they have confirmed that he does not work for Microsoft Corporation."
http://www.desmogblog.com/who-is-rocket-scientist-david-evans


THE ESCALATOR

(free to republish)