


 Arguments


Climate researcher Bart Strengers wins wager with climate sceptic Hans Labohm
Posted on 28 January 2015 by Guest Author
This is a re-post from My View on Climate Change
Guest post by Bart Strengers. Originally appeared as a news item on the PBL website.
Late 2009, in the run-up to the international climate conference in Copenhagen, PBL climate researcher Bart Strengers had an online discussion with climate sceptic Hans Labohm on the website of the Dutch news station NOS (in Dutch). This discussion, which was later also published as a PBL report, ended in a wager. Strengers wagered that the mean global temperature over the 2010–2014 period would be higher than the mean over 2000 to 2009. Hans Labohm believed there would be no warming and perhaps even a cooling; for example due to reduced solar activity.
At the request of Labohm, it was decided to use the UAH satellite temperature data set on the lower troposphere (TLT) (roughly the lowest 5 km of the atmosphere). These data sets are compiled by the University of Alabama in Huntsville. Satellites are used to measure radiation in the atmosphere, after which the temperature of the various layers of the atmosphere is derived using a complex algorithm.
According to the UAH today, temperatures appear to have been an average 0.1 °C warmer over the past five years than over the 10 years before that. Thus, Strengers has won the wager. The stakes: a good bottle of wine.
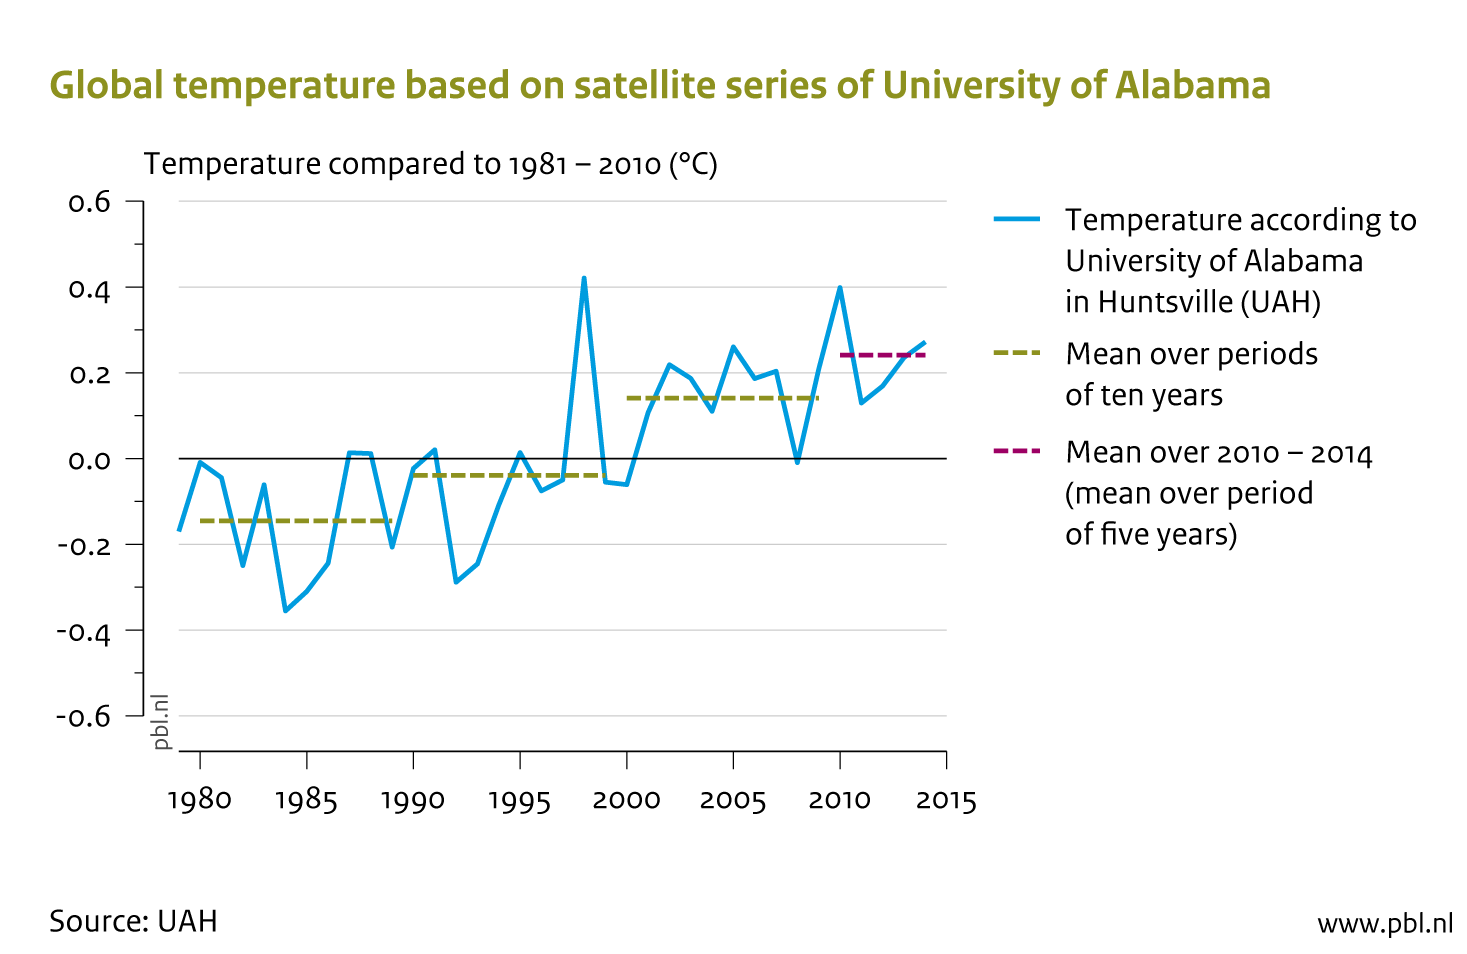
The UAH temperature series since 1979 (no satellites were available for the period before then). The green lines represent the mean over periods of 10 years. The purple line on the far right is the mean over the 2010–2014 period.
UAH satellite data series shows the greatest warming
Precisely these UAH data, incidentally, show by far the most warming. The 4 other main global temperature series also show warming over the last 5 years, but one that is markedly lower (between 0.03 and 0.05 °C).
What causes the differences between the data series?
The table below shows the global warming, in °C, over the past 5 years, compared to the 10 years before that, for the five main global temperature series: the satellite series of the University of Alabama in Huntsville (UAH) and of the Remote Sensing Systems (RSS), and the surface temperature series of NASA, Climate Research Unit (CRU) and the National Climatic Data Centre (NCDC). CRU’s series are based on surface temperature measurements up to and including November 2014, as data on December were not yet available.

The large difference (by more than a factor of 3!) between the UAH and RSS satellite series is remarkable (also see the graph below). According to the UAH team, in which two well-known climate sceptics are involved, the difference is mainly caused by the fact that RSS partly bases its series on an old satellite (NOAA-15) with an increasingly lower orbit around the earth. This causes an error in measurements that is insufficiently corrected by RSS. All in all, it is a technical and complex issue, which possibly causes the differences, but it mainly shows how complicated the procedure is for determining global temperatures on the basis of satellite measurements. The three surface measurement series provide a much more consistent image of between 0.04 °C and 0.05 °C warming.
Satellite temperature measurements difficult to compare with surface measurements
In addition, it is important to note that satellite and surface measurements are difficult to compare. This is due to the fact that satellite series are based on the temperature of the entire lower troposphere (the lowest 5 km of the atmosphere). The temperature of this atmospheric layer is, for example, much more sensitive to El Niños than surface temperatures are. This is illustrated in the graph below by the relatively high peak for the two satellite series at the time of the super El Niño in 1997–1998 and the less strong El Niño of 2010. The reverse is the case for La Niñas, such as the strong one of 2008; here, satellite series typically show a lower temperature.

Temperatures according to 2 satellite series (UAH and RSS). The purple line indicates the mean of the three surface temperature series. The satellite series show peaks in 1998 and 2010, as a result of El Niño, which are greater than those in the surface temperature series. The low satellite value for 2008 coincides with the opposite of an El Niño: La Niña. Note how the last 4 years in the RSS series are far below those in the other series. According to the surface temperature measurements, 2014 was the warmest year on record!
The graph shows that the last years in the RSS series clearly deviate from the other temperature series, with lower values of over 0.1 °C. This suggests that RSS rather than UAH is too low (as also claimed by the UAH team). The outcome of this discussion may lead to adjustments to one or both satellite series, as has been done in the past, particularly to the UAH series, on numerous occasions.
The surface temperature series further indicate that 2014 was the warmest year on record, even without an El Niño!
Contribution by cooling and warming influences
Strengers indicated at the time that ‘in light of the scientific uncertainties, I may lose, but this is not likely to happen’. He gave four reasons why a possible reduction in warming, or even a cooling could occur. Bold indicates that the related reason more or less became a reality over the past 5 years.
- a continued (relatively) low solar activity;
- a relatively high heat absorption by the (deep) oceans;
- a period of cooling due to incidental variations in the climate;
- lower climate sensitivity than expected.
In addition, Strengers gave three reasons why he nevertheless expected to win:
- a further increase in greenhouse gas concentrations in the atmosphere;
- the ‘best-estimate’ by the IPCC is that of a warming of 0.2 °C per decade;
- the chances of overestimating climate sensitivity are smaller than those of underestimation.
The sum of all factors, thus, has led to continued warming. Below each of these factors is explained in more detail.
Continued (relatively) low solar activity
Over the past 5 years, the reduced solar activity has continued and, thus, likely also has slightly reduced global warming over that period. In the discussion at the time, Strengers wrote: ‘astrophysics […] cannot rule out the possibility of a long period of relatively low activity. This could lead to a reduction in warming of up to 0.4 °C (although 0.2 °C is more likely) over the coming 20 to 30 years.’ The past 5 years, therefore, are in keeping with the idea that such a period of relatively low activity is a fact, but the degree to which this reduction will actually continue over the coming years, or for how long it will go on, is still very uncertain.
Relatively high heat absorption by the (deep) oceans
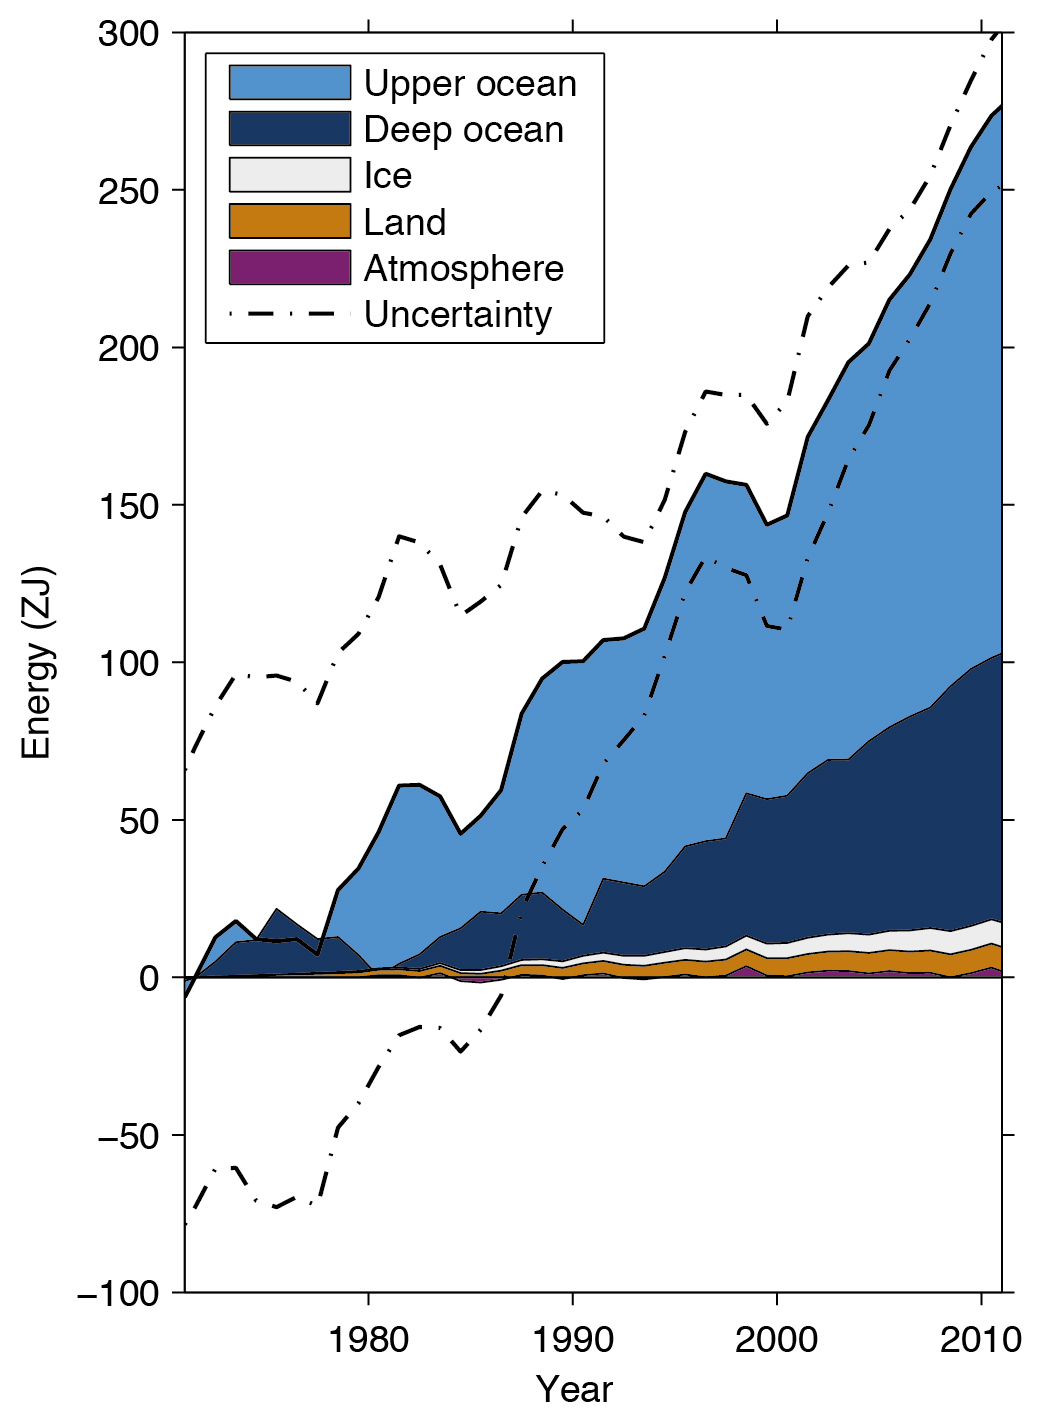
Over 90% of the heat that is added to the climate system, particularly caused by the increase in greenhouse gases, ends up in the oceans. Only a few per cent is stored in the atmosphere. The remainder is absorbed by the land surface and ice sheets (which are therefore steadily melting). Variations in heat absorption can have a large impact on surface temperatures. According to a recent study by England et al., published in December 2013 in Nature, there has been increased heat absorption by the oceans since 2001, which since then has reduced warming by 0.1 to 0.2 °C. The added heat seem to be concentrated largely around the equator in the western part of the Pacific Ocean, at a depth of around 125 to 200 metres, which means it remains ‘hidden’ from the atmosphere. England and his team do not expect this heat storage effect to continue in this way and they project that, at a certain moment, temperatures at the surface level will begin to increase more rapidly. This could happen, for example, due to an El Niño with large amounts of heat being released suddenly, possibly causing temperatures to jump, as happened in 1997–1998 during the so-called super El Niño. Over the past months, a new El Niño seems to be developing. If this continues into 2015, this year may end up being even warmer than the record year of 2014.
A period of cooling due to incidental variations in the climate
The climate knows random variations. Strengers wrote that these may lead to longer periods of no warming or even cooling, even under a steady increase in greenhouse gas concentrations in the atmosphere. During the discussions, Strengers pointed to a study which shows on the basis of climate models that periods of up to 16 years of random cooling or non-warming may occur, even in an overall warming climate. Recent research shows that a combination of random factors likely has led to a reduction in temperature increases over the past 15 years (see the section below, ‘IPCC’s ‘best-estimate’ is that of a warming of 0.2 °C per decade’, for more details). However, this reduction in warming was not high enough for the past 5 years to be cooler than the decade before that.
Lower climate sensitivity than expected
The IPCC – the scientific body that inventories all knowledge on climate change every 5 to 7 years –stated in 2007 in its fourth assessment report (AR4) that climate sensitivity was likely (i.e. with a likelihood of 66%) between 2.0 and 4.5 °C, with a ‘best estimate’ of 3 °C. The fifth assessment report (2013) stated a range of 1.5 to 4.5 °C without giving a ‘best estimate’. The reason for the downward adjustment of the lower limit to 1.5 °C (at which it had been estimated since 1990) originated from a number of studies that pointed to the possibility of a low climate sensitivity. The ‘best estimate’ was not provided “because of a lack of agreement on values across assessed lines of evidence and studies” (i.e. based on all studies up to and including July 2012). All this, however, does not mean that climate sensitivity was ‘less than expected’. In fact, the only thing that can be concluded is that the value of climate sensitivity has become more uncertain.
Further increase in greenhouse gas concentrations in the atmosphere
Greenhouse gas concentrations in the atmosphere have steadily increased over the past 5 years. By late 2014, CO2 concentrations were at 399 ppm (399 molecules of CO2 per million molecules of air). Five years ago this level was 388 ppm. The increase is a direct result from an ever faster increase in CO2 emissions, particularly in countries such as India and China.
IPCC’s ‘best-estimate’ is that of a warming of around 0.2 °C per decade
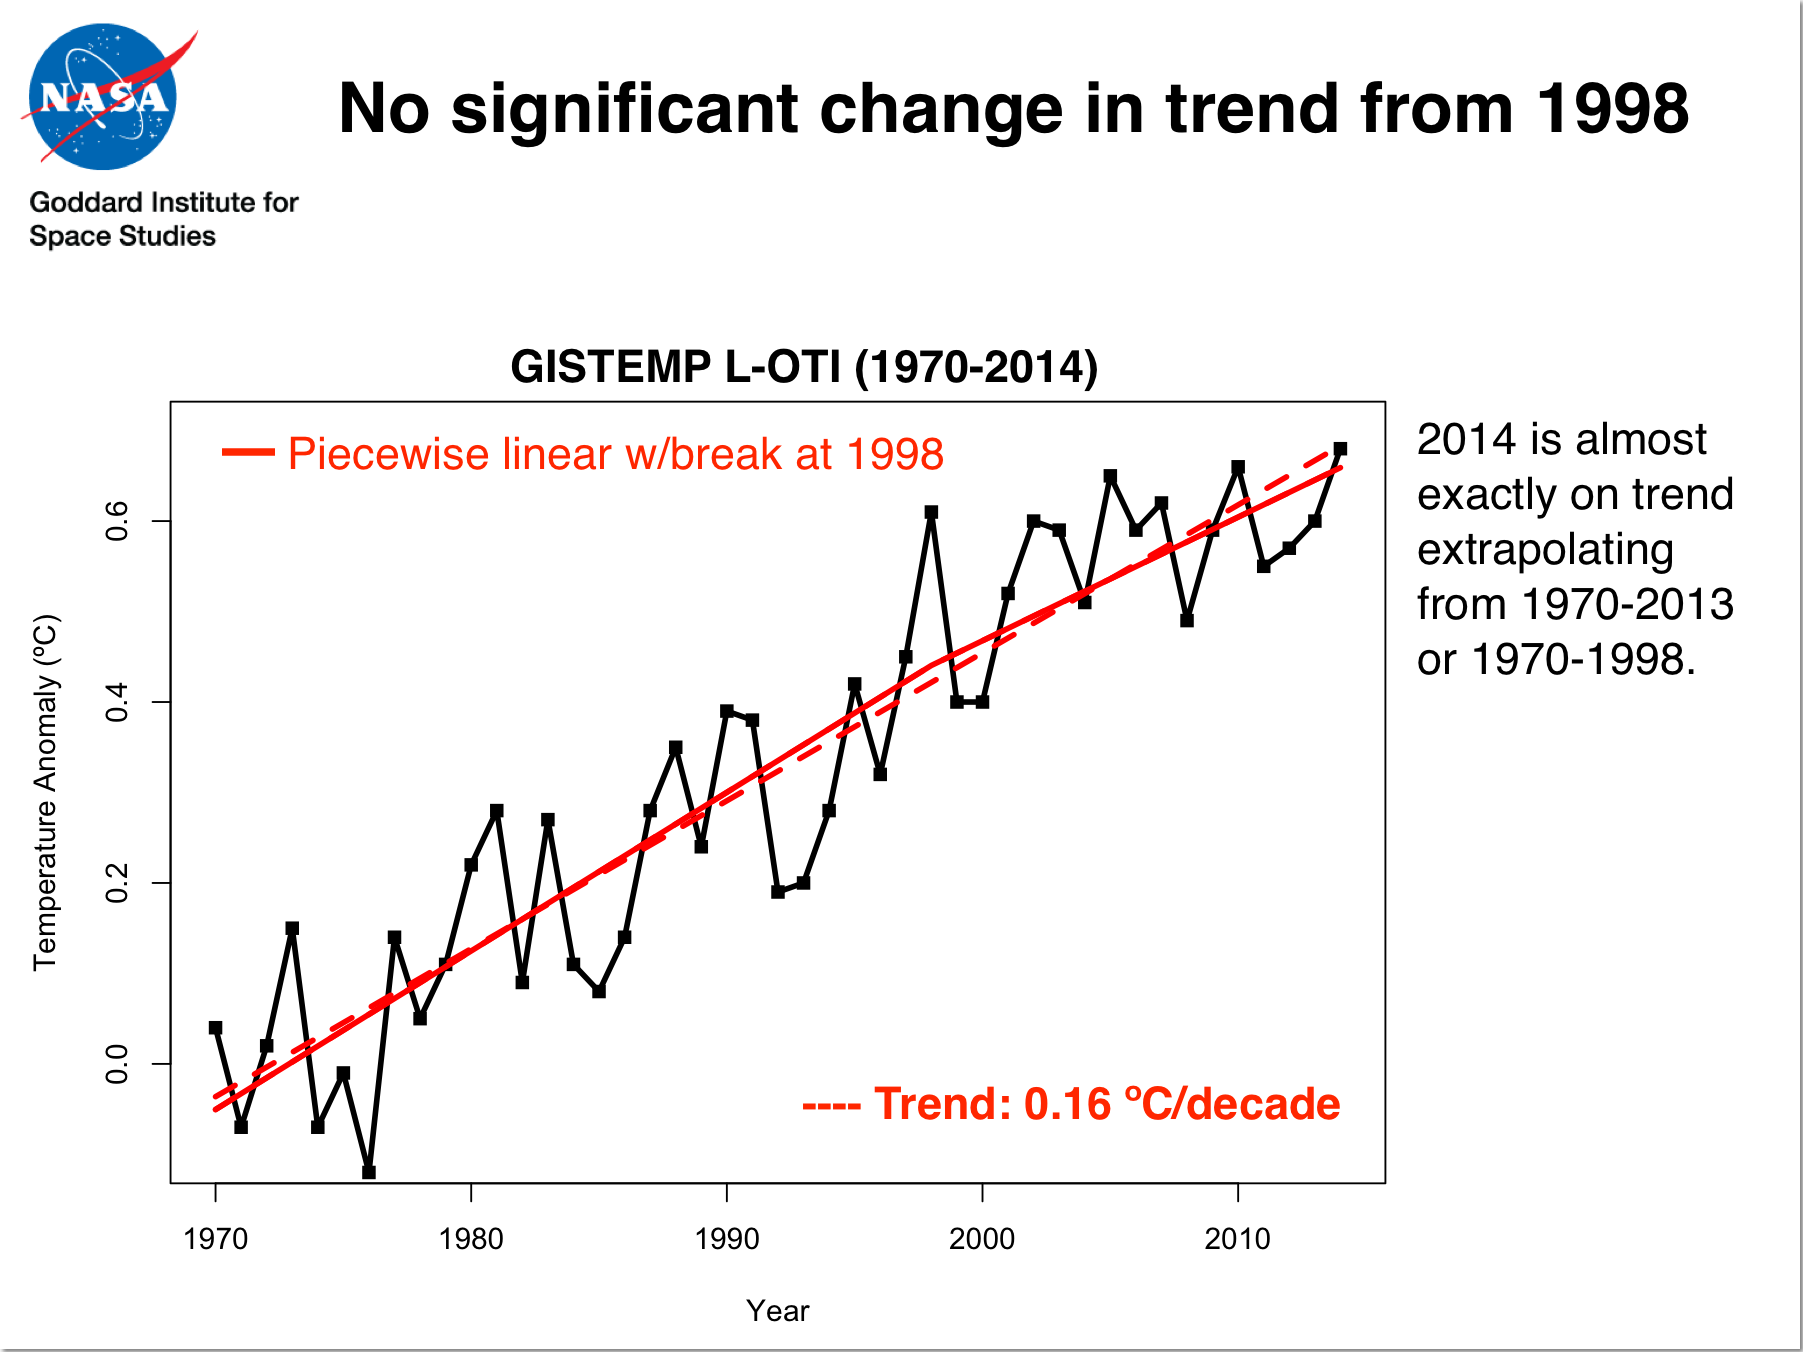
At the time of IPCC’s fourth assessment report, in 2007, a global warming of 0.2 °C was assumed for the current decade (2010–2019), particularly on the basis of climate model results. As discussed above, the degree of warming according to the UAH series, which is based on satellite measurements, was 0.1 °C over the last 5 years, compared to the mean of the 10 years before that. If this trend continues over the coming 5 years, our current decade will register a warming of around 0.15 °C – slightly less than the ‘best estimate’, but well within the projected range by the IPCC. However, all surface temperature series show a lower degree of warming, between 0.04 and 0.05 °C, over the past 5 years (see the section on ‘What causes the differences between the data series?’). Extrapolation over the 2010–2019 decade shows a total maximum warming of 0.08 °C [typo fixed]. This is in line with the discussion on the ´hiatus´ or the finding that the rate of warming over the past 15 years has been lower than in the 20 years before that, and also lower than the average outcome of many climate models. Note though that there is no significant change in trend from 1998. If climate model calculations take into account the ´random factors´ that cannot be predicted, such as the occurrence of El Niños, solar activity, and volcano eruptions, then models and observations seem much more in agreement.
The chances of overestimating climate sensitivity are smaller than those of underestimation
The IPPC’s fifth assessment report (2013) states that climate sensitivity is likely (66% probability) to be between 1.5 and 4.5 °C. It subsequently states that it is extremely unlikely (less than 5% probability) to be smaller than 1, and very unlikely (less than 10% probability) to be higher than 6. In other words, very low values are less likely than very high values, which substantiates the above statement.


Bart, congratulations, not only on the win, but for turning the incident on an excellent scientific commentary.
I am sure the wine did not taste bad, either!
God, if only the stakes were really only a good bottle of wine.
Thanks Bart good read and interesting.
You rightly highlight that there are papers suggesting a low CS recently and that given all thign matural we should be cooling, however have you also considered the several papers than suggest the CS might be higher than thought at ~4C but less than 5C and greater than 3C.
"The mixing inferred from observations appears to be sufficiently strong to imply a climate sensitivity of more than 3 degrees for a doubling of carbon dioxide. This is significantly higher than the currently accepted lower bound of 1.5 degrees, thereby constraining model projections towards relatively severe future warming."
Steven C. Sherwood, Sandrine Bony & Jean-Louis Dufresne, "Spread in model climate sensitivity traced to atmospheric convective mixing" Nature 37, vol 505, 2 January 2014
In medical practice a 95% chance of success is generally considered reasonably safe when taking actions, 99% is preferable and less than this and things became deemed quite risky.
Therefore shouldn't we be considering, what is the CO2 accumulative emissions amount that would give a 95% chance of avoiding greater than a 2C in the next 100 years?
And if the evidence in the paper holds true, (which is likely considering all that heat going into the oceans etc.) then the range for CS would start at 3C and end at 5C. A shift in the CS range of that nature would significantly reduce the carbon budget estimations currently being made for policy makers to ponder.
Further maybe we should even be asking what is the total GHG emissions that gives a 95% chance of keeping earth lower than 2C for the next 300 years, given that prevention is better than cure for future generations?
And is 2C even safe?
As the only way to actually turn the CO2 heater down is to remove CO2 from the atmosphere, do we actually have a carbon debt rather than a budget already?
" the degree of warming according to the UAH series, which is based on satellite measurements, was 0.1 °C over the last 5 years, compared to the mean of the 10 years before that. If this trend continues over the coming 5 years, our current decade will register a warming of around 0.15 °C"
(From the second-to-last paragraph.)
I don't follow this. If we had .1 degree warming over the first five years, would we expect .2 degees over the decade "if the trend continues"?
Also, I was surprised to see no mention of volcanoes. Couldn't a major volcano eruption have through a major spanner into these rather short-term predictions?...
ranyl asks: "...do we actually have a carbon debt rather than a budget already?"
Certainly, yet, imho.
China sulfate emissions reductions from 2009 are also a major contributor to the recent warming trend. The secondary cloud effects appear to be at the higher end of the uncertainty spectrum (more negative).
Re.: "A period of cooling due to incidental variations in the climate
The climate knows random variations. Strengers wrote that these may lead to longer periods of no warming or even cooling, even under a steady increase in greenhouse gas concentrations in the atmosphere. During the discussions, Strengers pointed to a study which shows on the basis of climate models that periods of up to 16 years of random cooling or non-warming may occur, even in an overall warming climate." it may just be I'm not reading this right, but this seems to suffer from Gambler's Fallacy reasoning. That is unless he is invoking autocorrelation which does, in fact, allow such reasoning.
In any case it might be worded more clearly.
JJA:
citation?
jgnfld - There certainly is autocorrelation observed in the temperature record, which can be characterized as ARMA(1,1) in nature (Foster and Rahmstorf 2011, Appendix on Methods). A signal of that nature can easily show >15 year negative trends as variation over an underlying positive trend, as discussed at the end of this post with artificial data.
In addition, the GCMs produce much the same behavior from the physics, demonstrating autocorrelation and in effect inertia in variations. So the statement is entirely reasonable.
http://www.nature.com/ngeo/journal/v7/n4/full/ngeo2091.html
Michael
Anthropogenic aerosols and their indirect cloud effects are primary drivers of the PDO, this is only the first of preliminary results:
In both time periods, anthropogenic aerosols act to modify the Pacific Decadal Oscillation and therefore contribute to the width of the tropical belt.
In addition, Booth et. al (2012) correlated influence of aerosols on AMO http://www.nature.com/nature/journal/v484/n7393/full/nature10946.html
Though Zhang et. al has placed this observation in doubt. http://www.gfdl.noaa.gov/blog/isaac-held/2013/02/15/35-atlantic-multi-decadal-variability-and-aerosols/
However, the unanswered questions regarding fluctuations in the AMOC driven by aerosols that Zhang brought up raises even more interesting questions regarding interhemispheral aerosol forcing effects on the AMOC and regional forcing effects on surface wind patterns in the South West and North East Pacific.
I firmly believe that when these aerosol-ocean interactions are fully investigated we will find an entirely new anthropogenic fingerprint on surface warming. If I am correct, we will see a very large increase in surface temperatures over the coming years as China is set to reduce her aerosol emissions profile significantly with emissions controls and a likely regional economic slowdown.
jja #5
"China sulfate emissions reductions from 2009 are also a major contributor to the recent warming trend"
As Michael already indicated in #7, I would sure like to see a citation for this claim. I did a little presentation last year on energy consumption trends, and, as recently as 2012, China's voracious hunger for the nasty black stuff was showing no sign of abatement.
Quoting an information brief from the US Energy Information Administration dated 14th May 2014...
"Chinese production and consumption of coal increased for the 13th consecutive year in 2012. China is by far the world's largest producer and consumer of coal, accounting for 46% of global coal production and 49% of global coal consumption—almost as much as the rest of the world combined"
Given that their consumption rate was still on the rise, it would be very interesting to learn what practices had been introduced that would result in a reduction in sulphate release!
Cheers Bill F
jja #9
Sorry, your response to Michael arrived whilst I was typing my #10.
I'll have a plough through the citation you kindly provided.
Cheers Bill F
jja #5 & #9
I've had a look at the citation provided in #9, and, apart from the abstract, it is sadly behind a paywall. However, I found an article on a very similar topic to which you refer - interaction between Tropical Belt Width and the PDO - here on the AMetSoc web site.
What I failed to find there was anything that remotely supported your comment (#5) concerning "China sulfate emissions reductions from 2009...". As stated in my #10, the information to hand suggests that China's sulphate emissions should be growing - hence causing a negative forcing (direct and indirect).
There are three explanations that immediately spring to mind...
1) I am developing selective blindness,
2) Something (behind the paywall) in your citation talks about Chinese sulphate reductions, or
3) You have inadvertently linked to the wrong article
Cheers Bill F
jja,
Thanks for the references. I have always thought China aerosols would be important and am interested in seeing what is known.
Bill: I understand that they are installing scrubbers on a lot of generators in China. They are installing scrubbers because their pollution problem is so bad. They are also replacing old units with newer, more efficient ones with scrubbers. This means they can reduce sulfate emissions while increasing consumption of coal. A quick Google gave me several news articles that were long on story and short on data. Supposedly the central government is forcing facilities to run the scrubbers because they are concerned about the terrible smog. It makes sense that they would try to reduce smog but it will take some time to get in the peer reviewed system.
KR: Foster/Tamino aggregate at monthly intervals so of course there is a lot of autocorrelation. Aggregating at annual intervals tends to wash all or most away as shown by nonsignificant autocorrelation tests when you check. I have not checked the various series at half-decadal aggregations, but I suspect autocorrelation would be quite low at that level.
I like the bet and given the magnitude of the long term trend I would have supported making it especially as the criterion was a simple rise of any magnitude greater than zero. I just disagree with that one particular bit of reasoning.
jgnfld - Good point, autocorrelation isn't a huge factor at 5 years or more.
However, decadal and multidecadal internal climate variations such as ENSO, PDO, and the solar cycle have considerable impact on that scale, and again the possibility of >15 year low or negative trends driven by variations, overlaying longer term positive trends from GHGs, is not to be discounted.
It's noteworthy that GCM runs exhibit similar emergent behavior when driven by basic physics.
Michael #13
During the build up to the 2008 Bejing Olympics, the problem of atmospheric pollution (especially the PM2.5 crap) really started to get aired. (Pun intended.)
My, admittedly very limited, understanding was that steps were certainly taken to reduce pollution in the vicinity of the Olympic venues, but that's hardly the same as country-wide. The Real Time Air Quality Index doesn't make for very comforting reading, although some areas in/around Bejing are better than others.
Although many might distrust the source on principle, Greenpeace announced on 22nd Jan 2015 that Jia Zhangke, a Chinese filmmaker, had just released a short documentary dealing with the ongoing air pollution problem in China.
I still remember Stephen Chu (Nobel Laureate and Secretary for Energy in President Obama's first term) and has "coal is my worst nightmare" views.
Hence my scepticism regarding a reduction in sulphate emissions since 2009. It is obviously possible to increase coal consumption whilst reducing emissions, I'm just taking it with a pinch of salt until I see something a bit more concrete.
Cheers Bill F
Oops - typo!
Penultimate paragraph in my #16 should read...
... Stephen Chu... and his "coal is my worst nightmare" views
I believe that these are underestimates (the pre-2008 values were actually higher than reported)
http://iopscience.iop.org/1748-9326/8/1/014003/pdf/1748-9326_8_1_014003.pdf
The last decade of global anthropogenic sulfur dioxide: 2000–2011 emissions
Klimont et. al. (2013)
We are very soon approaching the "locked-in" 2C warming threshold.
jja #18 & 19 (& Michael #13)
Thanks for the IOP reference in #18 - it makes interesting reading and was certainly more concrete than the earlier paper I looked at.
I did, however, notice some weasel words in there. For example, at the bottom of the second page...
For instance, in China installation and increased operation of flue gas desulfurization (FGD) for existing and new plants (Xu 2011, Zhang et al 2012) has caused a reduction of emissions compared with previous expectations
The last 4 words in that sentence open a real can of worms. Also, the text box accompanying Fig 2 of the paper does refer to estimates, rather than empirically derived values. (I could be splitting hairs here, but reducing an estimate ain't necessarily the same as a real reduction.)
The authors also observe that the aforementioned FGD improvements only really apply to power generation, not to transport, domestic usage and non-power related industry, where they continue to spiral upwards. They also point out that, consequently, the relative contribution from power is rapidly declining viz-a-viz these other sources.
Worryingly, India does not appear to be following China's lead in trying to retrospectively clean up its act.
Finally, can I just point out that the paper in question was specifically addressing the issue of anthropogenic SO2: it was not looking at other aerosols, and it may be a step too far to assume that these are also on the wane. I don't think we can necessarily just write off the grey literature on this one.
However, I do hope you're right and I'm wrong. If aerosols concentrations are still on the rise worldwide, then this will serve to hold back the worst excesses of climate change - but for a limited period only. The shit will then really hit the fan when we see a sudden significant aerosol reduction at some indeterminate point in the future. All the while, the ostrich brigade will be taking us on an irreversible "burn, baby, burn" route.
On that cheerful note... Bill F
PS I totally agree with your assessment in #19
I agree with the article but I think the heading
"The chances of overestimating climate sensitivity are smaller than those of underestimation"
should read
The chances of underestimating climate sensitivity are smaller than those of overestimation.
The body of the text gets it right with
"It subsequently states that it is extremely unlikely (less than 5% probability) to be smaller than 1, and very unlikely (less than 10% probability) to be higher than 6. In other words, very low values are less likely than very high values, which substantiates the above statement."
Personally I wish the worlds governments were habitually over estimating the climate sensitivity like every good "conservative" should be doing!
Paul W, the text you quoted does not support the statement that you prefer. One way to paraphrase that text would be to say: the probability that sensitivity will be very low is extremely small whereas that of being very high is very small; both "very" and "extremely" are clearly quantified.
This is quite a different statement than saying that there is higher probablility for the range of sensitivity currently considered most likely to be either higher or lower than real. In fact, it is different enough that nothing from the text you quote can translate into such a statement. That would be a different problem entirely. It just says that the chances of sensitivity to be very low is less than to be very high. Nothing else can honestly be extracted from these words.
Just to try another stab at what Phillippe wrote, in response to Paul W. I think another way of paraphrasing the first quote that Paul disgrees with is, "Regarding the estimate of climate sensitivity, it is less likely to be an overestimate of the real sensitivity than it is to be an underestimate of the real sensitivity". Or, to put it another way, "the real sensitivity is more likely to be higher than the estimate than to be lower than the estimate".
Wili, yes, that sounds counter intuitive but consider that the average temp increase over the last 5 years was 0.1C. That's the same as 0.1C of warming (above the 2000-2009 decadal average) every year of the first 5 years of this decade. I suppose the trend continuing would be a further 0.1C of warming, on average, over the next 5 years which would be the equivalent of having each of those years being 0.2C warmer than the average temp of the last decade. Combinine those hypothesised next 5 years, with the last five years (5*0.1 + 5*0.2 = 1.5) and you end up with an average of 0.5 (1.5/10).
Oops. I wish there was editing on these posts. Of course, the last piece of the last sentence of my last comment should read "with an average of 0.15 (1.5/10)".
Hits forehead with hand, and wishes he's prood-read the comment before posting. especially as "Combinine" should have been "Combining". Oh well.
Tony, I don't totally agree. Once again, the statement only pertains to the probability of either very high or very low sensitivity. Technically, what you say is true: Because that probability is greater for very high, there is indeed greater chance that the real sensitivity could end up very high than very low. However, I think that calling that "underestimate" is a little misleading. It would be more accurate to say that, if senstivity is much more than predicted, it is more likely to be higher than predicted instead of lower. A little long and convoluted but more in line with the original statement.
Thanks a lot for all your comments!
Below I tried to answer most of them:
@ranyl: I surely have considered that the CS might be higher. I just explained why the lower bound of the IPCC-range has been lowered from 2.0 to 1.5 in AR5.
Studies of my institute (Netherlands Environmental Assessment Agency, PBL) show that a >50% change to keep the warning limited to 2 degrees, implicates a major emission reduction effort with negative emissions by the end of this century.
If you want a bigger than 95% change, this reduction effort will be even higher. We did not study the implications of even lower temperature limits, but I think you are right this might result in a current negative carbon budget.
@Wili: I did not write we have 0.1 degrees warming in 5 years, but that the average temperature in the period 2010-2014 was 0.1 degrees higher than the average of the 10 years before that. TonyW explains how this results in 0.15. (UAH has a linear trend of 0.14 starting in 1979 by the way). Furthermore, you are right that volcanoes can result in a ‘cold’ year and thus can have a large influence on the average of an extremely short period of just 5 years. This is precisely one of the reasons why I said in 2009 that I could lose the wager.
@jja: Interesting publication. In the Dutch media I wrote that I think that the change the next 5 years will be warmer again than the 10 before is at least as big as 5 years ago. Aerosol emission reductions in China - as far as it is really true, given the discussion in this tread - might be another reason why this will probably be the case.
@Paul W and Philippe: You are right there is a problem there. What I meant in 2009 is that the integral of the pdf on the left of the ‘best estimate’ of 3.0 is smaller than the integral on the right. In other words P(ECS<3.0) < P(ECS>3.0). P(ECS<3.0) is the chance that the real world ECS is lower than the best estimate and thus that the best estimate is an overestimation. And according to the same reasoning P(ECS>3.0) means that the best estimate is an underestimation. However, there are two problems here. The first is that I am not so sure anymore that the proposition P(ECS<3.0) < P(ECS>3.0) was actually true in 2009. I would love to hear your opinion on that. The second problem is that in AR5 there is no best estimate anymore, so it is actually impossible to say whether my proposition still holds. Because it was too complicated to explain this to a broader audience, I tried to make the point I did. I might have done that differently now, though.