


 Arguments


Ted Cruz fact check: which temperature data are the best?
Posted on 18 January 2016 by dana1981
The information in this post has been incorporated into the new rebuttal to the myth 'satellite [temperature] data are the best data that we have,' available at sks.to/satellite
Satellites don’t measure the Earth’s temperature. Senator Ted Cruz (R-TX) and his fellow climate contrarians love the satellite data, but as Carl Mears of the Remote Sensing Systems (RSS) satellite dataset and Ben Santer recently wrote,
they are not thermometers in space. The satellite [temperature] data ... were obtained from so-called Microwave Sounding Units (MSUs), which measure the microwave emissions of oxygen molecules from broad atmospheric layers. Converting this information to estimates of temperature trends has substantial uncertainties.
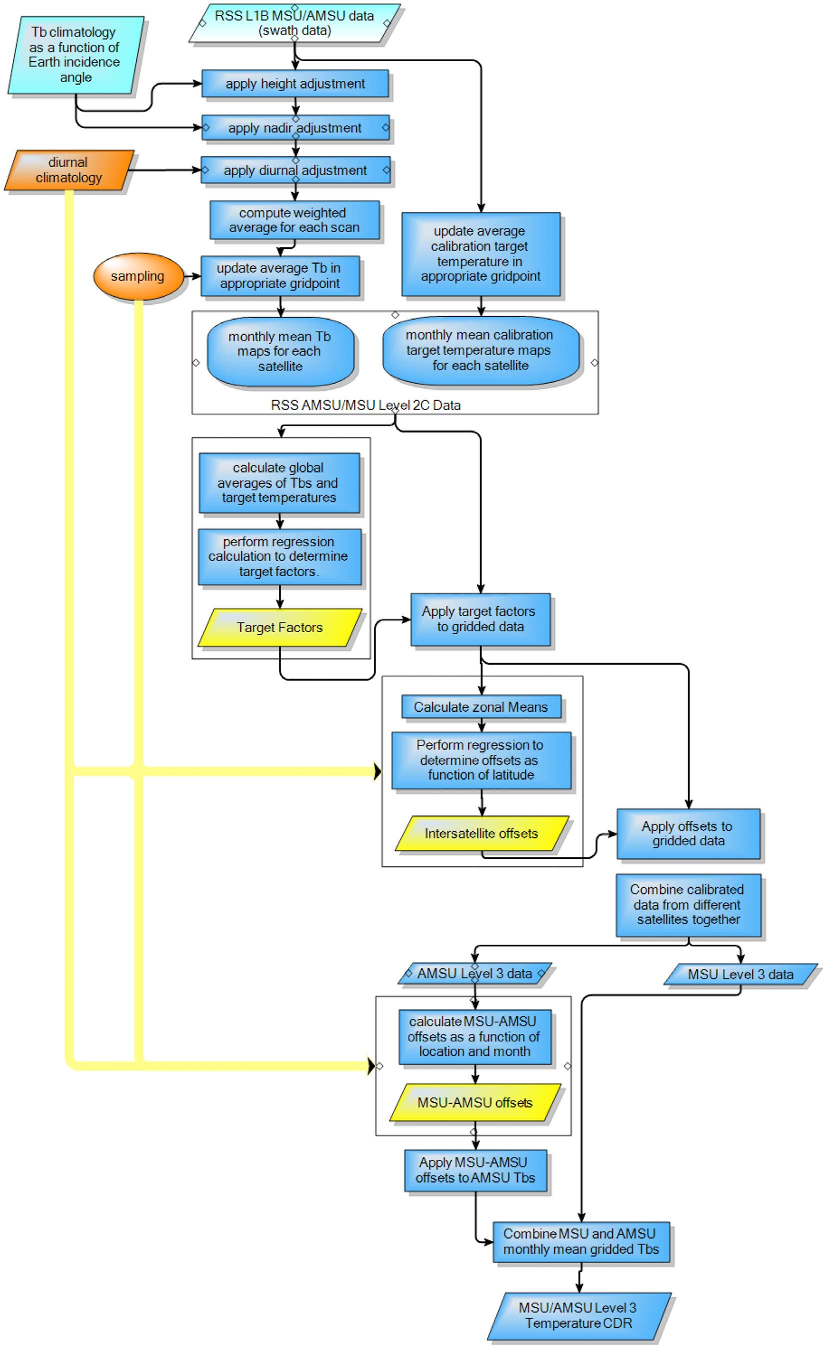
Scientists process the raw microwave data, applying a model to make numerous adjustments in order to come up with a synthetic estimate of the atmospheric temperature. Climate scientists have identified many errors in the model, and so it’s undergone several major revisions. It’s a complicated process for many reasons discussed in greater detail in this new Skeptical Science myth rebuttal, and by Mears and Santer.
For example, satellites have a limited lifetime and are replaced (so far there have been 10 different satellites with MSUs); the MSU instruments change - they now use advanced MSUs (AMSUs); their orbits drift and decay due to friction; clouds get in the way; they have to isolate the data from the different layers of the atmosphere, etc.
In a recent Senate hearing, Ted Cruz and one of his witnesses, Judith Curry, claimed “the satellite data are the best data we have.” Most experts disagree.
Video by Peter Sinclair for Yale Climate Connections.
What makes “the best” the best?
At first blush the claim sounds plausible. After all, satellites are high tech! But how do we decide which data are “the best”? That’s a subjective question, but we can apply some objective criteria to answer it.
For example, as humans, we might consider the temperature where we live (at the Earth’s surface) the most important. Satellites estimate the temperature of the atmosphere, most of which is above us. In fact, as John Christy, who runs the University of Alabama at Huntsville (UAH) satellite dataset recently said,
the main product we use now for greenhouse model validation is the temperature of the Mid-Troposphere
The mid-troposphere is the atmospheric layer from about 25,000–50,000 feet, or about 8–15km in altitude. For perspective, the highest point on the Earth’s surface is on Mount Everest at 29,000 feet (8.8km), and the highest elevation cityin the world is La Rinconada, Peru at 16,700 feet (5.1km). So, by this criterion, surface temperature data would be “the best;” better than satellite data because they’re more relevant to people.
Maybe we value the data with the least uncertainty. Because of all the processing, adjustments, and modeling involved in creating the synthetic temperature data,satellite trends have far greater uncertainty than the surface temperature datasets. By this criterion, surface temperature data would again be “the best;” about five times better than satellite data.
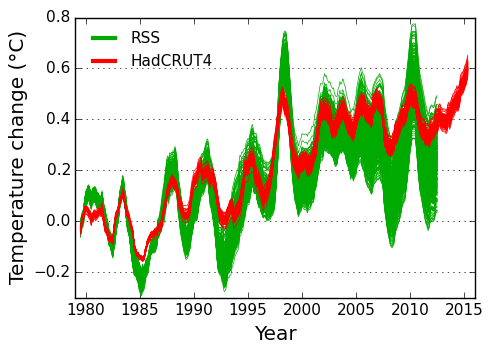
RSS satellite temperature data and HadCRUT4 surface temperature data with uncertainties. Illustration: Kevin Cowtan
Or perhaps we think it’s important that different groups processing the same raw data in different ways arrive at consistent final temperature estimates. This is true for surface temperature data, which are analyzed by NASA, NOAA, the Met Office,Berkeley Earth, Cowtan & Way, the Japan Meteorological Agency, and others. These groups all arrive at consistent end results.
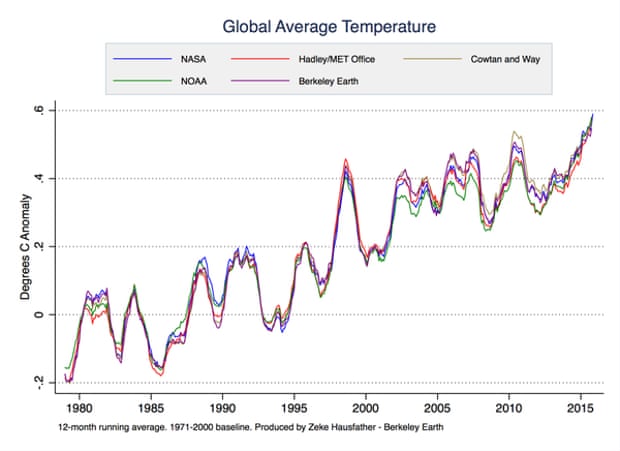
Various global surface temperature datasets. Illustration: Zeke Hausfather
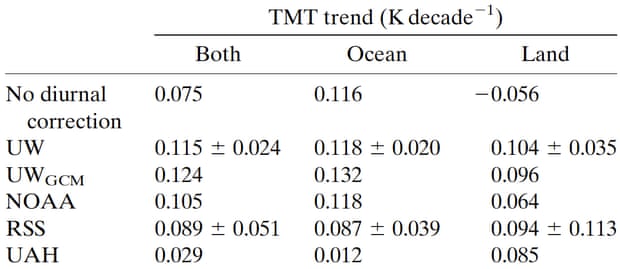
On the other hand, different groups processing the same raw satellite data arrive at very different estimates of the warming trend in the atmosphere. By this criterion, again, surface temperatures beat satellites. As Carl Mears has said,
I consider [surface temperature datasets] to be more reliable than satellite datasets (they certainly agree with each other better than the various satellite datasets do!).
Tropical mid-troposphere temperature satellite trend estimates from different groups using different diurnal drift correction approaches. From Po-Chedley et al. (2014).
Maybe we consider it important to measure how much humans are warming the entire planet. Only about 2% of the heat trapped by increased greenhouse effect goes into warming the atmosphere; over 90% goes into warming the oceans. By that criterion, ocean heat content data would be “the best;” far better than satellite data.
One benefit noted by proponents of the satellite data is that it’s validated by weather balloons directly measuring the temperature of the atmosphere. The problem is, the weather balloons indicate that the lower atmosphere has continued to warm in recent years, diverging from the satellite synthetic temperature estimates. That’s not much of an argument in favor of the satellite data.

Estimates of the temperature of the lower troposphere from satellites by RSS vs. weather balloons by NOAA (RATPAC). Created by Tamino at the Open Mind blog.
In fact, the weather balloon data debunks the “no significant warming since 1998” myth that motivates contrarians like Cruz to cherry pick the satellite data in the first place. It’s also worth noting this myth is based on über cherry picking.
So, the surface temperature data are “best” if you value the least uncertain temperature measurements, of the part of the planet where people live, with consistent results among different groups. The ocean heat data content are “best” if you want the most comprehensive measurement of the warming of the Earth.
The satellite data are best … if you want the data that show the least warming.
Solution: best to use all the data!
As Carl Mears notes starting at the 7:35 mark in the above video,


Thanks. The last sentence says it all!
What. In the world. Is going on with Judith Curry? Does anyone have any insight into her perspective? Christy and Spencer are well known to be down the path of right wing religious zealotry... but what's the story with Curry?
[PS] Please stick to science.
J. Curry, judging by her website, relies upon a large amount of smoke & verbiage [ not "smoke & mirrors"! ] to cast a rather dense haze over the AGW topic. "Smoke" is the appropriate term, because the approach resembles the Haze of Uncertainty cast by Big Tobacco, for so many decades, to obscure the public's clear vision of the realities.
Cui bono? (as the lawyers would say). Money is always worth looking at ~ AFAIK no money is passed to her directly . . . unlike Dr Soon & a few others on the Silver Spoon of Heartland Spinstitute and suchlike hidden-donor propaganda machines. However, it is said that funds are paid into a company that she is closely associated with ~ and of course those funds would be used for expenses only (we would like to think!).
More importantly, in the cui bono line : for some types of personality there is a great attraction in notoriety ; in being seen as a maverick. I should imagine that this is quite a large factor, for those (handful) of real climate scientists who are turning a blind eye to the actual evidence.
And then, there's those all-expenses-paid trips for presenting testimony to Senate committees etcetera. All grist, for those who prefer 15 years of fame ( rather than the clichéd "15 minutes" ). Lights, cameras . . . and disinformation!
[PS] Multiple comments policy violations. Let's drop this and stick to science.
Wouldn't the Argo float data indicating an almost steady rise in ocean heat storage be the most significant indicator that the planet is heating up? Its physics, isn't it?
A bit of a shift in heat distribution in the ocean takes place, i.e. El Nino, and a major shift in global surface temperature results. The ocean is a big dog and average global surface temperature, or even less, average mid tropospheric temperature, are tiny tails.
The only thing that could account for the ongoing accumulation of heat in the oceans is that there is a planetary energy imbalance.
Running satellite data through a model to compute average global mid troposphere temperature is basically irrelevant compared to this, no matter what it says.
As I see it, the Ted Cruz type folks view this as a Perry Mason episode. Although the accused has 20 points of evidence indicating guilt, Perry always finds the one piece of evidence that refutes it all, shows his client is innocent and reveals the real murderer. They see themselves as Perry, and CO2 as the falsely accused. They think all they need to do is declare something about sunspots or cosmic rays and that will prove that CO2 is innocent.
The problem with that line of thinking is that while it makes for great TV courtroom drama, that is not how science works. There are many different, independent lines of evidence supporting the finding that excess CO2 in the atmosphere is warming the planet, and no single piece of contrary evidence can refute them all. Most of the contrary evidence doesn't even hold up to close examination.
We know with great certainty that CO2 absorbs infrared heat radiation. Nobody has proposed any mechanism that can possibly prevent CO2 from absorbing infrared heat radiation, and thereby causing the planet to warm. But even if they found such a mechanism, they would then still have to show how some other mechanism is warming the planet, with exactly the same characteristics as excess CO2. There is no known mechanism with such characteristics. So, that's two impossible tasks right there. But they continue to try to show that all the different temperature readings of the surface, ocean and air temperature are somehow wrong, that the measurements of heat flow into and out of the Earth are somehow wrong, and how the climate models are somehow wrong. how measurements of solar radiation are somehow wrong, etc. There is simply no single piece of contrary evidence they can possibly find that can refute all these different lines of evidence implicating excess CO2 as the cause of the warming of our planet.
What is the reason for the divergence between RSS and RATPAC that happens around 2013? There is pretty good agreement before that time.
The comment is made "On the other hand, different groups processing the same raw satellite data arrive at very different estimates of the warming trend in the atmosphere." I just don't understand why processing of the same data gives different results. Is it due to differences in compensating for satellite drift or satellite temperature or something else altogether? And is RSS more correct because those results agree more closely with surface stations? But as there is considerable emphasis on the fact that satellite and surface stations are not measuring the same thing is this a valid conclusion? I do apologise for this display of naivety/ineptitude/ignorance call it what you will. but I would be grateful if someone could explain why these differences occur. One further question, why use all the data if some are apparent outliers?
That's exactly it. The RSS ensemble is constructed from different plausible values for each of the model parameters and adjustments required to construct the satellite record from the raw brightness data.
The spread of the RSS ensemble is an indication of the uncertainty in those adjustments.
However there is a second source of uncertainty: Not only are there uncertainties in the parameters used within a particular reconstruction method, there are different methods. So there is a second source of spread which can be measured (if rather more crudely) by comparing products from different groups (and arguably different versions from the same group in some cases).
Both of these apply both to the surface and satellite record, which is why having multiple versions is useful. Having an ensemble spread for the individal methods is also important, but currently only Hadley and RSS provide these.
Alright, let me rephrase. In the video, Judith Curry asserts satellite data (presumably mid-trop MSU) is "the best data we have." I'm looking for a resource that clarifies her statement. Am unable to find, from her, a more detailed explanation of this statement. Anyone know what her reasoning is (presumably she has her reasons for this assertion).
So WHO is tamino? The link/site gives no indication who or what is behind it.
Tamino's identity is one of those closely held open secrets that everyone is aware of. He's a statistician named...(thwip) ACK! ...Poison...dart...to...the...neck.
Tamino is a statistician who has written a lot about global warming.
His blog is here, and the blog post containing the graph that compares RATPAC and RSS is here.
And Eli Rabett is really... (thwip!)... Aaaaagh!
Regarding #10, I wasn't trying to invite sarcastic stuff. Problem is if I don't know who someone is, not even the slightest hint, I'm inclined to be suspicious and the TAMINO site is suspect in my book. Though considering what Michael Mann has gone through, not proclaiming one's identity to the blogiverse is understandable.
knaugle,
Put 'Tamino is statistician' into your search engine. You should find your answer somewhere in that list.
(shwiff!) [dive roll]
Sorry, I wasn't actually trying to be sarcastic. I was just having some fun. It wasn't intended to be at your expense, but rather for your enjoyment.
The secret hint is, the book Tamino is selling in the sidebar is his own book.
We will probably never have the ability to measure the warming trend exactly. We have to just accept there is a warming trend of significance.
Perhaps we should apply Occams Razor. Temperatures are warming. This warming is not explained by solar energy. This leaves the greenhouse effect.
Richard Lawson
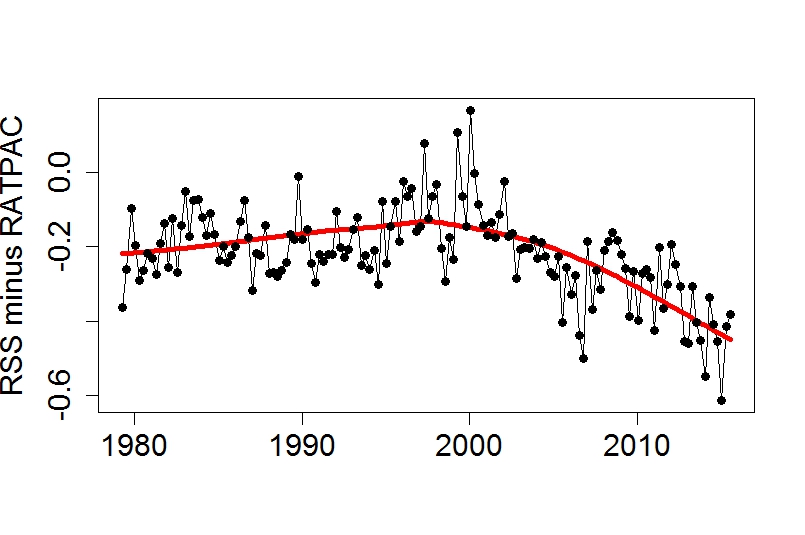
The following from the post by Tamino linked from here shows this more clearly.
Difference between RATPAC and RSS. Looks like the divergence started more like 2000. That is about the time the satellites switched from being fitted with MSU's to AMSU.
So the suspicion is that something changed with the switch. Some unexpected drift in the AMSU's. But no one knows what yet.
AuntSally @8, Curry says that not because it is the best method of measuring the Earth's temperature, but because it is the most useful piece of evidence she can point to that is contrary to the to consensus that the Earth is warming, and she sees herself in the Perry Mason role.
Here is an interesting article that addresses questions I've had for a while. How accurate are satellite measured temperatures of the troposphere? What are the issues with satellite indirect temperature measurements.
http://www.accuweather.com/en/weather-blogs/climatechange/some-of-the-issues-with-satell/54879902
Now that NOAA is out with its 2015 Annual SOTC report, you can bet many will be parading out Dr. Roy Spencer's results that show 2015 "only" 3rd warmest by UAH 6.0 satellite data. It's nice to understand the limits of his claim.
[PS] FIxed link. Please use the link button in the comment editor to create them yourself.
@BarryYou are correct. I did the search you suggested and sure enough he was named BY WUWT of all sites! :)
And along the way I found a rather scathing article by Tamino about some of A.W.'s accusations leveled at James Hansen and others.
Thank you.
Recommended supplementary reading:
Thorough, not thoroughly fabricated: The truth about global temperature data by Scott K Johnson, Ars Technica, Jan 21, 2016
Hi everyone. If I could get some help understanding why the Remote Sensing Systems (RSS) satellite data does not indicate 2015 as the hottest year on record.
The graph seems to show quite plainly 1998 as the hottest year and even 2010 as being hotter than 2015.
If I was to look at this graph I would say (possibly wrongly) 1998 far outsrips 2015 as the hottest year on record.
Thanks for any help understanding this.
Regards
MEJ
[PS] Um, that is largely what the article is about. Did you read it? 2015 is the hottest surface temperature on record (we dont live in the TLT). I would also watch this space if lag in response to El Nino in troposphere follows previous pattern.
Thanks Moderator. I read it till my brain hurts. I read the post and watched the video. Cool to see Dessler and Mears interviewed. I also read the link John Hartz posted above which also included UAH satellite data. Thanks for that John.
Oh, okay I have not understood SURFACE TEMPERATURE as opposed to Lower Troposphere Temperature (TLT). Two different places. One we don't even live in. That is my mistake. Add in the inaccuracies inherent in satellite data in the video. Also as I presume you are alluding to there was a 'lag time' for the heat from El Nino in 1998 being detected in the TLT by satellite readings.
Ok got it
Thanks
MEJ
MEJ @23 & 24, arguably the largest El Nino since 1950 occurred in 1997/98. As a result the GISTEMP Land Ocean Temperature Index set a new global temperature record of 0.47 C, a record it broke in the following year with a 0.63 C annual average (both relative to a 1951-1980 baseline). In contrast, RSS TLT only showed a distinctly non-record 0.1 C, only just shading 1987 and beaten by 1995. It then went on to a massive 0.55 C in 1998. (Records relative to a 1979-1998 baseline.) The reason for the very low temperature in 1997 relative to 1998 was the lag.
2015 is also arguably the largest El Nino since 1950, although I think it is smaller than 1997/98. Of course, there is a strong possibility that it will be referred to as the 1015/16 El Nino in the future. Regardless, the most comparable temperature from the 97/98 El Nino with which to compare the 2015 TLT temperature is 1997, which was not a record year. Well, at 0.36 C, 2015 isn't a record in the TLT series either, but it is a lot warmer than 1997, and is only beaten by 1998 and the 2010 El Nino year. Further, the most recent montly temperature (0.54 C) is very comparable to the 1998 annual record (0.55 C) and very close to most months in the 97/98 ENSO period as well.
So, the reason why 2015 is not a record in the TLT temperature series, while it is a record in the surface temperature series is very clearly the greater lag in response to ENSO events in the mid troposphere. The leaders of the denialist pushback against the extraordinarly warmth in the surface record for 2015 know this very well.
Thanks Tom for the more detailed info on the lag time between the satellites detecting the heat. Makes sense. It will be interesting to see the RSS data move up as it begins to detect it. Off course we pretty much walk about the surface of the Earth so surface temperature is what we live in not the troposphere 7 -10 klms above us. Thanks for all the info. Best regards MEJ
Recommended supplemental reading:
Explainer: how surface and satellite temperature records compare by Roz Pidcock, Carbon Brief, Feb 1, 2016
AuntSally @9 and BBHY @19. Yes, BBHY. Think about it.
The Earth's surface temperature is in an uptrend. Above the troposhere the stratosphere is in a downtrend. Interpolation would show a "Goldilocks Layer" somewhere in the troposhere with a level temperature plot.
As this article says, "The satellite data are best … if you want the data that show the least warming."