


 Arguments


The DENIAL101x temperature tool
Posted on 5 May 2015 by Kevin C
As part of DENIAL101x, we've released a new tool which enables anyone to check and debunk misinformation about the historical temperature record for themselves.
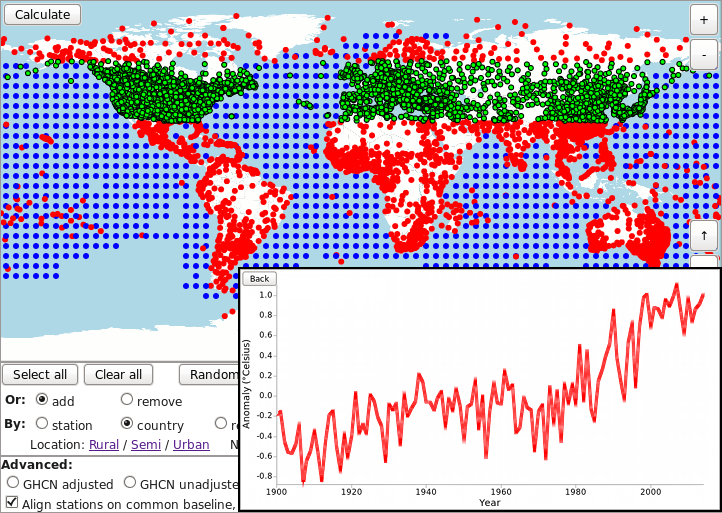
Try it for yourself here!
You can look at temperature records at any scale, from a local weather station to national and global records. You can investigate common myths, such as the impact of urban heat islands and adjustments to the data. And you can use simple statistical tests to examine the accuracy of the record for yourself.
Here's an introductory video on using the temperature tool:
There's more information in the course materials, for example explaining those two 'advanced' method buttons at the bottom of the tool. Turn those off and you can produce nonsense - but very interesting nonsense. Why? To find out more, it's not too late to sign up at DENIAL101x.


This is an awesome tool! Thanks so much, Kevin!
Wow! And thankyou.
The only thing that I would wish for relative to this would be to see a pre-industrial baseline and a way to show the 2C limit.
Can it clarify what the anomaly is on the vertical axis? (i.e., 'difference to 1900-1980 avg' or whatever is actually is?)
Difference vs 61-90 average (like HadCRUT4).
I though I'd been so careful to eliminate the jargon term 'Anomaly' from all my graph axes, but there it is again!
Absolutely, positively, completely blown away. Most useful tool since the Robogrip.
A very nice addition! There are a lot of talented people who contribute to this site!
@ Kevin C why do you say " to eliminate the jargon term 'Anomaly' from all my graph axes," ? I would have thought the 'anomaly' term is important.
Brilliant tool.
As this is your first post, Skeptical Science respectfully reminds you to please follow our comments policy. Thank You!
It looks fantastic. This is my first time logged in to the website. I am using a Samsung galaxy to play with it and do not seem to get enough resolution between the spots to identify the weather stations where I live.