


 Arguments


Climate scientists dub this year’s El Niño “a real enigma”
Posted on 15 August 2014 by Guest Author
This is a re-post from Roz Pidcock at Carbon Brief
Last month, forecasters were predicting with 90 per cent certainty we'd see an El Niño by the end of the year, driving severe weather patterns worldwide. But with little sign so far of the ocean and atmospheric changes scientists expected, those odds have dropped off quite a bit.
We'll probably still see an El Niño before the year's out but it's unlikely to be a strong one, scientists are saying.
What is an El Niño?
Every five years or so, a change in the winds causes a shift to warmer than normal ocean temperatures in the equatorial Pacific Ocean - a phenomena known as El Niño.
Together, El Niño and its cooler counterpart La Niña are known as the El Niño Southern Oscillation (ENSO). Between them, they're responsible for most of the fluctuations in global weather we see from one year to the next.
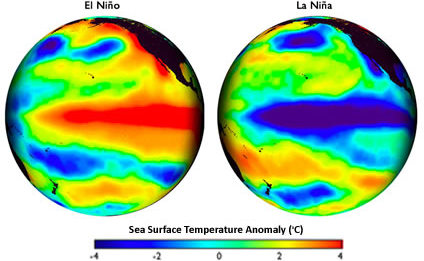
Sea surface temperature during El Niño (left) and La Niña (right). Red and blue show warmer and cooler temperatures than the long term average. [Credit: Steve Albers, NOAA]
What happens when an El Niño hits?
Each time a switch occurs, changes in the ocean and atmosphere above it affect global temperature and rainfall patterns worldwide.
In El Niño years, Indonesia and Australia see below average rainfall, while South America and parts of the United States see more than usual.
The ocean releases heat into the atmosphere in El Niño years. Added to the warming we're seeing from greenhouse gases, this puts El Niño years among the warmest on record.
You can see this in the graph below showing global temperature between 1950 and 2013. Five of the top ten warmest years are El Niño years (orange bars).
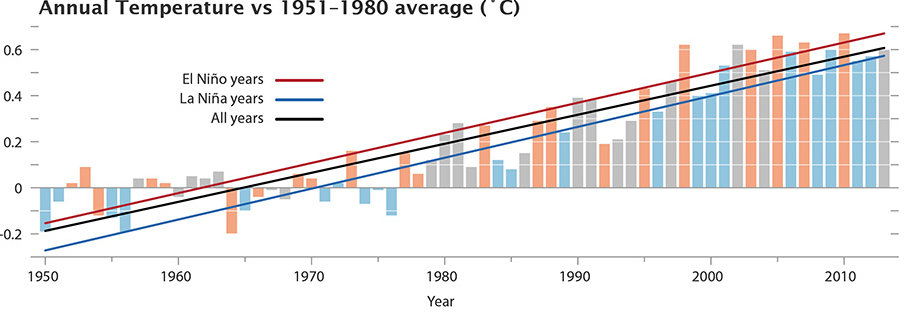 Global temperature anomalies for 1950-2013 showing the phase of the El Niño-La Niña cycle (Credit: NASA/GSFC/Earth Observatory, NASA/GISS)
When will the next El Niño be?
Since the last El Niño in 2009/2010 the Pacific has been in either a neutral or La Niña phase. Most of 2012 and all of 2013 saw neutral conditions - and we're still in neutral phase now.
Earlier this year, the ocean looked to be primed for an El Niño, with above average temperatures in the eastern Pacific lasting throughout March and May.
But the atmosphere has "largely failed to respond" to sea surface temperatures and scientists' confidence in an El Nino developing in 2014 has eased a bit, says the Australian Bureau of Meteorology, whose climate models now put the chances of this happening at about 50 per cent.
The US National Oceanic and Atmospheric Administration (NOAA) suggests higher odds. Its latest predictions suggest a 70 per cent chance of an El Niño in Summer and 80 per cent during autumn or winter.
You can see in the graph below how climate models forecast sea surface temperatures in the Pacific will evolve in the next few months. Each colour is a different model.
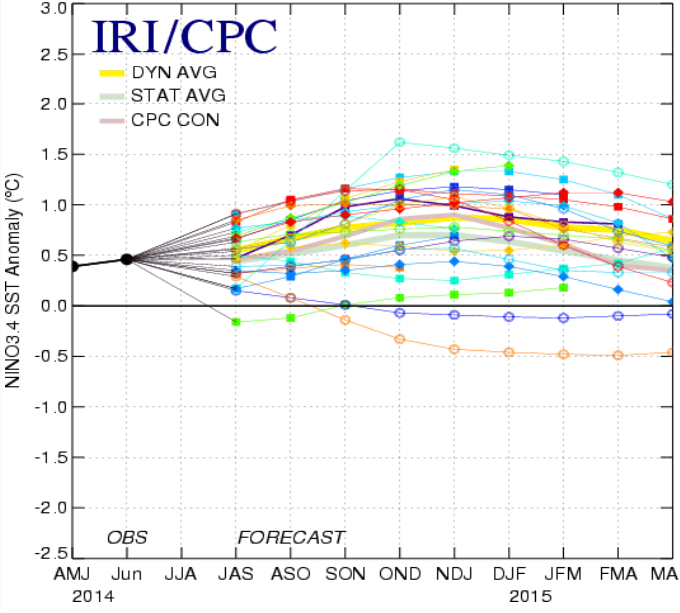 Forecasts for sea surface temperature anomaly, as of 15th July 2014. Source: the International Research Institute (IRI) for Climate and Society at Columbia University.
How strong will the next El Niño be?
Back in April, professor Mat Collins from Exeter University told us that although conditions in the Pacific at the time looked similar to those before the large 1997/8 event, the ocean can change very quickly.
In other words, the signs were there but it was still too soon to say if the next event would be a strong, moderate or weak one. We asked Collins what he thinks now, and he said:
"I think this year's El Nino has been a real enigma. Many of us were thinking that it would be a big event this year, but now the signal is pretty weak and a strong event seems quite unlikely."
NOAA is now predicting a "weak-to-moderate" event and the Australian Bureau of Meteorology has eased its projections for the next El Niño's potential strength too, saying:
"If an El Niño were to occur, it is increasingly unlikely to be a strong event."
Will we see the hottest year on record?
Back in April, scientists suggested the next El Niño, on top of continuing greenhouse gas warming, could see surface temperatures topping the charts for the warmest year on record.
At the time, Collins told us:
"[T]he influence of El Niño on global mean temperatures is well known so my guess is the chance of seeing a record warm year is pretty high, especially if it is a large event".
But any temperature-boosting potential of the next El Niño looks fairly limited at the moment, Collins says:
"If you compare the situation now with the state of the Pacific in summer 1997 (i.e. before the big 1997/98 event), it is very different … [Right now] we just have some weak and disorganised sea surface temperature anomalies, pretty average trade winds and even the subsurface ocean doesn't have much of a signal."
We could still see chart-topping temperatures even without an El Niño. 2013 and 2002 were the 4th and 6th hottest years on record, respectively, despite ENSO-neutral conditions.
So far, 2014 equals 2002 as the 3rd warmest January to June on record, with global surface temperatures 0.67 degrees Celsius above the 20th century average. The map below shows regions with June temperatures four degrees higher than the 1981-2010 average.
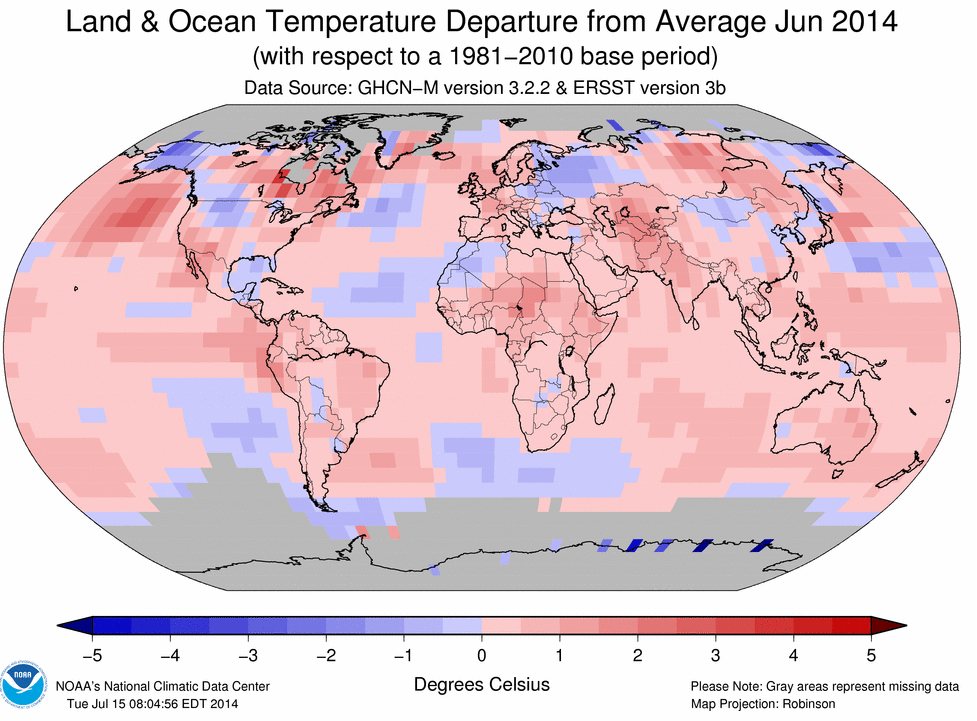
Land and surface temperatures in June 2014, compared to the 1981-2010 average. Source: NOAA
Are El Niños getting stronger?
Recent research suggests ENSO events have been unusually strong in the later part of 20th century compared to the past 7,000 years - 42 per cent stronger, on average.
Professor Kim Cobb from Georgia Tech university told us recently how human-caused warming could increase the strength of ENSO:
"[C]limate change is much more than 'global warming' […]. Because ENSO involves feedbacks between the wind strength, ocean temperature, and circulation, a change in any related climate parameter would arguably have some effect on ENSO strength".
A new paper in Nature Climate Change suggests El Niños and La Niñas are likely to intensify with rising greenhouse gases, peaking at 13 per cent stronger than the late 20th century average by about 2040.
But after 2040, the authors expect to see ENSO events weaken again as different rates of warming across the Pacific Ocean bring about a change in the winds, the paper explains.
Given the destructive consequences of El Niño and La Niña, it's not hard to see why research into the potential links with greenhouse gas warming is so important.
As for what this year's El Niño has in store, the next official update from the Australian government is expected on 12th August.


Just a slight correctin, NOAA has chance of El Nino down to 65%
http://www.cpc.ncep.noaa.gov/products/analysis_monitoring/lanina/enso_evolution-status-fcsts-web.pdf
[JH] Link activated.
A recent study reports that the east to west tradewinds at the equator off South America have been much stronger in the past decade than ever since record keeping began. Another study reports that the warming on the Atlantic is creating high pressure there in the upper troposphere some of which is spilling down on the west coast of South America magnifying the tradewinds (MacGregor et al. Nature Climate Change 8/7/14), which may be why they have been so strong.
The El Niño requires a relaxing or reversal of those tradewinds but the winds have not been cooperating from what I have read. Might not this is the reason that the El Niño is not occurring? I think that MacGregor states that the effect which he documented will at least temporarily decrease the frequency of El Niño years and had been and will continue push a little more of the global warming heat into the oceans for an uncertain amount of time.
The trade winds have weaken in the last couple of weeks, and the SOI has been staying negative. Maybe a weak El Nino has begun. The ocean warming is becoming so consistent perhaps the El Nino pattern cannot organise itself.
http://www.bom.gov.au/climate/enso/#tabs=Overview
[JH] Link activated.
So, should we now refer to the phenomenon as an el Nigma?
(groan)
It is clear that the intricacy of the global system related to the ENSO is worthy of the pursuit of better understanding. Being able to better predict its formation will benefit the many actvities, including plans for potential emergency response, affected by the global influence of this condition.
However, it is possible to clearly show that the expected warming of our planet by the increased CO2 has been occurring and is evident in not only the deep ocean temperatures, but in the global average surface temperature data. Though this El Nino has not yet fully developed the way some models predicted, the 12 month global average surface temperature is currently warmer that the highest 12 month value during the very strong 1997/98 El Nino.
In the NASA GISTemp data set, and probably in the other data sets, the recent averages of 12 months have been warmer than the warmest 12 month average during the 1997/98 event. The maximum 12 month averages during that event were 0.61 C for periods ending in August and September of 1998, after the tropical Pacific had cooled - as measured by NOAA as the ONI. The 12 month averages ending in May, June and July of this year are 0.65 C, and the tropical Pacific has not yet warmed to El Nino levels.
This is another clear indication that the warming so many want to believe has not been continuing has actually continued. And there is no need to wait for the 'full formation of an El Nino' or for the end of the year global surface 12 month average to point out the clear facts of the matter.