Climate Science Glossary

Term Lookup

Enter a term in the search box to find its definition.

Settings

Use the controls in the far right panel to increase or decrease the number of terms automatically displayed (or to completely turn that feature off).

Term Lookup

Settings


All IPCC definitions taken from Climate Change 2007: The Physical Science Basis. Working Group I Contribution to the Fourth Assessment Report of the Intergovernmental Panel on Climate Change, Annex I, Glossary, pp. 941-954. Cambridge University Press.

Home Arguments Software Resources Comments The Consensus Project Translations About Support

Twitter Facebook YouTube Mastodon MeWe

RSS Posts RSS Comments Email Subscribe


Climate's changed before
It's the sun
It's not bad
There is no consensus
It's cooling
Models are unreliable
Temp record is unreliable
Animals and plants can adapt
It hasn't warmed since 1998
Antarctica is gaining ice
View All Arguments...


Username
Password
New? Register here
Forgot your password?

Latest Posts

Archives

UAH Misrepresentation Anniversary, Part 1 - Overconfidence

Posted on 27 December 2011 by dana1981, Albatross

Christy Crocks November 2011 marked the 33rd year of  atmospheric temperature measurements from satellite instruments.  Roy Spencer and John Christy at the University of Alabama (UAH) were effectively the originators of the satellite temperature record. Unfortunately, they marked this anniversary with a press release propagating much of the same misinformation about global climate change as they have throughout their careers at UAH. Spencer and Christy not only made a number of misleading statements in the UAH press release and in subsequent blog posts about it, they also ignored a body of scientific literature that contradicts their views on global climate change.

Downplaying Climate Change Risks

The press release starts off with a rather subjective and unsupported claim by John Christy:

"While 0.45 degrees C of warming is noticeable in climate terms, it isn’t obvious that it represents an impending disaster"

This statement is true, but misleading.  By itself, 0.45°C warming of the lower atmosphere does not obviously represent an impending disaster.  Add the fact that this warming occurred over a period of just 33 years, and the data becomes rather more alarming.  Add the fact that this warming was predominantly caused by greenhouse gas emissions (more on this later) which continue to accelerate with no end in sight, and it becomes more alarming yet.

What Christy has done here is take a number out of context and present it in a way which makes it sound benign.  We're not worried about the ~0.5°C over the past 30 years.  We're worried about the 4°C to come over the next century if we continue on our current emissions path (Figure 1).  And that undoubtedly would represent an impending disaster.

A2 vs. B1 scenario projected warming

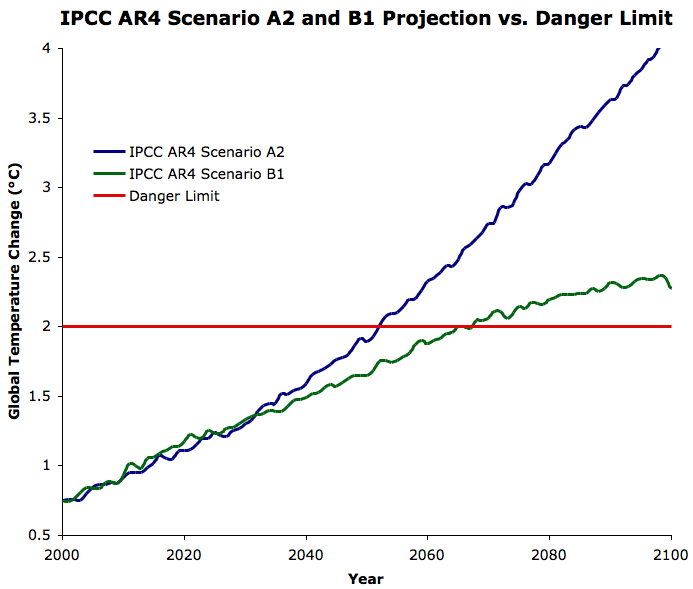
Figure 1: Average global surface warming (compared to pre-industrial temperature) projected under IPCC emissions scenarios A2 (business as usual; blue) and B1 (significant steps to reduce greenhouse gas emissions; green), compared to the 2°C 'danger limit' (red).

Modeled vs. Observed Lower Atmosphere Warming

Christy proceeds to make a similar statement to one we've seen before, that the temperature of the lower troposphere (TLT) is not warming as fast as climate models predict it should:

"The climate models produce some aspects of the weather reasonably well, but they have yet to demonstrate an ability to confidently predict climate change in upper air temperatures."

It's important to note that the climate model expectation of a faster-warming lower troposphere is based on fundamental atmospheric physics, as described by RealClimate:

"the increase in water vapour as surface air temperature rises causes a change in the moist-adiabatic lapse rate (the decrease of temperature with height) such that the surface to mid-tropospheric gradient decreases with increasing temperature (i.e. it warms faster aloft). This is something seen in many observations and over many timescales, and is not something unique to climate models."

Christy elaborated his statement above in a follow-up post on Spencer's blog, making several false assertions in the process, such as:

"bulk atmospheric temperatures in the climate system are warming at only 1/2 to 1/4 the rate of the IPCC AR4 model trends"

This statement is simply untrue, as demonstrated by Santer et al. (2011) in response to a similar statement made by Christy in testimony to US Congress:

"for the range of TLT trends considered here, there is no trend length at which the multi-model average trend, bf, is more than 1.73 times larger than bo, the average observed TLT trend"

Santer et al. found that the model-expected trend was on average 1.55 times larger than the UAH trend (the discrepancy was even smaller when using Remote Sensing Systems [RSS] data). Thus even using the UAH data which shows the least warming (more on this below), atmospheric temperatures are warming at 65% the rate of the model trends, which is well outisde Christy's claim of 25 to 50%.

Christy's exaggeration aside, it is true that according to UAH and RSS, the lower troposphere is not warming as fast as we expect from models and atmospheric physics.  Globally, climate models predict that the lower atmosphere should warm approximately 1.2 times faster than the surface.  According to UAH data, the surface is actually warming a bit faster than the lower atmosphere.  There are three possible explanations for this discrepancy:

1) Our understanding of atmospheric physics is wrong, and the lower atmosphere should not warm faster than the surface.

2) The models and physics are right, but the surface temperature data are biased high.

3) The models and physics are right, but the satellite temperature data are biased low.

At this juncture, we don't know which of these explanations is accurate.  In the quote above, Christy is assuming that #1 is the correct explanation, and other climate "skeptics" have previously assumed that #2 is correct.  However, the most likely explanation may very well be #3, for reasons described by Andrew Dessler in an interview with Andrew Freedman:

"As far as the data go, I don’t really trust the satellite data. While satellites clearly have some advantages over the surface thermometer record, such as better sampling, measuring temperature from a satellite is actually an incredibly difficult problem. That’s why, every few years, another big problem in the UAH temperature calculation is discovered. And, when these problems are fixed, the trend always goes up.  It’s also worth noting that there have not been any similar revisions to the surface temperature data, despite the fact that people have looked at it very, very carefully."

Dessler is referring to the complex nature of constructing a global temperature series from the satellite observations. The microwave sounding units (MSU) aboard the satellites don't actually measure air temperature, but rather the intensity of microwave radiation given off by oxygen molecules in the atmosphere, and the intensity of this radiation is a proxy for air temperature.  Given that the radiation reaches the satellite sensors having travelled through a warming lower atmosphere and cooling stratosphere, that bias exists between the various sensors, issues with orbital decay, and a host of other obstacles, there's a lot of careful and painstaking analysis required, and much that can go wrong.  

This is obvious in the continual corrections made to the UAH record, described by Dessler above and illustrated in Figure 2 (hat-tip to Eli Rabbett).  To be fair, Dessler was incorrect to say that the trend always goes up after adjustments are made to UAH.

UAH corrections 

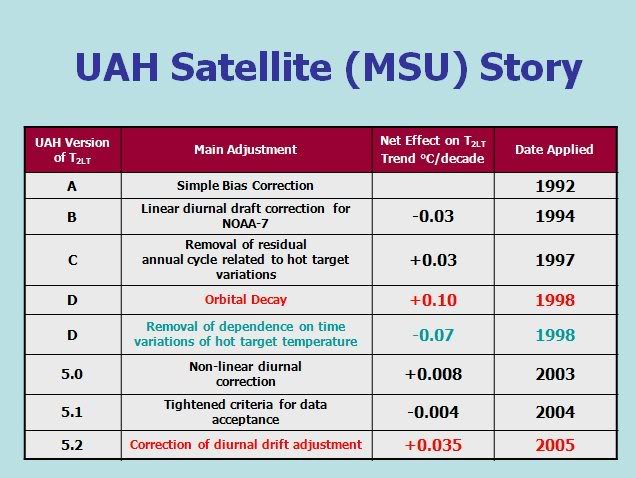
Figure 2: Major corrections to the UAH temperature trend over the years.

Major UAH Adjustments

As shown in Figure 2, there have been a number of major adjustments to the UAH temperature record over the years.  There is of course nothing wrong with adjusting a temperature record to remove biases - science progresses, after all.  There is, however, a problem when the authors of that record continually insist that there are no problems with the record, and overstating the accuracy and robustness of their data, as Spencer and Christy have a history of doing (as documented by Albatross).  Further, in his follow-up post on Spencer's blog, Christy made a very incorrect statement about the causes behind the UAH corrections:

"The largest effect one sees [in the UAH corrections] is due to the spike in warming from the super El Nino of 1998 that tilted the trend to be much more positive after that date."

Figure 2 clearly shows this statement is false.  The two adjustments in red (which correct for errors identified by scientists outside of UAH) alone account for 0.135 of the 0.138°C per decade UAH TLT trend - 98%!  As Tom Curtis notes, the 1998 El Niño only accounts for approximately 0.008°C per decade (5.8%).  Overall, the adjustments made to UAH (which resulted in both trend increases and decreases) account for half of the current UAH trend (0.069 of 0.138°C per decade).

Other Lower Troposphere Temperature Records

Additionally, as we've previously discussed, UAH is not the only group analyzing the satellite temperature data (although you wouldn't know it from Spencer and Christy's comments).  Other groups estimate that the lower atmosphere warming is larger than in UAH (Table 1). 

Table 1: Lower (TLT) and mid-troposphere temperature (TMT) estimates from various groups

Group

TMT Trend
(°C/decade)

TLT Trend
(°C/decade)
UAH 0.05 0.14
RSS 0.09 0.14
Fu et al. 0.13 --
V & G -- 0.20
Zou et al. 0.13 --
RATPAC -- 0.18

Note that the RATPAC radiosonde (weather balloon) data are in close agreement with the higher tropospheric temperature estimates, as are the HadAT2 radiosonde data (Figure 3).

HadAT2

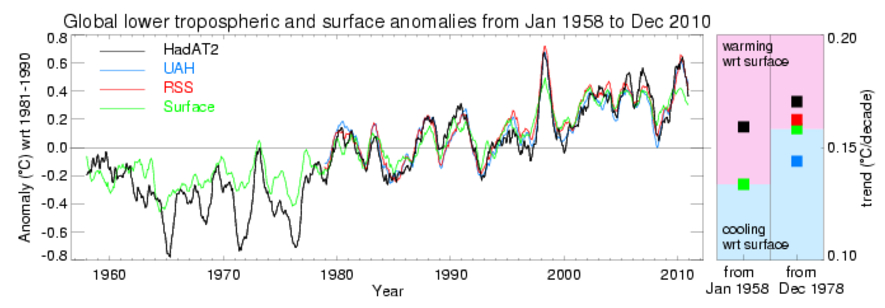
Figure 3: HadAT2 radiosonde data (black) vs. UAH (blue) and RSS (red) lower troposphere temperatures, and HadCRUT3 surface temperatures (green)

This provides yet another reason why it is unwise to assume that UAH is correct and the models/physics or surface temperature data are wrong.  It is the UAH data that is the outlier.

In Part 2 we'll examine several other misrepresentations and false claims in the UAH anniversary press release.  There were simply too many to cover in one post.

0 0

Printable Version  |  Link to this page

Comments

Comments 1 to 20:

  1. Nice article. It’s helpful to continue highlighting these misrepresentations since Spencer and particular Christy seem determined to engage in attempts to cloud our understanding of tropospheric temperature measurements and how these relate to expectations from physical understanding of the climate system in a warming world. Three points come to mind: ONE: It’s worth pointing out that while Spencer and Christy engage in misrepresentation, scientists that follow the more traditional (!) pursuit of real world knowledge continue to set the record straight. Recent examples include Santer et al (2011) and Thorne et al (2011). The work of Carl Mears and Frank Wentz of Remote Sensing Systems has been instrumental in making Microwave Sounding Unit (MSU) properly useful as a means of measuring tropospheric temperature (and encouraging Spencer and Christy to make appropriate analyses of UAH data). Mears and Wentz's papers are particularly good (recent example below). If ever anyone wishes to come to an informed opinion of the progression of the science on tropospheric temperature analysis the subject is very well documented in the scientific literature. TWO: Focussing on the science, it's also worth pointing out that the agreement between current radiosonde reanalyses and RSS (and UAH) TLT tropospheric measures may be better than indicated in your Table 1. This follows from the fact that radiosonde measurements don’t cover the entire globe. If the satellite TLT data is filtered to exclude areas of spatial coverage omitted from the radiosonde analysis then radiosonde (HadAT) and MSU TLT are quite similar [see Mears et al (2011), Figure 12): HadAT: trend = 0.188 K/decade Sampled RSS: trend = 0.185 K/decade Sampled UAH: trend = 0.174 K/decade That's not to say that there aren't more errors/adjustments to be found/made in these analyses! THREE: Returning towards somewhat snarky historical description, it’s also worth remarking on the relationship between the Spencer/Christy UAH product and radiosonde measures of tropospheric temperature. During the long years during which Spencer/Christy were making erroneous MSU analyses, their major justification for assertions of “accuracy” was an apparent agreement between UAH analyses and radiosonde measures [*]. Interestingly, the (erroneous; see below) radiosonde measures were actually used by Christy/Spencer as part of their methodology for determining MSU temperature trends (more specifically, the choice of sets of satellite data overlaps was guided partly by reference to radiosonde data), and so the MSU and radiosonde analyses weren't as "independent" as one might suppose. Once errors in the analysis of radiosonde data was highlighted [e.g. Sherwood et al (2005)], and modern reanalyses products (like RATPAC and HadAT mentioned in dana’s top article) produced trends similar to those expected from physics, Spencer and Christy were (and are) doubly negligent in insinuating a fundamental discrepancy between surface and atmospheric temperature measures. [*]e.g. Christy, Spencer and WD Braswell (1997) “How accurate are satellite “thermometers”? Nature 389, 342. “We believe that lower-tropospheric temperatures measured directly by satellites have excellent long-term accuracy, as seen by comparisons with independent atmospheric measurements from weather balloons.”
    0 0
  2. According to Eli Rabett, Spencer and Christy have yet to make public the software they use to convert the data collected by the NASA satellites into their estimates of the temperatures of the lower troposphere (TLT) and of the mid troposphere (TMT). As Rabett suggests in “MacIntyre and Mosher at the door, hand over the rent.” posted Dec 21, 2011 on his blog, Rabett Run, someone in the US ought to file an FOIA request for the software so it could be scrutinized by experts with microwave and programming experience.
    0 0
  3. Chris @1, Excellent points. Christy and Spencer have repeatedly shown confirmation bias by using the excuse that their product did not have a cool bias because it compared well with the weather balloon data, even though the literature at that time showed that the global balloon data had problems. The Mears et al. (2011) paper is good, of course. Readers can find the PDF here. Mears et al. also note that there are still outstanding issues with the satellite temperature estimates: "This further confirms our finding for our data set that unambiguously resolving the diurnal drift effect correction and its impacts is likely to be a key determinant in reducing the uncertainty in long term tropospheric temperature changes from MSU/AMSU records." And, "An inescapable conclusion from this is that the methodological choices that we and others have made have lead to a substantial and significant impact upon the resulting estimates. This reinforces the importance of creating multiple independent estimates from the raw data which is known both to contain nonclimatic influences and lack met[eo]rological traceability if we are to avoid the possibility of reaching false conclusions Spencer and Christy (and their apologists) should heed their colleagues' sage advice...I doubt they will though. And yes, please free the code Drs. Spencer and Christy. Funny how "skeptic" scientists like to demand their colleagues' code, yet fail to do so themselves.
    0 0
  4. John Hartz@2 I think your “McIntyre and Mosher at the door, hand over the rent.” link is wrong. It leads to an article about wildfires in Canada. Is this the link you intended? http://rabett.blogspot.com/2011/12/mcintyre-and-mosher-at-door-hand-over.html (I'm happy for this post to be deleted after the link is fixed)
    0 0
    Moderator Response: [JH] Link fixed. Thank you.
  5. I would not completely rule out the possibility that the extra heat is 'going down' slightly faster than most models predict - after all we find like 90% of the Earth heat anomaly inside the oceans, and as such a product like UAH/RSS that is from start only for the atmosphere (excluding actual land and ocean and maybe with a certain bias introduced by the extensive processing needed to extract the temperature from behind the higher-layers signal) could easily be the wrong global estimate of warming :)
    0 0
  6. The charge made by this article is that Christy and Spencer are 'biased' - that is that they deliberately read the UAH temperature record 'low' thereby showing bad faith as scientists. There might be some truth in that claim but to make that case there needs to be some watertight evidence on the part of the accuser. For example RSS is (I believe) analysing the same raw satellite data as UAH then the trends from Table 1 for RSS are midway between UAH and the others (Fu and Zou) for the TMT trend and the same as UAH for the TLT trend. Would it be reasonable to ask if RSS is a reliable and unbiased analysis which has no Christy or Spencer influence? If we look at the RATPAC trend of 0.18 verses RSS of 0.14C/dec - is this a significant difference outside normal error bars which is even worthy of comment? And the comment quoted by Andrew Dessler: "As far as the data go, I don’t really trust the satellite data. While satellites clearly have some advantages over the surface thermometer record, such as better sampling, measuring temperature from a satellite is actually an incredibly difficult problem. That’s why, every few years, another big problem in the UAH temperature calculation is discovered. And, when these problems are fixed, the trend always goes up" Does this also apply to RSS? Surely error or bias in the UAH record does not necessarily apply to RSS as well. Or are all the satellite reconstructions now to be suspect? And what do we make of this statement: "To be fair, Dessler was incorrect to say that the trend always goes up after adjustments are made to UAH". So is Dessler showing his own bias by making an incorrect statement? On balance I think that Christy and Spencer do have a case to answer regarding honest difference of opinion, limitations of the technology and deliberate bias, but a case is not made by airing similar bias on the other side of the argument.
    0 0
    Response:

    [dana1981] No, you misunderstand the article.  The term "bias" has multiple meanings.  We aren't saying Spencer and Christy are biased (in the article), we're saying the evidence points to the UAH record being biased low (meaning cooler than reality).  Yes, the same applies to RSS, to a lesser degree.  That's simply where the scientific evidence seems to point.

  7. victull @6, in no part of the article are Spencer and Christy accused of bias. Rather, evidence is given that the UAH temperature record results in a bias showing a cooler trend than that which probably exists. The reason for that bias may be flaws in the instrumentation, flaws in Spencer and Christy's particular methods, or even an unknown or unaccounted for physical effect which biases the temperature measurements. In stating that record of bias, evidence has come to light that does suggest a particular bias on behalf of Spencer and Christy, although the main post draws no conclusion on that point, instead concluding that:
    "Given that the radiation reaches the satellite sensors having travelled through a warming lower atmosphere and cooling stratosphere, that bias exists between the various sensors, issues with orbital decay, and a host of other obstacles, there's a lot of careful and painstaking analysis required, and much that can go wrong."
    Despite the reticence of the main post, it is difficult to not conclude from: 1) The overall negative pattern of the corrections to the record made by Spencer and Christy (excluding errors discovered by others); 2) The repeated and confident statements that the UAH record is wrong, and that therefore the surface record is in error; and 3) The claims made by Spencer and Christy and examined in the second article in this series, that Spencer and Christy are in fact personally biased in favour of little warming, and that bias has effected their work. There is a vast difference, however, between that conclusion and the conclusion "...that they deliberately read the UAH temperature record 'low' thereby showing bad faith as scientists", ie, that Spencer and Christy have acted fraudulently, which you ascribe to the article. There is no claim of personal bias in the mainposts, let alone a claim of fraud. In contrast, Spencer has said:
    "In my opinion, the supposed “fingerprint” evidence of human-caused warming continues to be one of the great pseudo-scientific frauds of the global warming debate....Many papers indeed have claimed to find a human “fingerprint”, but upon close examination the evidence is simply consistent with human caused warming — while conveniently neglecting to point out that the evidence would also be consistent with naturally caused warming."
    That is a deliberate accusation of scientific fraud, and of pseudo-science against his colleagues for which Spencer is unable to provide evidence. Further, it is an accusation he has supported with plainly false statements. Given your stated concern that accusations of fraud be well evidenced, it is stunning that you are wasting your time here where no such accusation has been made, rather than defending the reputation of scientists at WUWT, or indeed at Spencer's (or Roger Pielke Snr's blog) where such accusations are common. Finally, as I understand it, the "misrepresentations" referred to in the title of the series refer to the many blatantly false or misleading statements that Spencer and Christy made in their press statement and subsequent commentary. It is not a claim that their scientific work is a misrepresentation. Perhaps Dana could confirm this.
    0 0
  8. Tom @7 - correct, the 'misrepresentations' refer to the comments made in the press release and blog post. And it's a good point that Spencer et al. are the ones accusing others of frauds and the like.
    0 0
  9. tom @ dana It must be my legal training or Queen's english but when I read the words 'false' and 'misleading' then intent is involved. Innocent mistakes made in good faith are 'errors'. All three terms are used in the article. Neither of you has addressed the issue of what Dressler said about "I don't really trust the satellite data" and my point about RSS. Orbital decay and diurnal drift adjustments noted in red in Figure 2 were made by scientists outside of UAH. Were similar adjustments made to the RSS record? Presumably yes. I can't see any comment about whether or not Christy or Spencer accept these 'red' adjustments as correct. If they don't then it is understandable for them to defend their analysis and trends and come up with 'incorrect' statements. I would not defend either Christy or Spencer throwing about accusations of fraud against other unnamed scientists for a minute. They are clearly reckless in doing so. Finally, problems with orbital decay and other adjustments affect all satellites - those measuring sea level, gravity, TSI etc. Aren't we trusting these data as the best available is finding evidence of global warming?
    0 0
  10. victull wrote: "I can't see any comment about whether or not Christy or Spencer accept these 'red' adjustments as correct." You appear to be proceeding under the incorrect assumption that these adjustments were made from the outside. Think it through. These are adjustments to the UAH satellite temperature record... which is developed by people at UAH... namely Spencer and Christy. In short, if they hadn't agreed (eventually) with the errors identified by outside groups they presumably wouldn't have adjusted their results to correct those errors. Once you take their acceptance, and correction of, those errors into account it should then become clear that their statements about the trends and adjustments in their record seem not merely 'false' (which doesn't imply intent in my experience), but demonstrably contradictory of things they have previously acknowledged. I suppose we could assume that they 'forgot' or 'spoke without checking the numbers' and are thus still simply 'incorrect' rather than deliberately misleading... but then they should be acknowledging these additional, blatantly obvious, errors now that they've been pointed out. But they aren't.
    0 0
  11. victull, you're simply repeating the same logical error that you made in your post #6, even 'though you're misconstruing of the top article was clearly pointed out to you by Tom and dana. Perhaps that's your "legal training"! The words "false" and "misleading" are used three times and two times, respectively, in dana's top article. In each case these adjectives are used in sentences describing statements made in the UAH press release or by Christy on Spencer's blog. It is these that are "false"/"misleading" for the reasons that dana has spelled out. This could hardly be clearer. Dana's statements simply don't refer to the methodology used by Spencer and Christy in their analysis of MSU data in constructing the UAH tropospheric temperatures. CBDunkerson has answered your question about whether or not Spencer and Christy accept the corrections (especially involving orbital drift and diurnal correction). The answer is yes. re your question of whether RSS scientists incorporated these corrections. Firstly, since it was the RSS scientists (in 1998) that identified the cooling bias arising from orbital decay [*], it's obvious that they include this in their RSS analysis. The diurnal drift correction is an oddball. RSS didn't so much as incorporate this correction, as not incorporate a rather astonishing error into their analysis in the first place. So RSS didn't need to make this correction since the error was very much a UAH-specific problem [**]. [*] F. J. Wentz and M. Schabel (1998) Effects of orbital decay on satellite-derived lower-tropospheric temperature trends. Nature 394, 661-664. [**] e.g. As Wentzl (RSS) said in correspondence folowing the publication of the diurnal drift problem [***] , [see Science 310, 972-3 (2005)]: "Once we realized that the diurnal correction being used by Christy and Spencer for the lower troposphere had the opposite sign from their correction for the middle troposphere sign, we knew that something was amiss. Clearly, the lower troposphere does not warm at night and cool in the middle of the day. We question why Christy and Spencer adopted an obviously wrong diurnal correction in the first place. They first implemented it in 1998 in response to Wentz and Schabel (1), which found a previous error in their methodology: neglecting the effects of orbit decay." [***] C. A. Mears and F. J. Wentz (2005) The Effect of Diurnal Correction on Satellite-Derived Lower Tropospheric Temperature Science 1548-1551.
    0 0
    Moderator Response: [muon] fixed text
  12. victull @9, it must certainly be your legal training, for as a life time speaker of the Queen's English I can tell you that "false" means "not true", and not "deliberately false". Likewise "misleading" means "likely to mislead" and not "deliberately misleading". What is more, this is evidently the case, for we do not see the "deliberately" in "deliberately false" and "deliberately misleading" as redundant. The issue on Spencer and Chrity's acceptance of the red corrections is complicated. In both cases the errors in need of correction where found by other teams. In the first case, Wentz and Schabel (1998) found the error. They state in their abstract:
    "The 17-year lower-tropospheric temperature record derived from the satellite Microwave Sounding Unit (MSU) shows a global cooling trend, from 1979 to 1995, of -0.05 K per decade at an altitude of about 3.5 km. ... Here we identify an artificial cooling trend in the satellite-derived temperature series caused by previously neglected orbital-decay effects. We find a new, corrected estimate of +0.07 K per decade for the MSU-based temperature trend, which is in closer agreement with surface temperatures."
    (My emphasis) The correction found by Wentz and Schabel resulted in a 0.12 C/decade correction in the trend. Two years later Spencer and Christy corrected their record for the error, but their correction only compensated for a 0.1 C/decade artificial cooling trend. There is nothing untoward in that. The difference in the corrected trend between them and Wentz and Schabel may be quite legitimate, and certainly the two years for correction (one of which is required for the process of publication) is understandable given the complexity of the calculations involved. At the same time they implemented a -0.7 C/decade correction in the opposite direction for diurnal effects. Combined with the lower correction, this changes the original correction from a 0.12 C per decade correction to a 0.03 C/decade correction. The problem is that, as shown by Mears and Wentz (2005), the second adjustment by Spencer and Christy itself was in error, who report:
    "For most latitudes, the Christy et al. TLT correction is of opposite sign from our TLT correction and from the corrections applied by either group for the middle/upper troposphere."
    and:
    "Surface and near-surface effects will be even more dominant for TLT, whose vertical weighting function peaks several kilometers closer to the surface and has a surface contribution roughly double that of MSU2. Thus, we expect the TLT diurnal cycle and diurnal correction to be similar in shape to the MSU2 diurnal cycle, but with larger amplitude. This is consistent with the diurnal correction we calculate from the climate model and is inconsistent with the Christy et al. correction."
    We might think it takes a special talent to introduce an error consisting of a meticulously applied error in sign which is opposite in value for the same effect that you apply elsewhere and which contravenes basic physical understanding. Especially when introduced as a cooling correction which obviates a very large warming correction found necessary in your data so that you can report that:
    "The net global effect of these revisions (version D) is small, having little impact on the year-to-year anomalies."
    instead of having to report a single correction which changed your trend from negative to positive, and made it greater than the surface trend. However, that may be entirely coincidental. Mears and Wentz also report:
    "To estimate what portion of the trend difference between our respective results is caused by the difference in diurnal correction, we performed a set of numerical experiments, where we substituted the Christy et al. diurnal correction into our analysis, and/or where we fixed the values of the target factors to the values used by Christy et al., allowing us to mimic different parts of the Christy et al. merging procedure separately and in combination. The results of these experiments suggest that the difference in diurnal correction accounts for over 50% of the difference in trends for global averages and over 70% of the difference in trends for tropical averages."
    The reported difference in trend for the global average was 0.1 C/decade, so Mears and Wentz find the the correction needed to be at least 0.05 C/decade. Shortly after, Spencer and Christy implemented a correction of 0.035 C/decade. It should be noted that if the corrections actually found by other teams had been implemented, the UAH trend to date would be 0.173 C/decade or higher than the surface trend. The -0.035 C difference combined with the net -0.074 C/decade corrections discovered by Spencer and Christy show a definite tendency to corrections reducing the measured trend by Spencer and Christy.
    0 0
  13. victull: If Christy & Spencer's statements in press releases and blog posts are found to be false (that is, contradicted by the available evidence) or misleading (that is, liable to lead readers to incorrect conclusions - whether deliberately or inadvertently), there is nothing inappropriate in (a) describing their statements as such and (b) calling them out for it.
    0 0
  14. Chris & Tom Thanks for the detailed information. In summary, Spencer and Christy have made errors in the UAH analysis which they subsequently corrected but not as much as other scientists in the field identified (ie RSS analysing the same data). Spencer and Christy then distorted their results in statements which were inaccurate and tended to mislead. Well clearly Spencer and Christy are not babes in the woods and therefore some intent is evident. In rightly criticizing Spencer & Christy, I fail to see why Dessler's statement was used. Dessler cast doubt on the value of satellite atmospheric temperature measurements in general (including RSS) which I expect dana, Tom and Chris would not support.
    0 0
  15. Good stuff (but feel free to delete after seen) Minor suggestions: in the tables, can you get the decimal points to line up? That helps, visually. Alternatively, albeit at hint of unwarranted precision, make them all 3 decimals. Also, you might want to link to: http://tamino.wordpress.com/2011/12/06/the-real-global-warming-signal/
    0 0
  16. victull @14, I would support Dessler's claim. The simple fact is that measuring tropospheric temperatures by satellite is very complex. This is made more difficult because more recent instruments use a slightly different frequency than did earlier instruments, and hence weight different altitudes differently. In addition to complexities involved in correlating measurements from different instruments on different satellites, you must compensate for orbital drift, diurnal drift and changing altitude. You must do so over a great range of atmospheric conditions, with corrections over the tropics not necessarily appropriate in the sub-arctic due to different altitudes of the tropopause and humidity levels. On top of that you are relying on instruments that sample a significant proportion of the stratosphere (which has an opposite temperature trend to the troposphere) and which have different weights for low altitudes over ocean and over land due to the different reflectivity of land and water to microwaves. These difficulties all apply to the TMT channel which is based on a single instrument (in each satellite). The TLT temperature series is derived from the TMT channel by various ad hoc adjustments, based on either the difference between data from vertical and lateral views (UAH), on microwave radiation models (RSS). It is no wonder then, that the four teams measuring TMT (channel 2) trends obtain four different results. (Note, by my reading V&G measure the trend of Channel 2, ie, TMT; not TLT as shown in table 1 above. Further, Fu et al measure a hybrid channel of their own devising which does not strictly correspond to either TMT or TLT.) Nor is it any surprise that the two teams measuring TLT trends also come up with different results. This situation represents a stark contrast to the measurement of surface trends. The different methodological choices of the various measurements of surface trends are known,and can be easily compensated for. When that is done so that we have apples to apples comparisons, the resulting trends are almost identical, and well within error. Therefore we can be very confident that the surface trend is very close to that obtained by GIStemp. (Not HadCRU as it does not have global coverage.) With satellites, however, we know UAH is under estimating the trend with a high degree of confidence. However, we do not know that RSS is correct, or that it itself does not also underestimate the trend.
    0 0
  17. Tom Curtis Do you think this book on remote sensing is worth reading or is it not welcome hear. It's explains alot of interesting things regarding the electromagnetic processes and interactions http://www.iki.rssi.ru/asp/pub_sha1/pub_sha1.htm
    0 0
  18. jmorpuss @17, the book is a university level text book on remote sensing using microwaves that does not deal explicitly with temperature sensing directly. Specifically, the Microwave Sensing Unit and the Advanced Microwave Sensing Unit are not discussed even when missions with those instruments where discussed. The author is a member of the Russian Academy of Sciences, and the book appears to be well respected. Consequently it would be a very useful resource for anybody seeking detailed background knowledge to understand issues that effect detection of air temperatures using satellites, especially if they are familiar with calculus. (It would be heavy going if you are not.) Clearly, therefore, it is a relevant resource for the topic of the main post. What is not on topic here is your usual rambling expositions of your crackpot theory of global warming based on physics that you clearly do not understand.
    0 0
  19. victull, I agree very much with Tom's summary above. I also don't have a problem with Dessler's statement. As Tom says the measurement of tropospheric temperature trends using satellite MSU (or weather balloons) is difficult, and there are subjective choices to be made in merging satellite records, correcting for extraneous contributions to apparent temperature etc. It's perfectly acceptable to be skeptical of these measures. They are useful though. Largely (but not exclusively) through the efforts of the RSS team we can conclude that apparent tropospheric warming is so far not inconsistent with expectations from physical understanding of the earth response to radiative forcing. That's a very important conclusion, and unfortunately one that Christy/Spencer seem determined to misrepresent. In fact scientists generally love finding apparent incompatibilities between predicted and observational phenomena (in this case between apparent tropospheric temperatures and physics-based expectations); we know there's science to be done and discoveries to be made in resolving these. Most scientists use them productively to focus efforts that advance our knowledge/methodologies; very few use them as S/C to pursue non-scientific aims. This is apparent by looking at the published work of the UAH and RSS teams. The RSS work simply inspires confidence that bright minds are focussing on resolving the issues productively. That doesn't mean that the RSS data is necessarily "correct". But their analyses are supported by scientifically justifiable choices, with careful consideration of errors and so on. That hasn't happened with the UAH duo who have continued a 20-year assertion that their (ever-changing) analyses are correct and demonstrate a fundamental incompatibility with physical understanding. They have shown little interest in addressing the apparent inconsistencies which turn out to a very large part to be due to errors in the very analyses they have asserted to be "precise". As for Dessler, it would be interesting to know the context in which he said the statement you copied. (One of) Dessler's expertises is in analysis of tropospheric water vapour and how this responds to greenhouse forcing to provide climate feedbacks. We know that tropospheric water vapour has increased (itself an independent confirmation of a warming tropsophere), and while the water vapour feedback largely arises from changes in water vapour in the upper troposphere, Dessler's work would be made a whole lot easier if the vertical structure of tropospheric temperature, and its response to greenhouse forcing, was known more accurately. Then the relationship between absolute and relative humidity, and the strength of the water vapour feedback, etc., could be determined rather more accurately. So I expect Dessler's statement may be related to a frustration with the continuing uncertainty in these measures in that they directly impinge on his work. In Dessler's papers I've read that address water vapour feedbacks in response to surface warming he doesn't use satellite MSU temperature data...
    0 0
  20. chris @19:
    "That hasn't happened with the UAH duo who have continued a 20-year assertion that their (ever-changing) analyses are correct and demonstrate a fundamental incompatibility with physical understanding. They have shown little interest in addressing the apparent inconsistencies which turn out to a very large part to be due to errors in the very analyses they have asserted to be "precise"."
    The phrase, "often wrong, but never in doubt" comes to mind.
    0 0

You need to be logged in to post a comment. Login via the left margin or if you're new, register here.


The Consensus Project Website

THE ESCALATOR

(free to republish)


© Copyright 2024 John Cook
Home | Translations | About Us | Privacy | Contact Us