


 Arguments


Understanding Time of Observation Bias
Posted on 6 March 2015 by Guest Author
This is a guest post by Zeke Hausfather
Global temperatures are adjusted to account for the effects of station moves, instrument changes, time of observation (TOBs) changes, and other factors (referred to as inhomogenities) that cause localized non-climatic biases in the instrumental record.
While the impact of adjustments that correct for these biases are relatively small globally (and actually reduce the century-scale warming trend once oceans are included) there are certain regions where the impact of adjustments on temperature trends are large. The United States, in particular, has large adjustments to temperature data that have the effect of nearly doubling the warming trend since 1900. The U.S. is somewhat unusual in that most of its historical temperature records were collected by volunteers rather than civil service employees. This has the benefit of giving the U.S. many more records than most other parts of the world, but contributes to the fact that stations in the U.S. tend to have quite a few systemic inhomogenities.
There are two specific changes to the U.S. temperature observation network over the last century that have resulted in systemic cooling biases: time of observation changes at most of the stations from late afternoon to early morning, and a change in most of the instruments from liquid in glass thermometers to MMTS electronic instruments. Back in July I posted a general introduction to U.S. temperature adjustments that looked at the relative effect of each adjustment. Here I will focus in detail on the Time of Observation adjustment, which is responsible for the majority of the change in U.S. temperatures vis-à-vis raw data. In a future post I will address the pairwise homogenization algorithm, which attempts to correct for factors like the MMTS transition and the impact of urbanization on temperature trends.
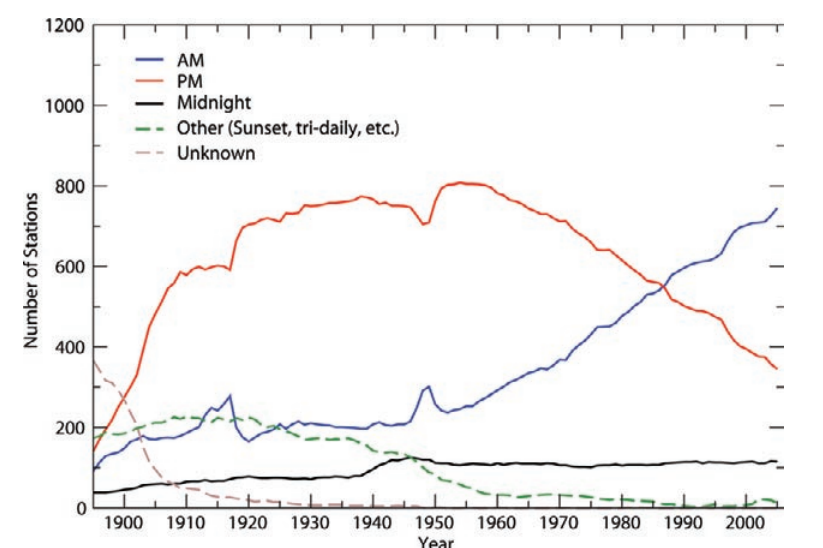
Figure 1: Recorded time of observation for USHCN stations, from Menne et al 2009.
Until the late 1950s the majority of stations in the U.S. record recorded temperatures in the late afternoon, generally between 5 and 7 PM. However, volunteer temperature observers were also asked to take precipitation measurements from rain gauges, and starting around 1960 the U.S. Weather Service requested that observers start taking their measurements in the morning (between 7 and 9 AM), as that would minimize the amount of evaporation from rain gauges and result in more accurate precipitation measurements. Between 1960 and today, the majority of stations switched from a late afternoon to an early morning observation time, resulting a systemic change (and resulting bias) in temperature observations.
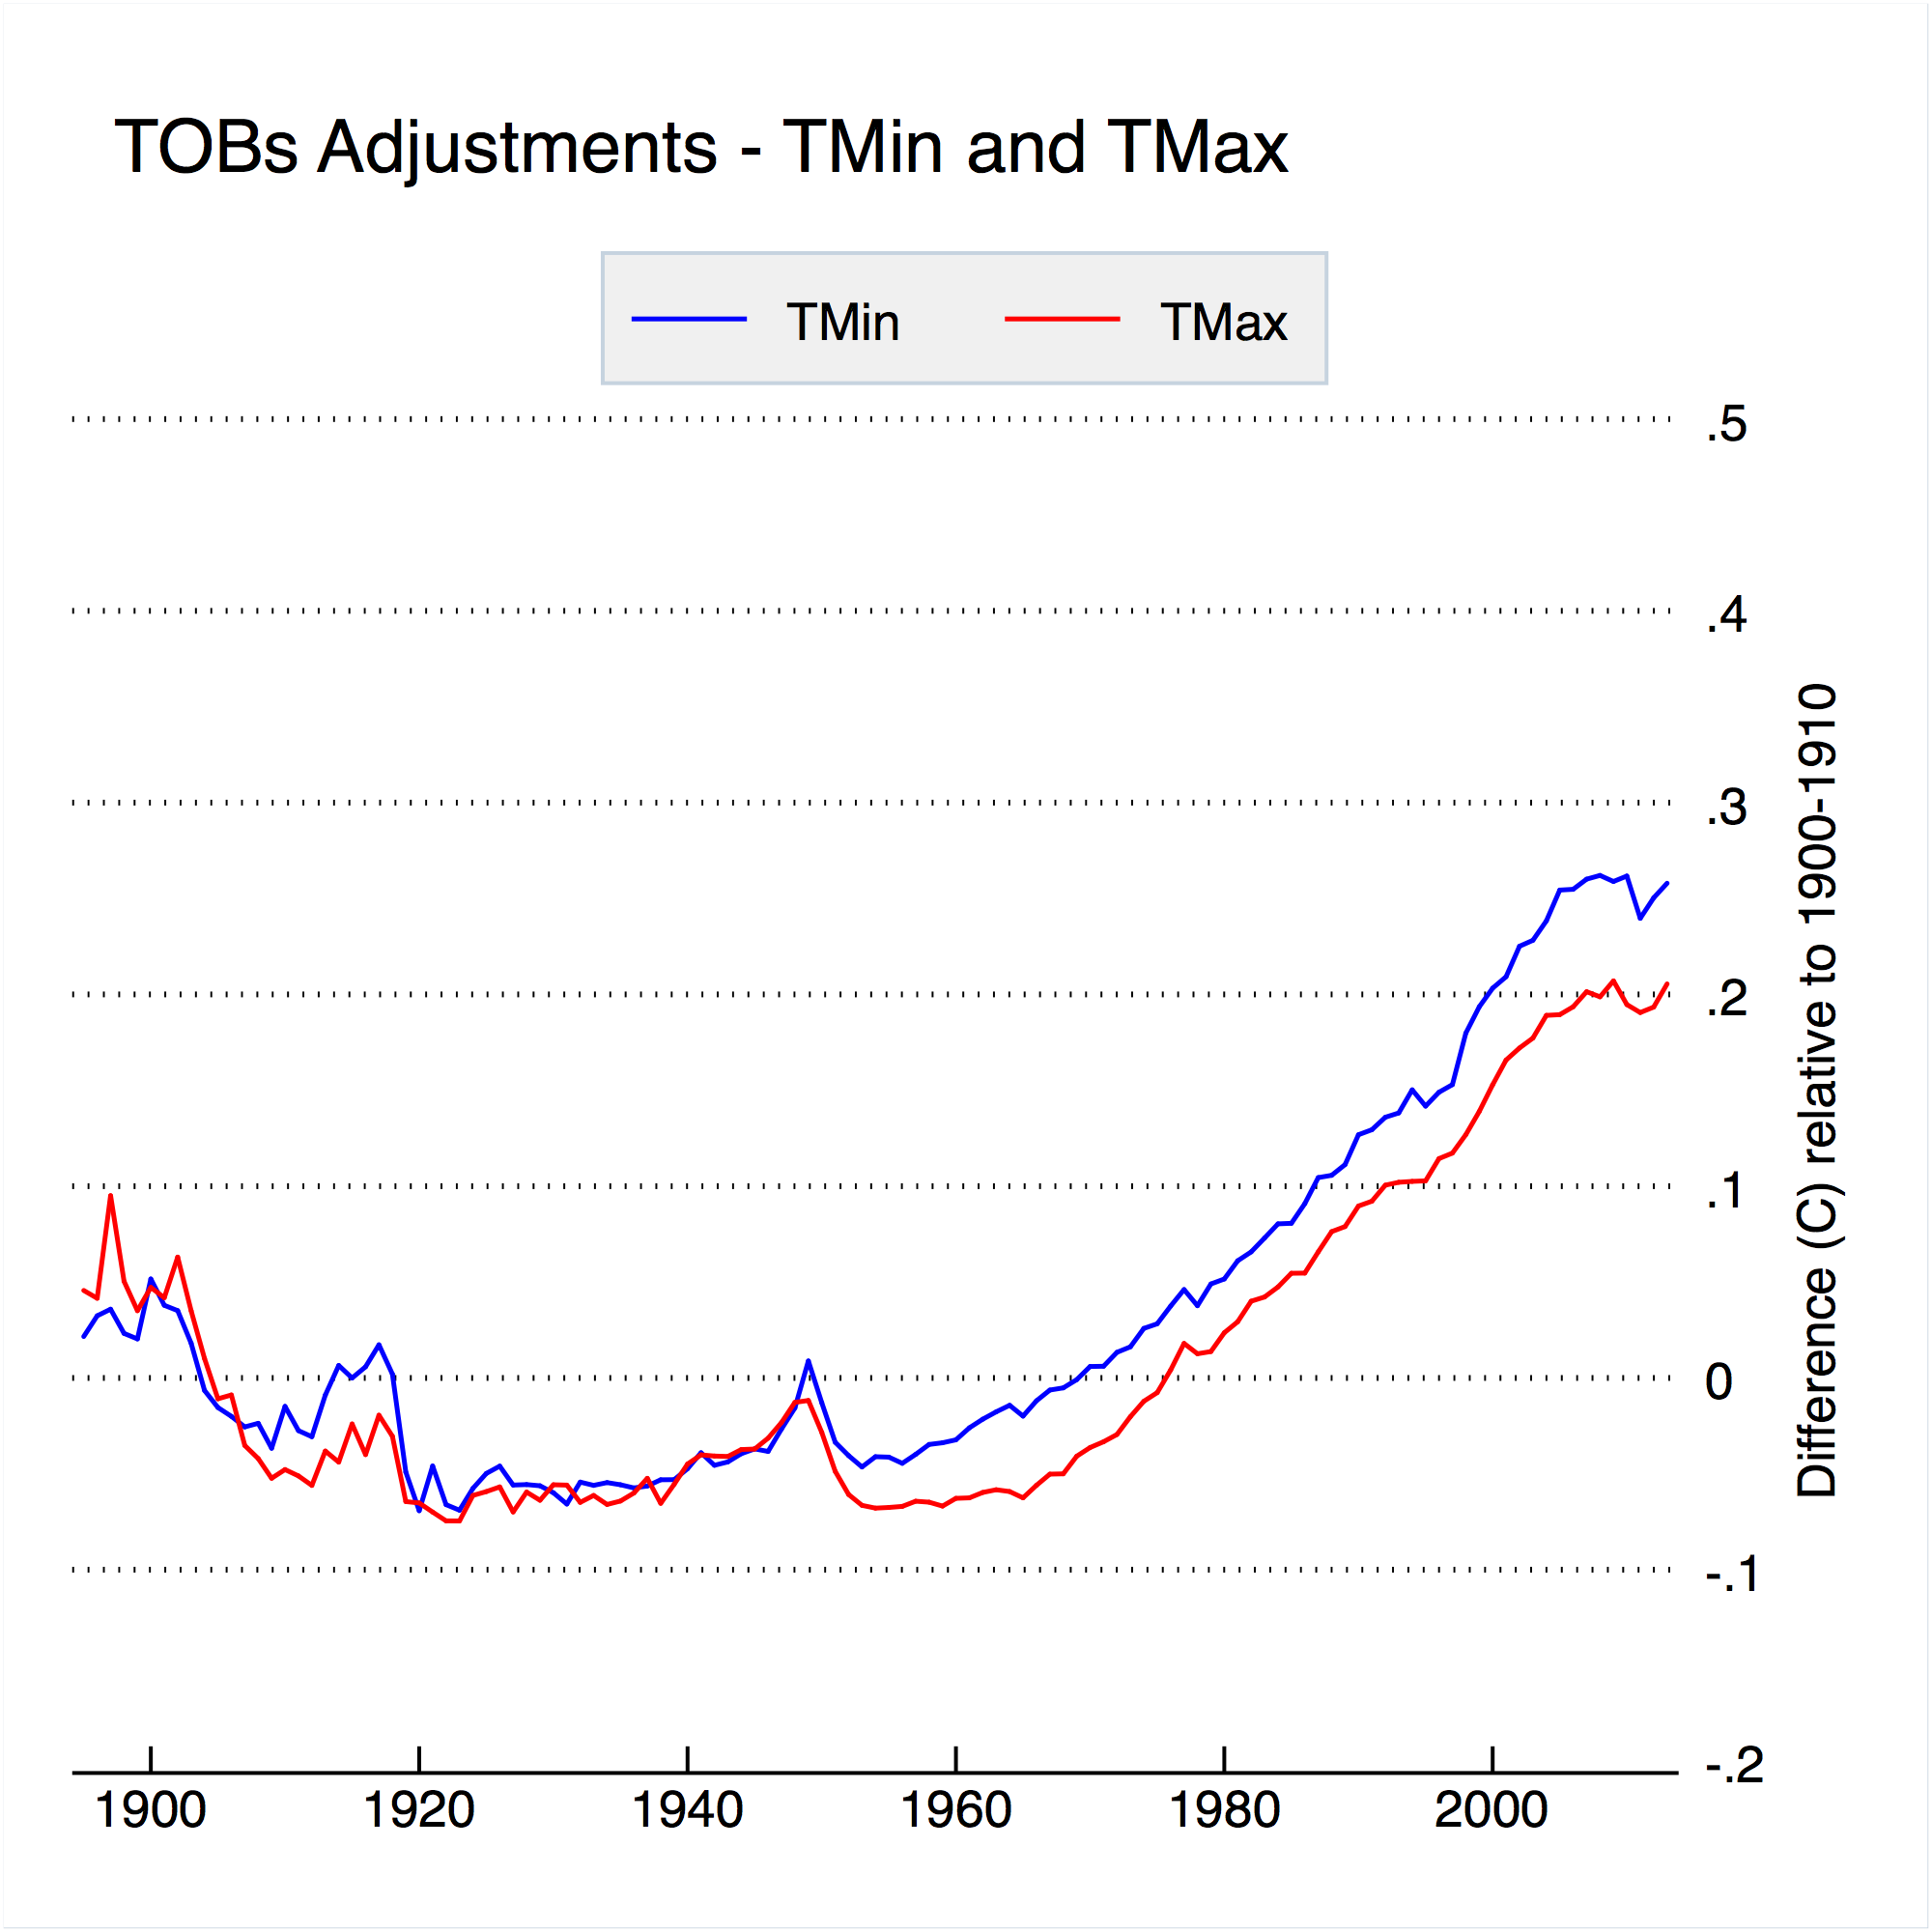
Figure 2: Net impact of TOBs adjustments on U.S. minimum and maximum temperatures via USHCN.
The net effect of adjustments to correct for time of observation changes is shown in Figue 2. TOBs adjustments increase the amount of warming in the historical temperature record by just under 0.3 C, with similar adjustments to both minimum and maximum temperatures. This adjustment alone is responsible for the majority of the difference between raw and adjusted temperatures reported by NCDC.
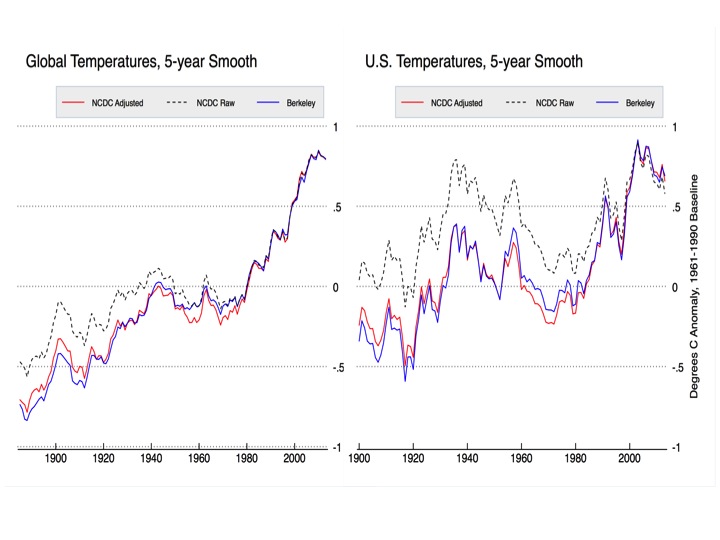
Interestingly enough, the time of observation adjustment developed by Karl et al 1986 is not strictly necessary anymore. Changes in time of observation in station records show up a step changes in difference series compared to neighboring stations, and can be effectively removed by the pairwise homogenization algorithm and similar automated techniques. For example, Berkeley Earth has no explicit TOBs adjustment, but gets a U.S. temperature record effectively identical to that of NCDC’s adjusted record. Similarly, when NCDC’s pairwise homogenization algorithm is run without the TOBs adjustment being applied first, the end result is very similar to what you get when you explicitly correct for TOBs, as discussed in Williams et al (2012).
What Impact Does Time of Observation Have?
So why does changing the time of observation create a bias in the temperature record? Astute observers will be aware that weather stations don’t take a single temperature measurement at the observation time. Rather, they use what are called minimum-maximum thermometers that record both maximum and minimum temperatures between resets of the instrument. The time at which the instrument is reset and the measurements are written down in the observers logbook is referred to as the time of observation. An image of a common minimum-maximum thermometer is shown in Figure 3.
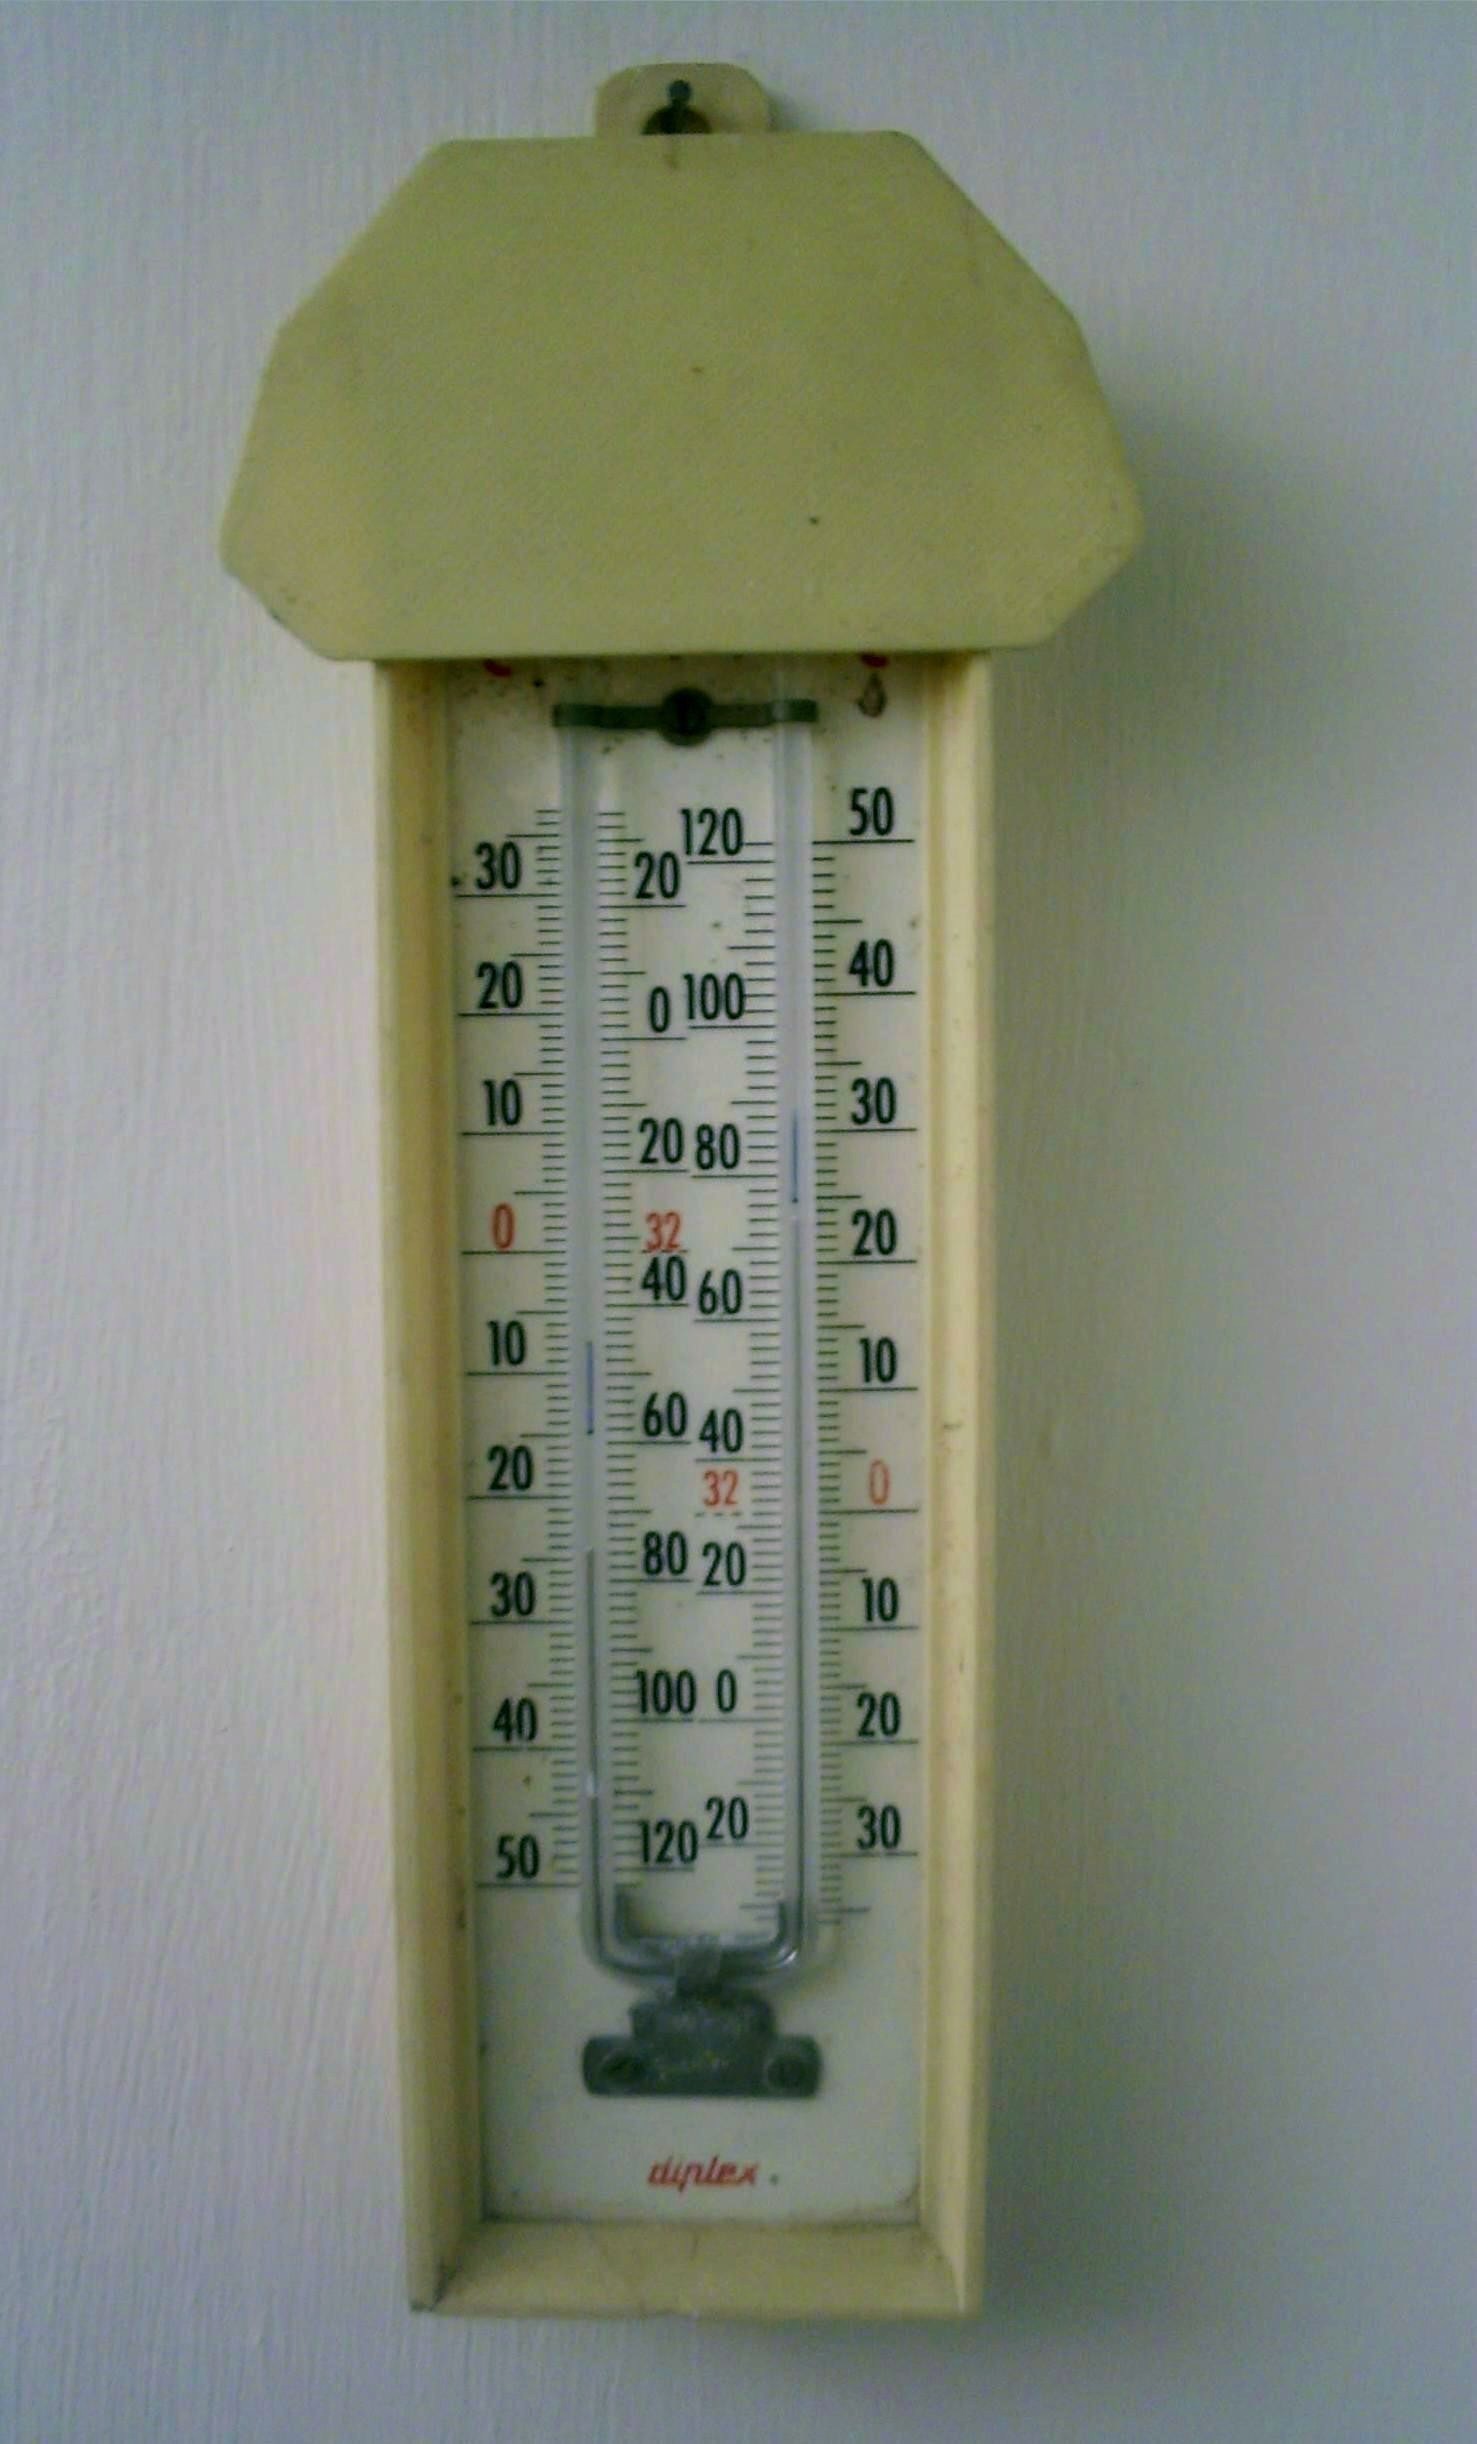
Figure 3: Example of a minimum-maximum thermometer via Wikipedia.
At first glance, it would seem that the time of observation wouldn’t matter at all. After all, the instrument is recording the minimum and maximum temperatures for a 24-hour period no matter what time of day you reset it. The reason that it matters, however, is that depending on the time of observation you will end up occasionally double counting either high or low days more than you should. For example, say that today is unusually warm, and that the temperature drops, say, 10 degrees F tomorrow. If you observe the temperature at 5 PM and reset the instrument, the temperature at 5:01 PM might be higher than any readings during the next day, but would still end up being counted as the high of the next day. Similarly, if you observe the temperature in the early morning, you end up occasionally double counting low temperatures. If you keep the time of observation constant over time, this won’t make any different to the long-term station trends. If you change the observations times from afternoons to mornings, as occurred in the U.S., you change from occasionally double counting highs to occasionally double counting lows, resulting in a measurable bias.
To show the effect of time of observation on the resulting temperature, I analyzed all the hourly temperatures between 2004 and 2014 in the newly created and pristinely sited U.S. Climate Reference Network (CRN). I looked at all possible different 24 hour periods (midnight to midnight, 1 AM to 1 AM, etc.), and calculated the maximum, minimum, and mean temperatures for all of the 24 hours periods in the CRN data. The results are shown in Figure 4, and are nearly identical to Figure 3 published in Vose et al 2003 (which was used a similar approach on a different hourly dataset).
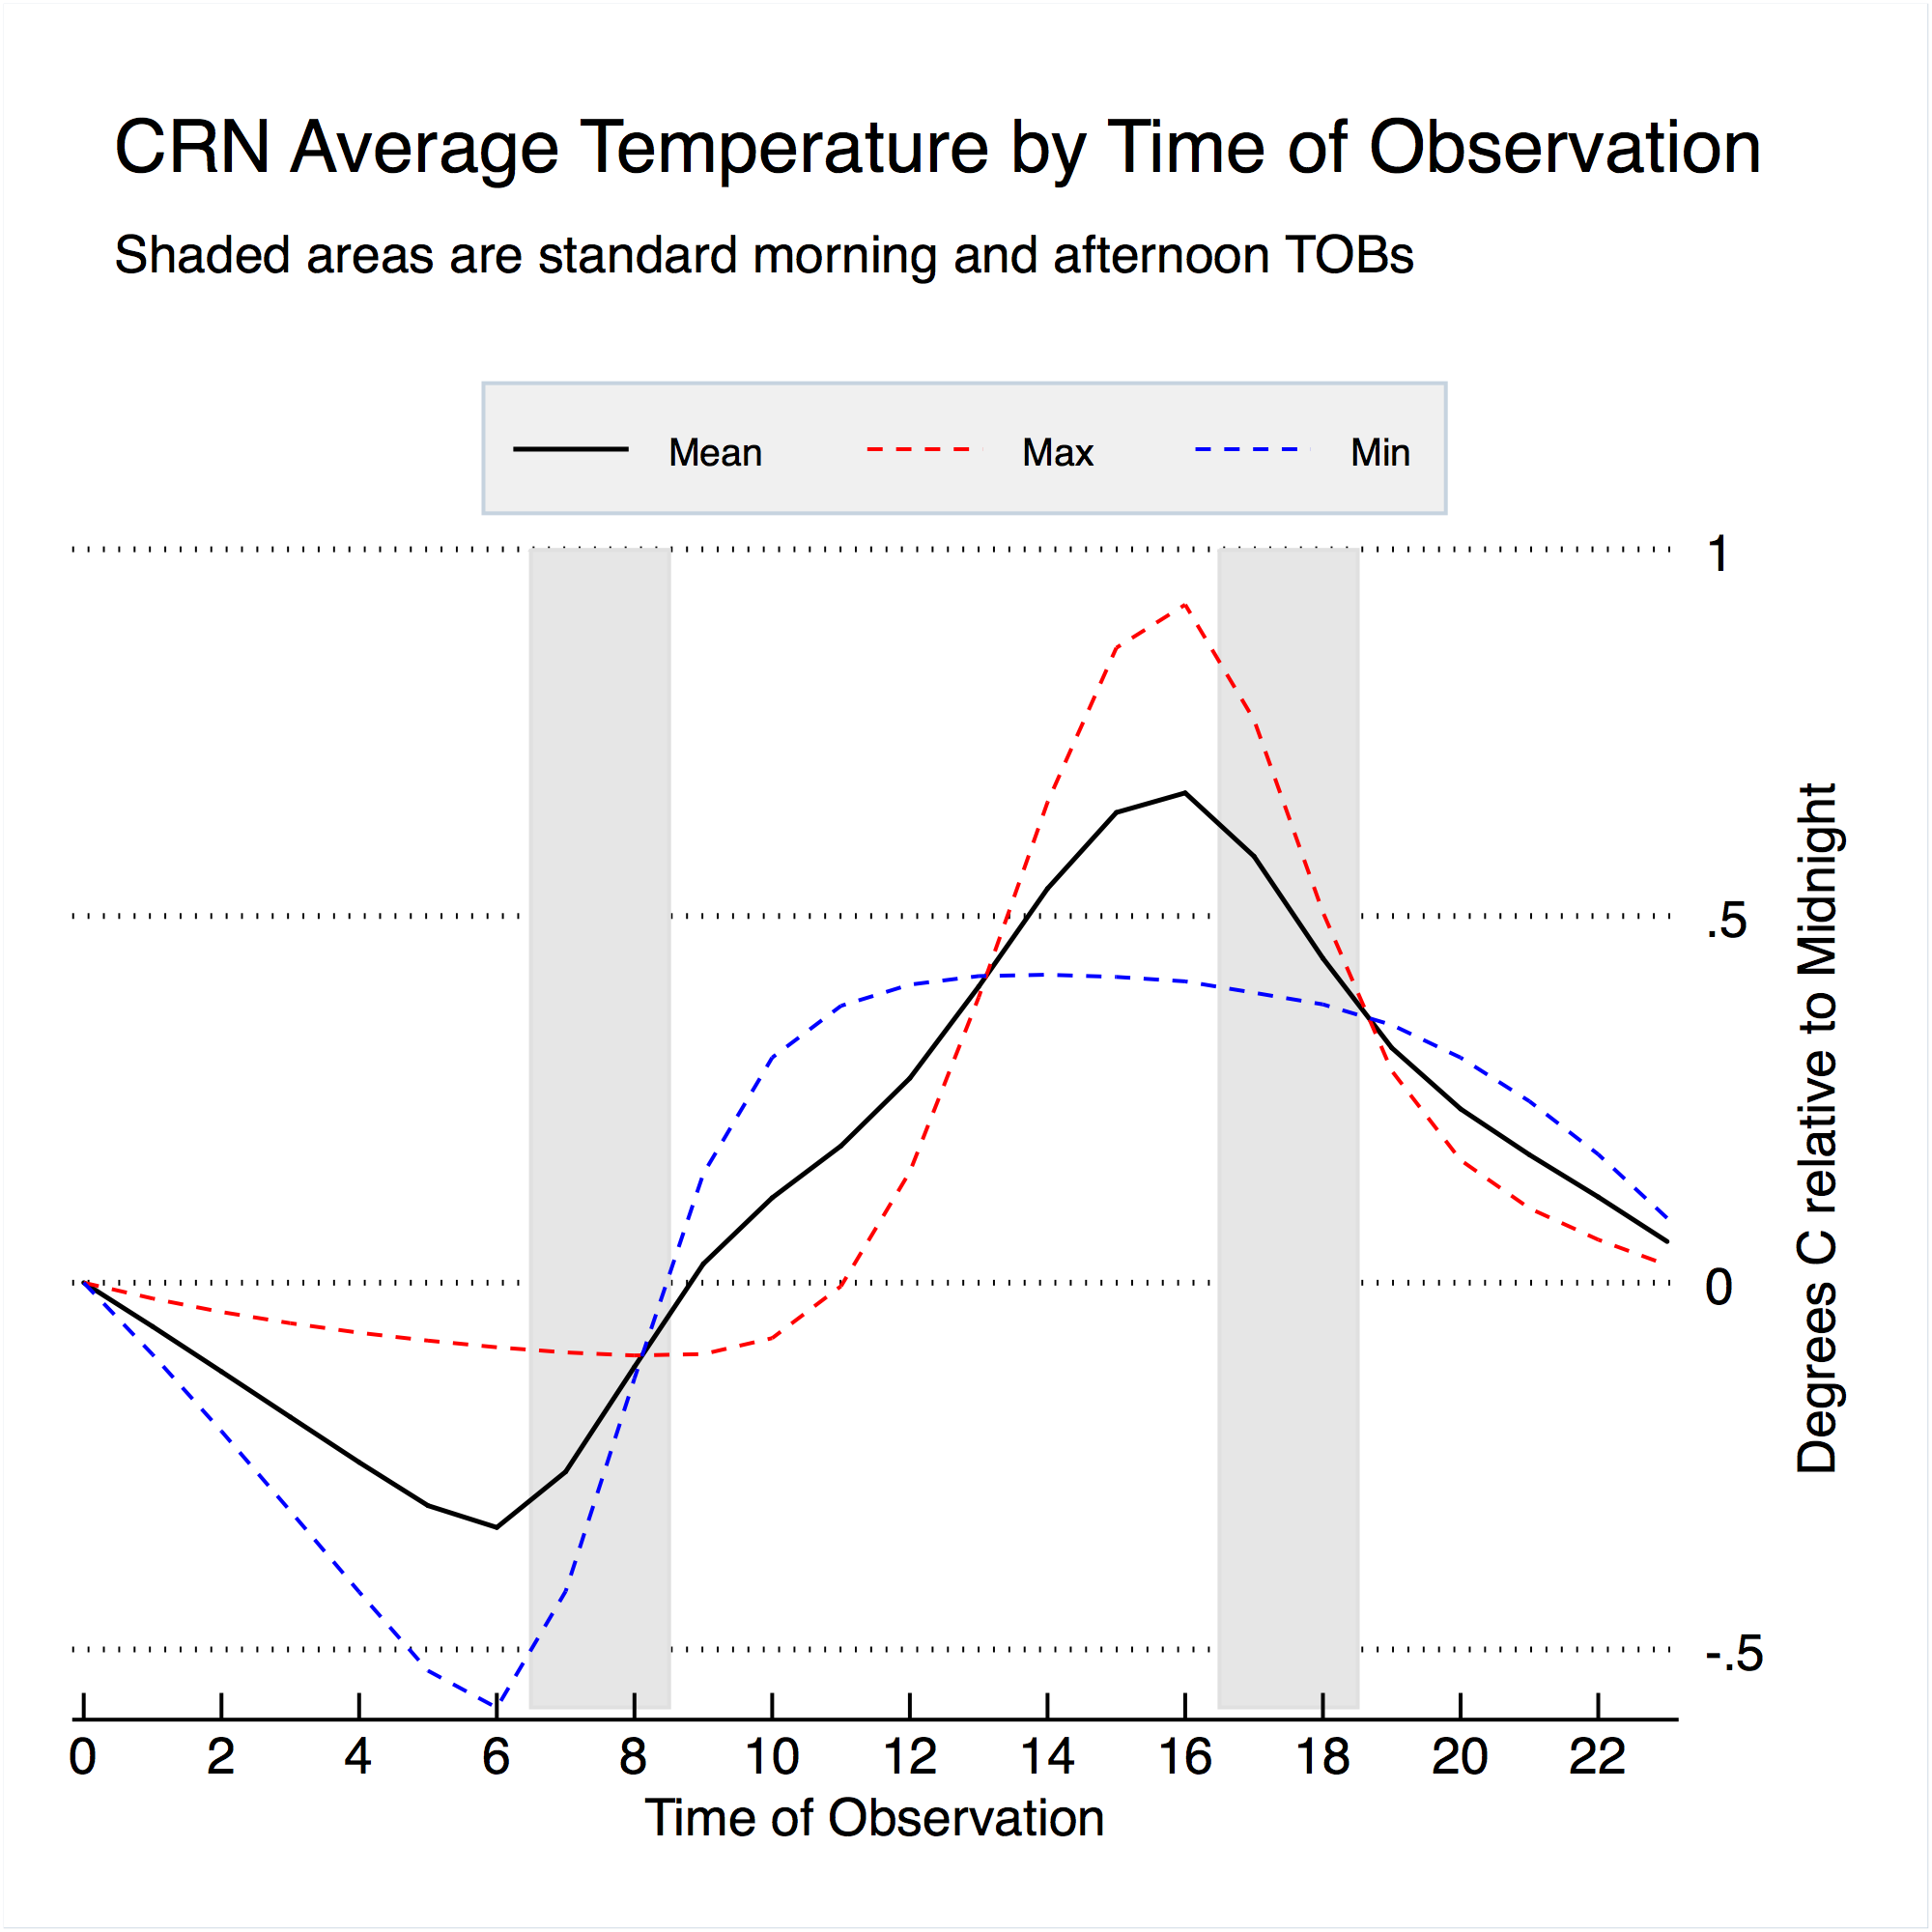 Figure 4. Impact of observation time on resulting temperatures (relative to midnight) based on 2004-2014 USCRN hourly data.Shaded areas reflect most common morning and afternoon observation times.
On average, observing temperatures (and resetting the minimum-maximum thermometer) in the early morning results in reading about 0.15 C cooler than if temperatures were observed at midnight. Observing temperatures in the late afternoon results in temperatures about 0.45 C warmer on average than if temperatures were observed at midnight. Switching from an afternoon time of observation to a morning time of observation would result in minimum, maximum, and mean temperatures around 0.6 C colder previously measured.
What Would Happen to the Climate Reference Network if TOBs Changed?
Another way to look at the impact of time of observation changes is to use the “perfect” Climate Reference Network (CRN) hourly data to see exactly what would happen if observation times were systemically changed from afternoon to morning. To do this I took CRN hourly data and randomly assigned 10 percent of stations to have a midnight time of observation, 20 percent of stations to have a 7 AM observation time, and 70 percent of stations to have a 5 PM observation time, similar to the U.S. Historical Climate Network (USHCN) prior to 1950. I then had 50 percent of the stations that previously had afternoon observation times shift to morning observation times between 2009 and the start of 2014. This is shown in Figure 5, and results in a time of observation shift quite similar to that of the USCRN shown in Figure 1, albeit over a 5 year period rather than a 50-year period.
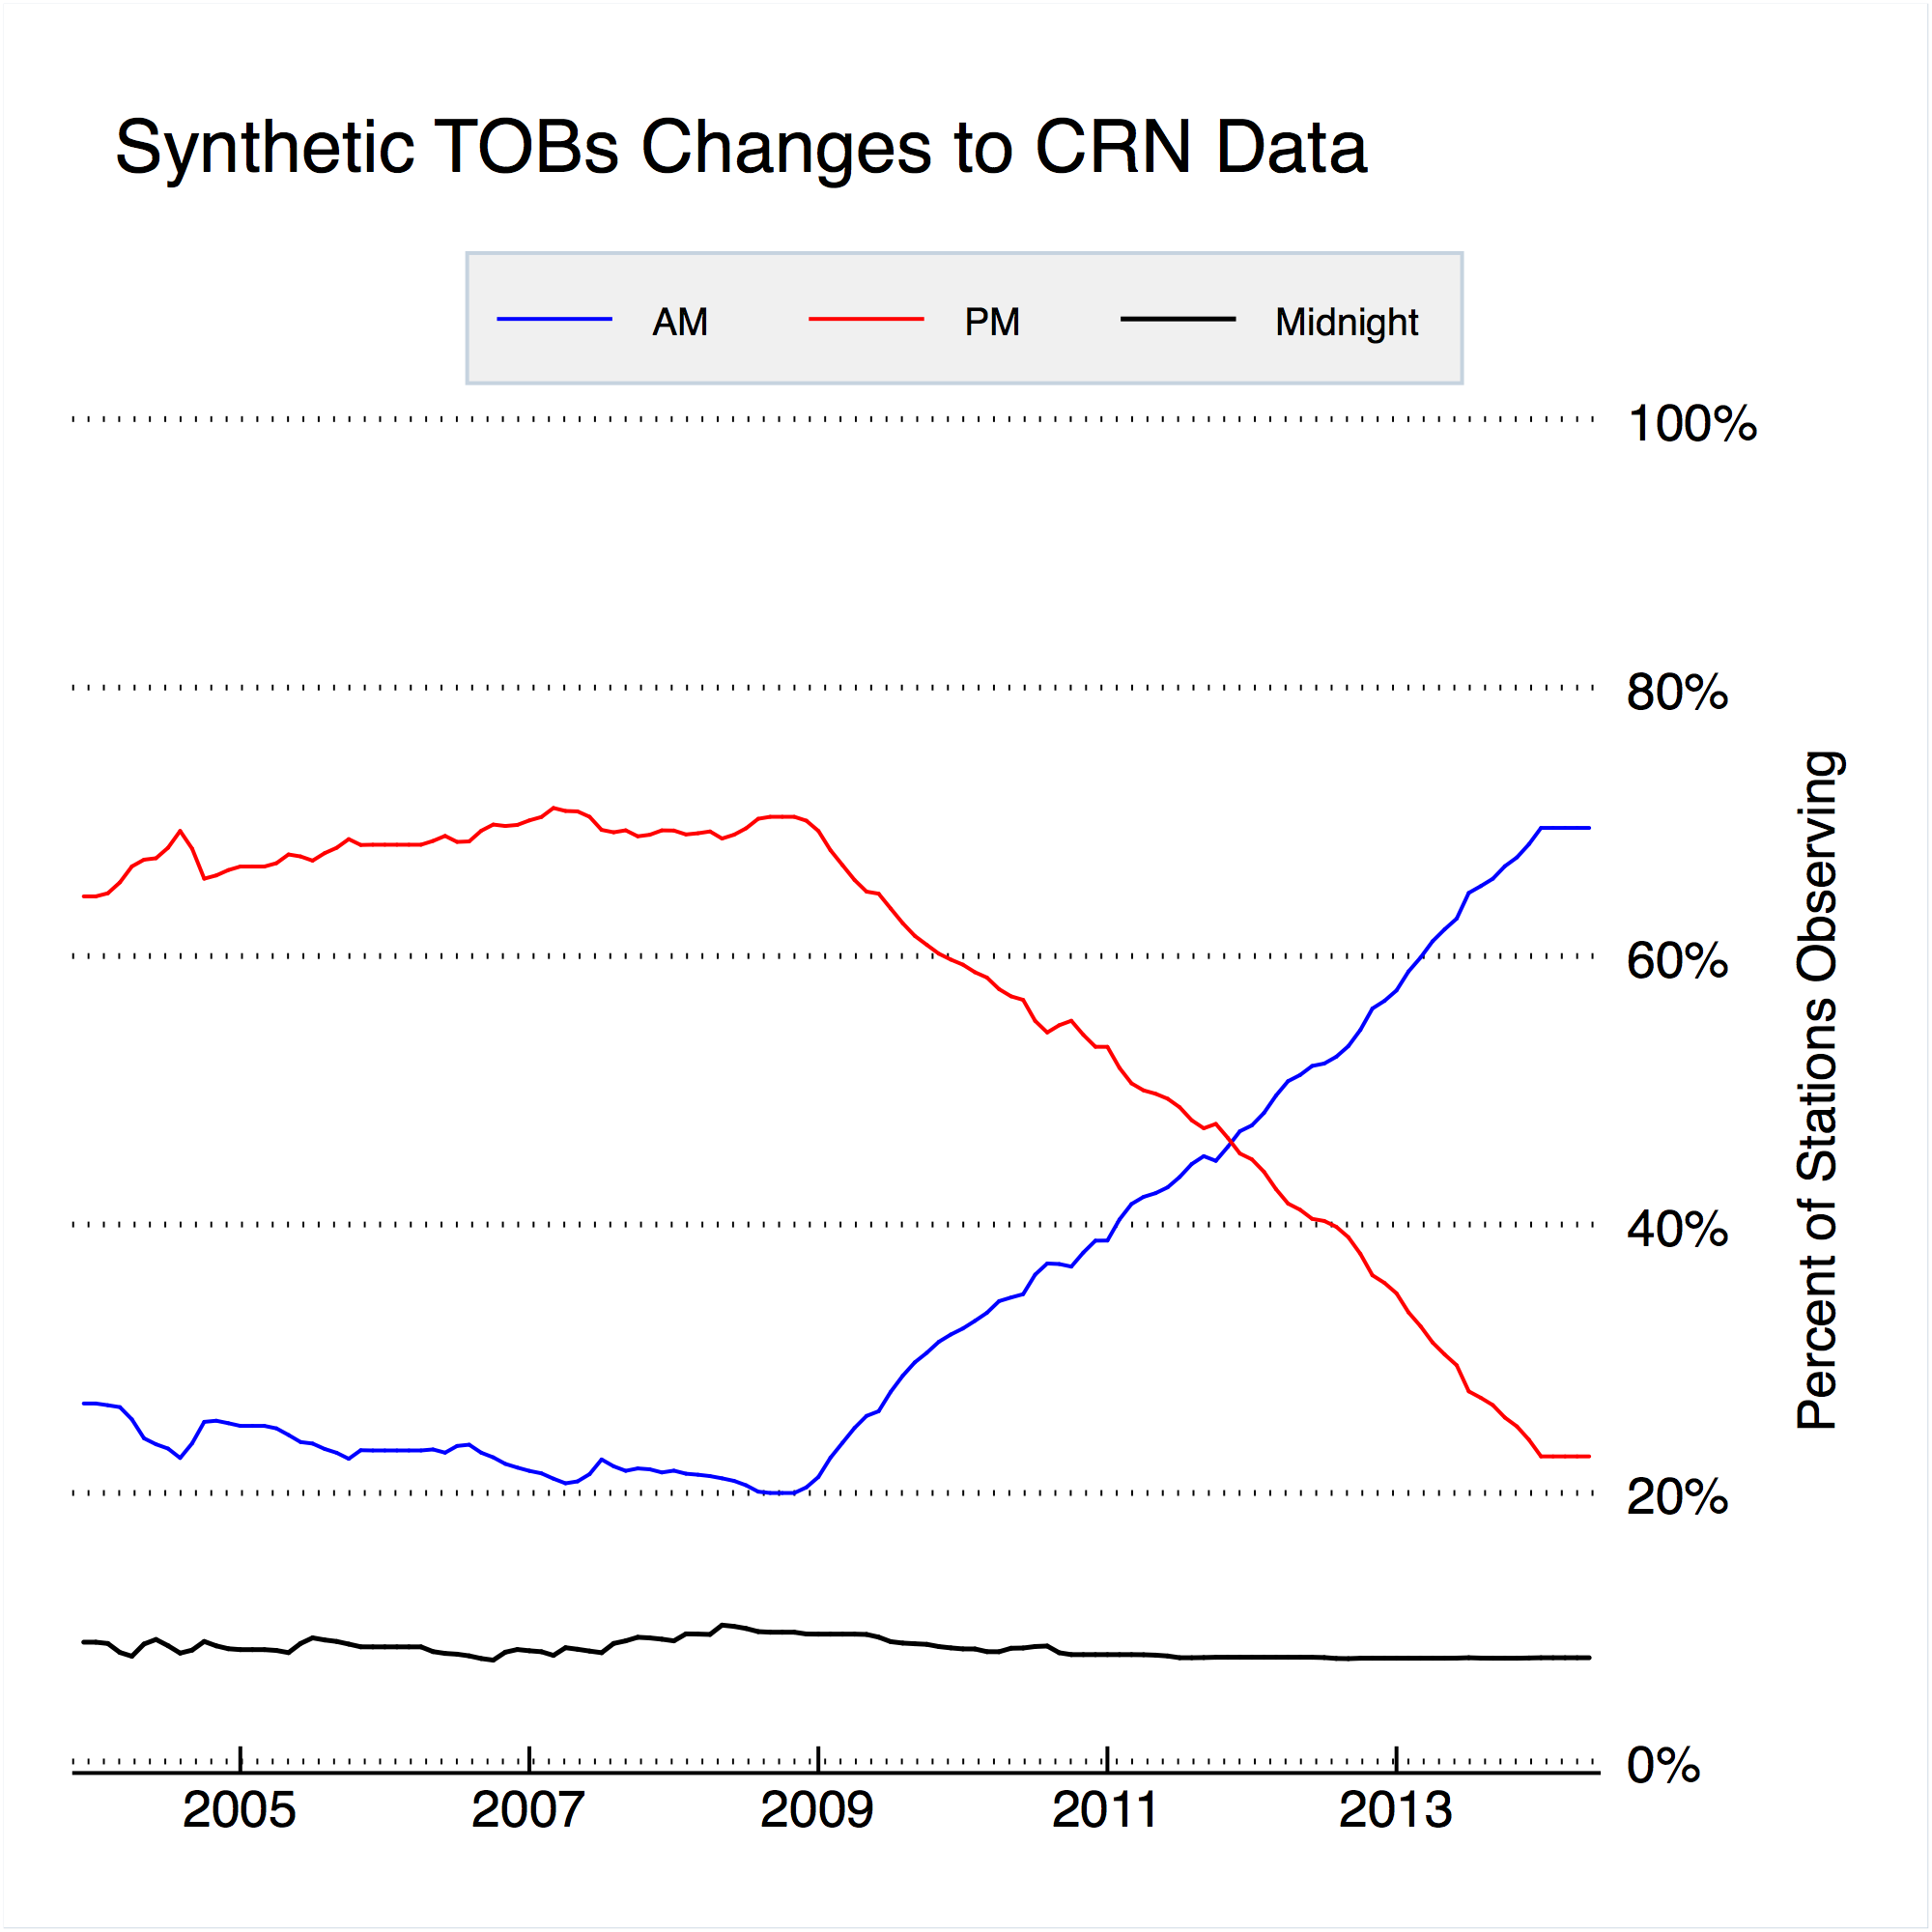
Figure 5. Synthetic observation times applied to hourly CRN data. Small wiggles are due to new stations entering the network between 2004 and 2014.
To determine the impact of changing observation times, I look at two scenarios: one where the time of observation is changed as shown above, and one where the time of observation remains unchanged for all stations. To calculate U.S. temperatures for each, I convert the temperature data into anomalies relative to a 2005-2013 baseline period, assign stations to 2.5×3.5 lat/lon grid-cells, average all the anomalies within each grid-cell for each month, and create a contiguous U.S. temperature by weighting each grid-cell by its respective land area. This is similar to the process that NOAA/NCDC use to calculate U.S. temperatures. The results are shown in Figure 6.
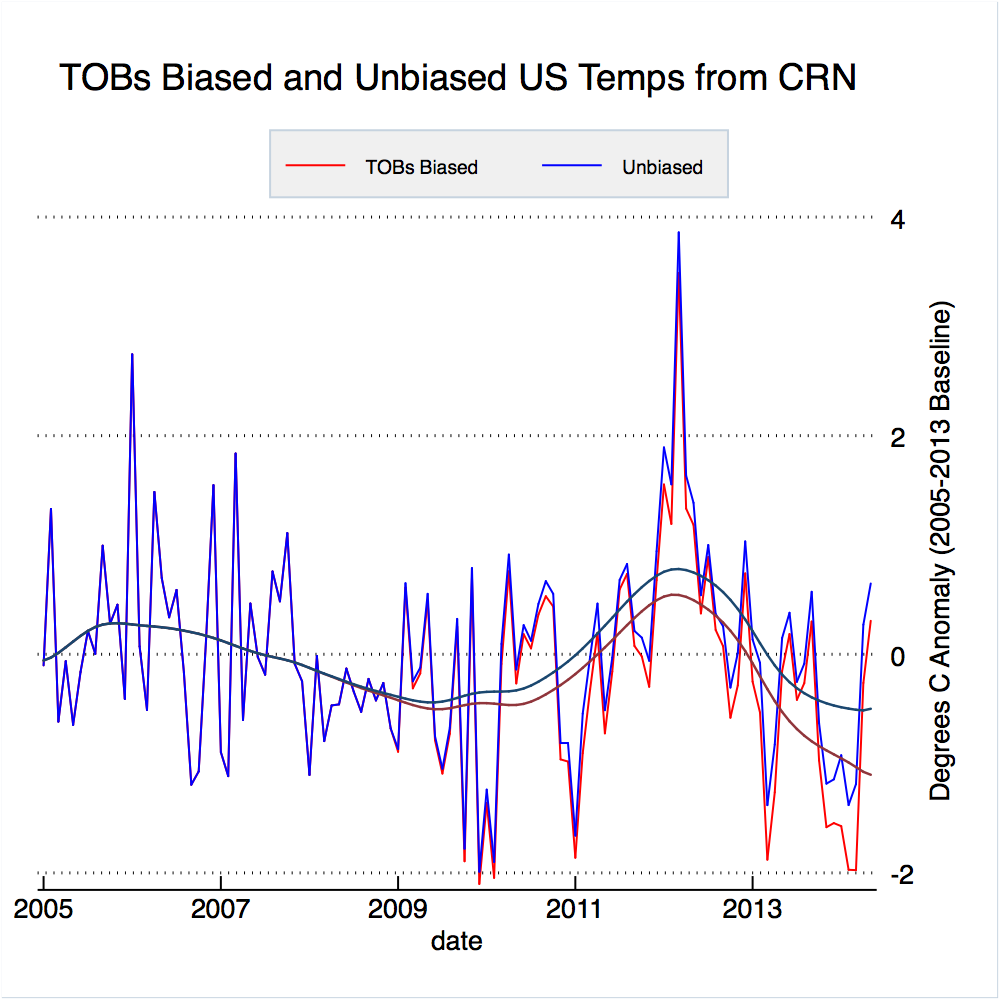
Figure 6. Contiguous U.S. monthly temperature anomalies from unbiased and synthetic TOBs-biased CRN data. Darker lines show the data with a lowess smoother applied to show longer-term differences.
When the time of observation is systematically changed from afternoon to morning in the Climate Reference Network, a clear cooling bias emerges. Temperatures are consistently lower in the TOBS biased data after the shift in observation time for daily minimum, maximum, and mean temperatures. The net effect of the TOBs bias is shown in Figure 7.
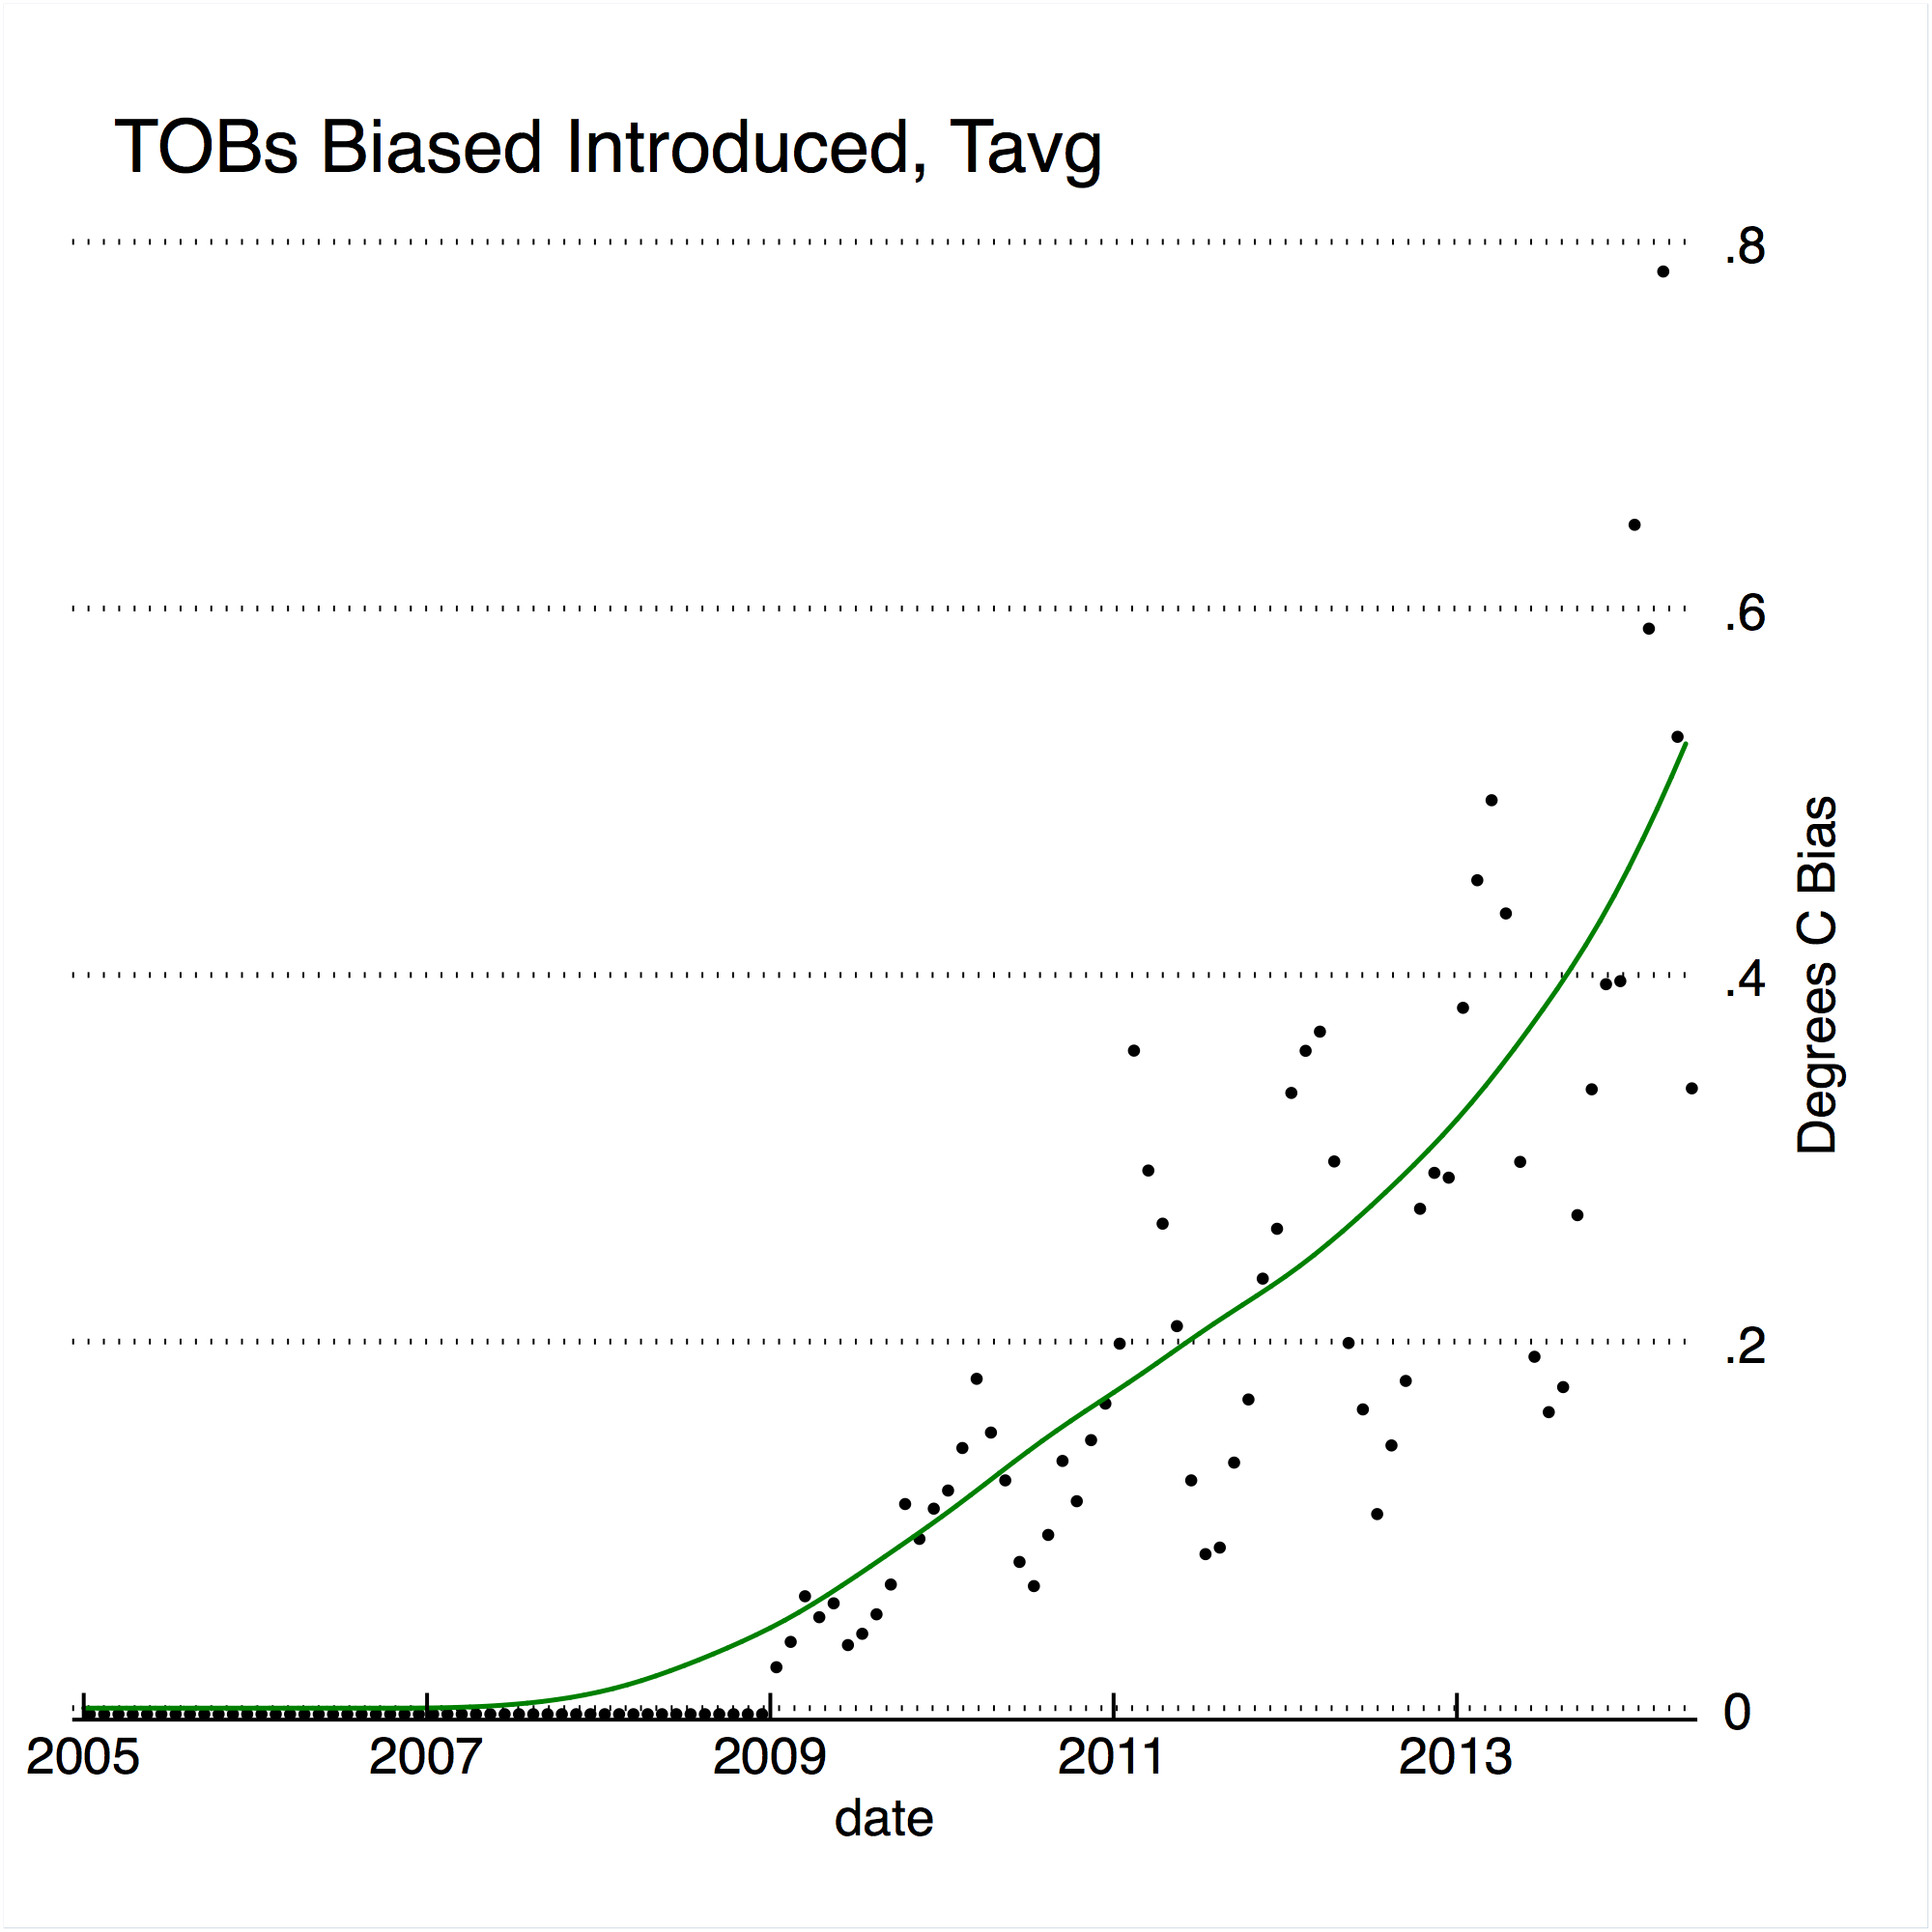
Figure 7. Bias introduced to contiguous U.S. monthly temperatures by synthetic TOBs adjustments. Green line shows the data with a lowers smoother applied.
There is a cooling bias of about 0.5 C introduced to the conterminous U.S. temperature record from CRN data by shifting observation times from 5 PM to 7 AM in 50 percent of stations. Interestingly, there is a strong seasonal cycle in the TOBs bias, with the largest differences seen in February, March, and April, similar to what Karl et al 1986 found. This bias of 0.5 C is of similar magnitude in the minimum, maximum, and mean temperatures. It is slightly larger than the ~0.3 C TOBs adjustments made to USHCN data (shown back in Figure 2) for two reasons: first, the percent of stations shifting from afternoon to morning is slightly higher in my synthetic CRN data than what actually occurred in USHCN; second, not all observers actually record at 7 AM and 5 PM (they tend to range from 7-9 AM and 5-7 PM, and later morning and afternoon readings result in slightly less bias as shown in figure 4).
It is clear that the shift from afternoon to morning observations in the United States introduced a large cooling bias of about 0.3 C in raw U.S. temperatures. As contiguous U.S. temperatures have risen about 0.9 C over the last century, not correcting for this bias would give us a significant underestimate of actual U.S. warming. While some commenters have hyperbolically referred to temperature adjustments as “the biggest science scandal ever”, the reality is far more mundane. Scientists are working their hardest to create the most accurate possible record of global temperatures, and use a number of methods includingtests using synthetic data, side-by-side comparisons of different instruments, and analysis from multiple independent groups to ensure that their results are robust. I’d suggest that those who doubt the efficacy of their approaches do what I did: download the data and take a look for yourself.


The folks at WUWT provide a critique of TOBs adjustments today that, ironically, provides a pretty good validation for those adjustments. They compare the Kingston USHCN station to a nearby pristinely sited USCRN station. The Kingston station had its time of observation shifted from 9 PM to 4:30 PM. If we do the same shift to the hourly Kingston CRN data, we get quite similar results:
Over this period, the mean USHCN Kingston TOBs adjustment is -0.74
The "correct" TOBs adjustment based on the USCRN Kingston station is: -0.70
[RH] Adjusted image size. Please try to keep your images limited to 500px wide.
Slight error: the above figure is correct, but the TOBs corrections shown for USCRN are from midnight to 4 PM. All the TOBs corrections done to USHCN data are relative to a midnight observation time.
Zeke - The folks at WUWT, including Anthony himself, are regularly "economical with the truth". Here's proof positive of that assertion:
http://GreatWhiteCon.info/2015/01/mark-serreze-and-the-arctic-sea-ice-death-spiral/
Tony and his band of merry moderators also suppress polite but adverse commentary. How much luck do you suppose I would have if I tried to put them all straight on this occasion?
By way of example, my particular hobby horse is Arctic sea ice. I went away and posted a helpful answer to a question on the topic of "State of the Sea Ice – February 2015" that remained unanswered at WUWT. My answer is still invisible at WUWT, and the question is still unanswered:
https://archive.today/aNInJ#selection-12501.0-12507.54