


 Arguments


Another Piece of the Global Warming Puzzle - More Efficient Ocean Heat Uptake
Posted on 13 May 2013 by dana1981
Although it is still within the range of model simulations, the rate of global surface air warming over the past decade has slowed. Climate scientists, being scientists, would like to explain exactly why that has happened.
There are several possible explanations. Perhaps it's due to the natural internal variability (short-term noise) in the climate system, with more heat being shifted to the deeper oceans as a result of more recent La Niña events. Perhaps it's due to a smaller global energy imbalance due to more aerosol cooling and lower solar activity offsetting more of the greenhouse gas-caused warming. Perhaps it's a combination of several factors, but which is the main cause of the slowed surface warming over the past decade?
Meehl et al. (2011) found that in their model simulations, there were 'hiatus decades' with little surface warming, but increased deep ocean warming (Figure 1). Similarly, Guemas et al. (2013) concluded that most of the recent slowed surface warming can be attributed to the increased accumulation of heat in the oceans.
Figure 1: Composite global linear trends for hiatus decades (red bars) and other decades (green bars). Positive values for top of the atmosphere (TOA) net radiation (left-hand side) indicate energy accumulating in the system (i.e. global warming). Right-hand side shows ocean heat content decadal trends, for the various ocean layers. From Meehl et al. (2011).
These results are also consistent with several studies showing a recent increase in ocean warming (e.g. Levitus et al. 2012, Nuccitelli et al. 2012, and Balmaseda et al. 2013).
Is this the best explanation for the slowed surface warming, and why is it happening? In a new study published in Geophysical Research Letters, Watanabe et al. (2013) seek to answer these questions.
Model Simulations
Watanabe ran simulations with five general circulation models (GCMs) – CanCM4, CNRM-CM5, CSIRO Mk-3.6, HadCM3, and MIROC5. In comparing the observed temperature changes to the model simulations, they suggest that the recent surface warming slowdown is due to a large natural flucuation, and/or that some source of bias in climate models is making it difficult for them to simulate it.
They mainly focused their analysis on the MIROC5 climate model, and found that in 11 individual model runs, it did reproduce a surface temperature cooling trend over the past decade twice (Figure 2).
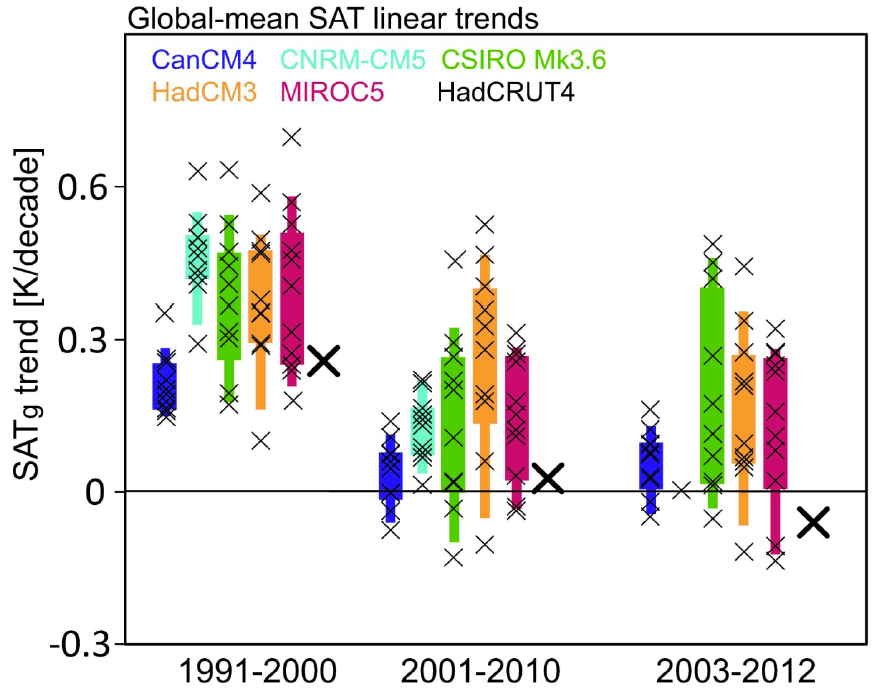
Figure 2: Global average surface temperature (SATg) trends during the last two decades for 1991–2000 (left), 2001–2010 (middle) and 2003–2012 (right). Thick ‘X’ marks indicate the observational linear trends, while thin marks represent the trends in historical ensembles from the five CMIP5 models having more than 10 members. Thick (thin) bars denote the 50% (75%) range of the trend values in each ensemble.
It's Not Changes in the Global Energy Imbalance
Watanabe et al. noted that the global energy imbalance from 2001 to 2010 in their climate models was somewhat smaller than in the observational data. Yet the climate models also simulate more surface warming than is observed. In other words, the slowed surface warming isn't a result of a smaller global energy imbalance due to factors like increased cooling from human aerosol emissions. As Watanabe et al. note,
"This implies that errors in the external forcing agents, even if they exist, do not explain the overestimation of the SATg trend for 2001–2010."
More Efficient Ocean Heat Uptake is a Better Explanation
Similar to the Meehl et al. (2011) 'hiatus period', Watanabe et al. found a strong correlation between global surface temperatures and sea surface temperatures over the Pacific. They then applied a simple statistical correction using this relationship with sea surface temperatures to determine whether internal variability could explain the slowed global surface warming.
The model originally overestimated ocean heat content in the upper 300 meters and underestimated it for 300–1,500 meters for the decade of 2001–2010. When applying this statistical correction, Watanabe et al. found an enhanced overall ocean heat uptake, which suggests that the slowed surface warming can be explained by internal variability transferring more heat to the deep oceans, consistent with previous research.
Climate model simulations expect a long-term decrease in ocean heat uptake efficiency as a consequence of global warming. Watanabe et al. offer a possible explanation for this model expectation:
"Since climate will be far from equilibrium during this period, the weakening in κ [ocean heat uptake efficiency] should not be interpreted as saturation of heat uptake. Rather, it is likely that surface warming gradually stabilizes ocean stratification, thus reducing deep-water production at high latitudes, which acts to weaken advective heat uptake by meridional overturning circulation [cf. Meehl et al., 2011; 2013]."
What's Causing More Efficient Ocean Heat Uptake?
So why has ocean heat uptake become more efficient over the past decade instead? We don't yet know the answer to that question. Watanabe et al. suggest it could just be a product of short-term natural variability in the climate system, or it could somehow be related to human influences.
"We cannot yet conclude whether the observed hiatus was part of unpredictable natural phenomena or a deterministic response to predictable changes in external forcing agents."
Slowed Surface Warming May be Short-Lived
However, we expect ocean heat uptake efficiency to decrease in a warming world, so unless we're missing something, surface warming may soon return with a vengeance. Consistent with comments made by Virginie Guemas and Kevin Trenberth, Watanabe et al. conclude,
"Therefore, unless models miss effects of other forcing agents, it is likely that this [less efficient ocean heat uptake] process will occur and act to accelerate surface warming in coming decades."
This research adds another piece to the increasingly clear climate puzzle. The slowed surface warming over the past decade seems to be a result of more heat accumulation in the oceans due to short-term increase in ocean heat uptake efficiency. However, this trend seems unlikely to continue, and we will probably see accelerated surface warming in the coming decades.


Which makes you wonder if something similar was happening in the hiatus in temperatures in the middle of last century. But I imagine we didn't have accurate ocean heat content measurements then.
If our current models accurately modelled the absence of surface warming from 1940 to 1980, and did not include heat transport to the deep ocean, then maybe other assumptions of these models are questionable. For example, the amount of aerosols in the atmosphere may have been overstated to explain the cooling, when it was actually heat moving to the deep oceans.
This certainly is a good chance to improve the models!
I am still unconvinced of the overall thermodynamics behind the notion of "ocean heat uptake efficiency". I have no doubt mind you, that the bulk of the TOAenergy imbalance from increases in GH gases can be be found in the ocean at various depths, but what I seriously question is the direction of energy flow in accounting for the accumulation of about 0.5 x 10^22 joules per year of energy down to 2000 meters, and more when looking at even greater depths.
Given that the vast majority of energy in the oceans comes from solar SW, and that the net flow of energy planet wide is from ocean to the atmosphere, and that at any given time somewhere around 1/3 of the energy in the atmosphere came via the oceans, it seems far more accurate thermodynamically to speak about a slowdown in the transfer of energy from ocean to atmosphere. This is precisely what we see on a net basis during periods of La Niña activity or the cool phase of the PDO. Moreover, increased GH gases in the atmosphere would be expected to have the precise effect of slowing the rate of energy flow from ocean to atmosphere to space via several mechanisms. Finally, given the measured a increase in advection of energy to the Arctic via ocean currents, the increase in energy of the oceans should be expected to have the exact effect we are seeing with a rapidly declining Arctic Sea ice volume, with a great deal of this happening from ice being melted from underneath.
R Gates - Increased heat transport into the deep ocean is broadly consistent with what is known about the wind-driven ocean circulation. Stronger tropical easterly trade winds during La Nina-dominant periods (negative Pacific Decadal Oscillation [PDO]) will lead to stronger Ekman pumping in the ocean gyres. Indeed, one can see the piling up of water in the Western tropical Pacific in the sea level trend over the period of satellite altimetry (1993-to present) - a clear sign of the intensified winds there. Additionally, the intensified winds of the mid-latitude westerlies, and a poleward shift of the strongest winds toward the Antarctic Circumpolar Current will also lead to stronger convergence of surface currents, and stronger downward heat transport.
This will throttle back when we enter a period of El Nino-dominance (positive Pacific Decadal Oscillation) because the easterly trade winds will weaken. Less heat will be mixed into the deep ocean and more will remain at the surface - to be exchanged with the atmosphere. So, even though global warming will slow during that time, surface warming will speed up.
John Brookes - light-blocking sulfate pollution from global industrial activity has been declining since about 2007. This is primarily from the installation of scrubbing technology in Chinese smokestacks.
It is interesting, however, that the slowdown in ocean heat content accumulation during 2004-2007/2008 coincides with a strong global dimming during that interval. There is a tendency to ascribe changes to only one variable, but in reality a combination of variables may explain recent events.
There is the worrying possibility that 3 variables may have acted to slow surface warming during that time; the negative phase of the PDO, industrial sulfate pollution, and increased sulfates from increased volcanism of tropical volcanoes. Let's hope that that wasn't the case - it would imply significant surface warming when these 3 are no longer holding back greenhouse gas warming.
Dana, just to make sure I understand -- Fig.1shows the TOA imbalance at 1.0+/- 0.1 W/m2 at most. Is this a model estimate or a measurement? The Graeme Stephens paper has 0.6 +/- 0.4 W/m2 which is a satellite measurement. Is the Stephens' result still the best estimate of the imbalance?
JoeT - Figure 1 comes from Meehl 2011, so you'd have to check that paper (I don't have access to it). Measurements tend to vary between about 0.5 and 1 W/m2 though, depending on the data set and the paper you choose.
Dana, thanks for the informative post.
A copy of the Stephens paper can be found here:
http://www.aos.wisc.edu/~tristan/publications/2012_EBupdate_stephens_ngeo1580.pdf
JoeT - Figure 1 is from model simulations with a global energy imbalance of 1 W/m2. The point being that the model demonstrates 'hiatus decades' even under strong global warming. That would likely be due to the changes in wind, as discussed above.
Balmaseda (2013) suggest the current top-of-the-atmosphere (TOA) radiative imbalance is larger than that found in the Loeb and Stephens papers.
Interesting regarding this discussion is the latest paper by Meehl et al. A copy can be found here.
Figure 1 in this post is compared with 'accelerated warming' decades in their figure 2. Same energy flux at the TOA, but quite a different picture for the OHC trends.
Thanks Jos. Will draft up a post on the new Meehl paper.
Rob,
Thanks for that explanation in repsonse to my post @2. It sounds plausible, but what bothers me is that the Pacific basin has not shown especially high ocean heat content increases, but rather it has been the Atlantic and Indian Ocean.
Also, @3 you said,
"There is the worrying possibility that 3 variables may have acted to slow surface warming during that time; the negative phase of the PDO, industrial sulfate pollution, and increased sulfates from increased volcanism of tropical volcanoes. Let's hope that that wasn't the case - it would imply significant surface warming when these 3 are no longer holding back greenhouse gas warming."
i think this could unfortunately be exactly the case, but I also would not discount a slight downward nudge from our rather sleepy sun during that time as well-- meaning that could even be a fourth factor. We had some very low total solar irradiance, and of course a current solar cycle that is the weakest in a century.
Thanks R. Gates. I had not thought of the energy flow being from the ocean to the atmosphere before, but its rather obvious now that you mention it.
John Brooks,
I do not question that heat can be be advected to depths by downwelling, for certainly it can, I simply question the overall thermodynamic perspective given that the net flow of energy is always from ocean to atmosphere on a global basis. It seems more accurate to say the oceans are releasing less rather than taking up more, which is exactly the case during La Niña and cool phase PDO. In this regard, SST's are most instructive as they tell us more about heat being transferred from ocean to troposphere rather than about how much energy the ocean is storing. During the big El Niño of 1997-98, SST's were quite high, and of course that was a good indication that energy was leaving the ocean and we saw tropospheric temps rise and ocean heat content took a dive.
R Gates - short-term sea surface temperatures are a poor diagnostic tool for global warming because they are strongly influenced by natural variability. A key point in Figure 1 is that very little energy is being lost from the climate system - surface temperatures are cool because of a rearrangement of heat in the ocean. During the negative phase of the Pacific Decadal Oscillation, more warming goes into the deep ocean.
If a significant portion of heat were being lost from the ocean, then it must warm surface air temperatures, before reaching the upper atmosphere and being radiated out to space. There is no way around that. That does not appear to have happened. The most likely scenario is that suggested by the climate model in Meehl (2011) & Meehl (2013) - the majority of this slowing of surface temperatures is due to natural variabilty (deep ocean warming) superimposed atop a long-term warming trend (greenhouse gas-induced warming of the surface ocean).
As for your comment about the Pacific Ocean warming, not sure what you find so perplexing about that.
Rob,
I completely agree with you about SST's as a poor diagnostic tool for global warming. They really just tell more about the energy leaving the ocean to the atmosphere. After the 97-98 El Nino with such high SST's, it would be more accurate to have said "look how much heat WAS in the ocean", rather than "look how much the oceans are warming."
I think overall we are saying the same thing about ocean heat storage and simply differ on perspective. You say the oceans are getting better at heat uptake, and I look at it as they are not passing as much back to the atmosphere-- but the net result is exactly the same in that much of the measured TOA imbalance can be found in the oceans, albeit we need a lot more data below 2000 meters.
Incendentally, here's some independent research that seems to confirm ocean warming over the past 40 years, showing that despite the uncertainties and calibration issues, even the older XBT data was accurate at showing the upward trend:
http://phys.org/news/2013-05-fish-thermometer-reveals-long-standing-global.html
R Gates - There are two aspects to ocean warming; increased greenhouse gas content of the atmosphere warms the cool-skin layer of the ocean and lowers the thermal gradient through that layer. Less heat (from sunlight) leaves the ocean and the surface ocean grows warmer over time. That's why the oceans are warming despite a reduction in solar radiation over the last 3 decades.
Secondly; the oceans are not passive. They have changed in response to warming, and also have a large natural variability component. Were this not so, only the surface oceans would warm, the surface layers would stratify, and surface warming would be occurring much faster than it is. The recent acceleration of ocean heat content is exaggerated due to the negative phase of the Pacific Decadal Oscillation happening on top of the long-term ocean warming trend. At some stage we are likely to see a return to the positive phase - so ocean warming will slow down.
Current observations are consistent with paleodata from warm intervals in Earth's ancient past. The equator-to-pole and, surface-to-deep ocean temperature gradients were reduced when compared to modern-day. This implies stronger transport of heat to the deep ocean and polar oceans than is going on today, and suggests the observations are tracking in that direction.
I believe a lot of the confusion stems from readers not understanding how the oceans really operate - Coriolis Effect, ocean gyres, Ekman transport, and so on. Working on fixing that.
"So why has ocean heat uptake become more efficient over the past decade instead?"
My pet theory is that there is the oceanic equivalent of the Hadley Cell at work. This upwells cold water in the tropics and downwells warm water from the tropical surface out to the mid-latitude depths. A couple of years ago I produced a plot from the ARGO data showing this:
If the ocean is becoming more energetic, then it's not unreasonable to expect this overturning to increase with the warm water forced deeper.
Here's a couple of temperature and salinity trend plots that I produced at the same time that might be relevant:
https://sites.google.com/site/climateadj/argo-analysis
Only six years of data (2005-2010), but it seemed consistent with the "Hadley" circulation becoming more vigorous with the "warm front" moving more poleward and deep.
Then again, this is only the pet theory of an amateur.
I'm not sure whether this is off topic, but I have read in other threads that there is less cold water plunging to the ocean floor around Antarctica (and presumably the Arctic too) due to the sea water becoming less saline due to increased precipitation and melting polar ice. In the Arctic that can result in a weaker gulf stream in the North Atlantic, while in the southern ocean, would the same mechanism increase the flow of water into the Humboldt current (what doesn't plunge down has to go somewhere) - behaviour of both currents are different due to land mass distribution.
I think the increase in water 'available' for the Humboldt current would automatically make it stronger, would that be a reasonable hypothesis? If that current is stronger, wouldn't the likelihood of La Niña be increased, with an associated increase of polar water migrating to the tropical Pacific, which would affect the amount of heat absorbed by the Pacific?
Dissident - that's not how the ocean circulation works. During La Nina-dominant (negative Pacific Decdal Oscillation [PDO]) global weather, such as that since the mid 90's, tropical easterly trades winds intensify. The mid-latitude ocean gyres spin faster and, due to convergence in the centre of the gyres, Ekman pumping (the downward transport of heat) is stronger. Stronger downward transport of water mass must be balanced by upwelling somewhere else, and this occurs in regions of divergence (Ekman suction) - along the equatorward travelling arms of the gyres, and along the equator itself. In the Pacific Southern Hemisphere this region of upwelling occurs along the coast of South America - the Humboldt Current.
So what we would expect to happen, during La Nina-dominant (negative PDO) global weather, is a stronger Humboldt Current and more productive fisheries there as nutrients, which support phytoplankton blooms, are sucked up from the deep. A weakening of the easterly trade winds will not only reduce the heat going into the deep ocean and lead to greater surface ocean warming, but it will weaken the Humboldt Current, weaken Ekman suction, and the fishery will not be as productive because of diminished nutrient availability.
To anyone who might have the time and interest to reply.
JoeT @4 says Stephens et al. (2012) has the TOA imbalance at 0.6 +/- 0.4. The way I read the paper it looks like 0.5 +/- 3.1 Wm^-2. Can anyone explain if either of us is correct?
Where the uncertainty bars on the TOA net radiation bars come from for a model result.
On other sites I have seen the contention that the Trenberth “missing heat” was not a meaningful issue because of the large uncertainty in the TOA net radiation. I would be very interest in you take on this.
Let me quickly add that I just found the "Trenberth can't account for the lack of warming" thread. I don't mean to say that the energy balance and ocean heating are not important, (they are very much so). It's that my working theory is that his comment was probably born of the facts that he may not have been working with an accurate number for the TOA net radiation, and there may not have been good data on ocean heat content at that time.
tcflood @19 &20.
Stephens et al 2012 is paywalled for miseryly mortals like me. Yet the figures provided rather strongly suggest that the 0.6 W/m^2 is the intended take-home number.
However I have the feeling you are not just interested in Stephens et al 2012, but more in the TOA imbalance.
The 1.0 W/m^2 figure which JoeT @4 questioned with his introduction of the Stephens et al 2013 figure was introduced into Meehl et at 2011 for use in 21st century simulations and based on the present day 0.9 W/m^2 of Treberthetal et al 2008 and the 0.85 W/m^2 of Hansen et al 2005, the former an instrument-based study and the latter using models confirmed by OHC data, particularly Willis et al 2004 whose data for 0-750m OHC Hansen et al 2005 used to infer a 0.6 W/m^2 imbalance in this depth of ocean.
OHC was not as well measured back in 2004 as it is today. The Levitus 0-2000m OHC (graphed below) gives an average OHC rise equal to 0.8 W/m^2 of global warming over the last 8 years. To that must be added the OHC below 2000m and the ice loss & surface/atmosphere warming. So I would reckon that proposing a 1 W/m^2 TOA imbalance would perhaps be a tad high but not ridiculous.
MA Rodger,
Thanks for taking your time to respond.
I'm mainly interested in the error analysis and am apparently having trouble with the math. The numbers in the figure are the same as in the paper. Please check me ...
SWR(in) - SW(out) - LW(out) = TOA imbalance
= 340.2(+/-0.1) - 100.0(+/-2) - 239.7(+/-3.3)
= 0.5(+/-3.9)
I have been trying to come to grips with the old denialist chestnut that there was no "missing heat." If the error in the imbalance is 8 x the value, perhaps the best answer is that the initial assertion was ill-advised becasue we can't say whether there was energy missing or not from our global heat accounting (including all the spheres - atmo, hydro, cryo, etc.). This then leaves us unencumbered to deal with "15 year heating pauses" as the natural result of changing O-A heat transfer patterns without getting sidetracked by the red herring of the "missing heat" cavil.
MA Rodger,
I just gleaned from the paper that they get the 0.6(+/-0.4) by assuming their OHC is complete and accurate and calculating back to what the outbout LWR must be. I have to say that it would be much wiser to just say we don't have a good number on the OLWR and carry on with our analysis of total global heat change and its relationship to average global near-surface air temperature. Perhaps the public needs to be trained to key on total heat changes rather than the AGNSAT (if possible).
tcflood @23.
I was much to hasty @21 with my analysis of recent OHC and fell foul of a bit of inadvertent cherry-picking.
So we come to agreement. I calculate OHC as per Levitus at 0.5 W/m^2 yielding a global warming of some 0.6 W/m^2.
The graph I mentioned also didn't appear. It cannot be displayed here but only be linked to from its present location (see down link here - it may take 2 clicks 'to download your attachment'.) due to the Google double click.
So Trenberth's missing energy remains missing.
I added an extra section on Watanabe's results to a blog post I had written on a proportional land/sea warming model.
http://theoilconundrum.blogspot.com/2013/05/proportional-landsea-global-warming.html
The gist is that I think it may be possible to infer this ocean heat uptake by comparing the land and ocean temperatures in a systematic fashion. There is a fractional value, f, that elates the land to sea surface temperature and which corresponds to the ocean heat uptake, i.e. lower values means that more heat is being sunk by the ocean.
I think Watanabe et all are correct in inferring that the ocean heat uptake is causing the plateauing of the global temperature. It is also clear that this cannot continue for the long term.