


 Arguments


2013 Arctic Sea Ice Extent Prediction
Posted on 20 February 2013 by dana1981, Dikran Marsupial
We previously examined various predictions of the annual Arctic sea ice extent September minimum from 2008 through 2012, using a variety of methodologies (statistical, modeling, and/or "other"). Overall the statistical- and model-based predictions have been equally accurate, with an average difference from the observational data of 13%. Skeptical Science's Gavin Cawley (Dikran Marsupial) has been better than average with his purely statistical predictions, averaging a 10.6% difference from the annual minimum. Cawley describes his methodology thusly:
"I obtained from data for Arctic sea ice extent from 1979-2009 [2012 for the most recent predction]...I then fitted a Gaussian process model, using the excellent MATLAB Gaussian Processes for Machine Learning toolbox (the book is jolly good as well). I experimented with some basic covariance functions, and chose the squared exponential, as that gave the lowest negative log marginal likelihood (NLML). The hyper-parameters were tuned by minimising the NLML in the usual way."
2013 Predictions
Cawley's results are shown in Figure 1, and predict a 2013 September Arctic sea ice extent of 4.1 ± 1.1 million square kilometers.
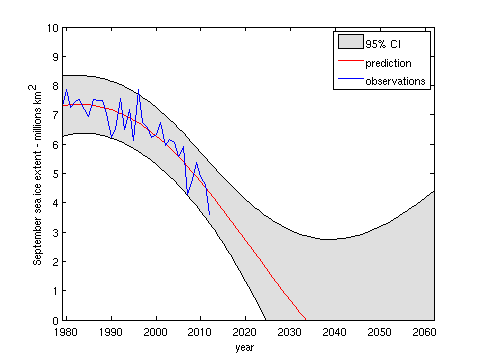
Figure 1: Gavin Cawley's Gaussian Process statistical Arctic sea ice extent prediction
It is important to note that this is a purely statistical approach, and hence some of the longer-range aspects of the prediction seem implausible, given our knowledge of the physics of Arctic sea ice. Firstly, the model predicts that the Arctic will be ice-free in September from about 2034, however in reality this is likely to be a rather pessimistic prediction. As Walt Meier explains,
"... the rapid losses have come from the Siberian and Alaskan regions of the Arctic. The region along northern Greenland and Canadian Archipelago have not lost much summer ice – for good reason. The predominant ice circulation pushes ice toward those coasts resulting in thick ice that tends to get replenished. In other words, we’ve seen a rapid decline in the “easy” ice to lose, but now we’re getting to the “more difficult” ice. I think it’s likely that that will go more slowly."
Secondly, the upper boundary of the credible interval suggests that it is plausible that sea ice may begin to increase again after 2040. There is no physical reason why this should be the case. Essentially the only expert knowledge built into the model is that the underlying long-term variation of Arctic sea ice extent is expected to be a smooth function of time (encoded by the use of the squared exponential covariance function - the degree of smoothness is inferred from the data), and the broadening of the credible interval as the model extrapolates away from the observations is in reality merely an indication that the model has no real confidence in its predictions beyond a handful of years in the future. Beyond 2030 or so, the model has little or no predictive skill; however, one of the nice things about this approach is that the user is alerted to this issue that by the breadth of the error bars.
Tamino at the Open Mind blog has likewise made statistically-based predictions, and has also been more successful than most, averaging an 8.6% difference from the annual minimum. Tamino has also offered his 2013 prediction, of a 3.97 ± 0.9 million square kilometer Arctic sea ice extent.
Figure 2: Tamino's Arctic sea ice fits with a quadratic function (model 1; blue) and a modified lowess smooth (model 2; red).
Note that neither Cawley nor Tamino predicts that 2013 will break the 2012 record (3.6 million square kilometers). There is a principle in statistics known as "regression toward the mean," which is the phenomenon that if an extreme value of a variable is observed, the next measurement will generally be less extreme, i.e. we should not expect to observe record lows in consecutive years. This is because when extremes are reached and records are broken, a number of different variables generally have to align in the same direction to make this happen. That being said, a new record in 2013 is well within the range of uncertainty in both Cawley's and Tamino's statistical predictions.
The Predicted "Record Recovery"
Anthony Watts and Steven Goddard, who have combined to make the most inaccurate Arctic sea ice predictions (Figure 3), have recently managed to make an argument that is both astonishing and entirely predictable.
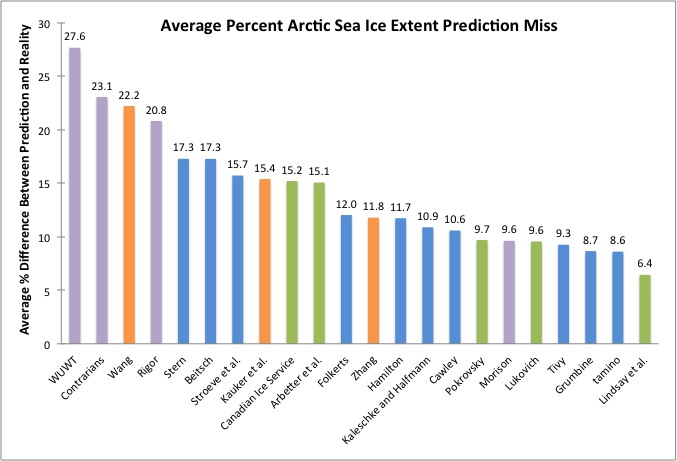
Figure 3: Percent difference between predictions and actual annual Arctic sea ice minima for individuals and groups which have made a minimum of two predictions in SEARCH and elsewhere.
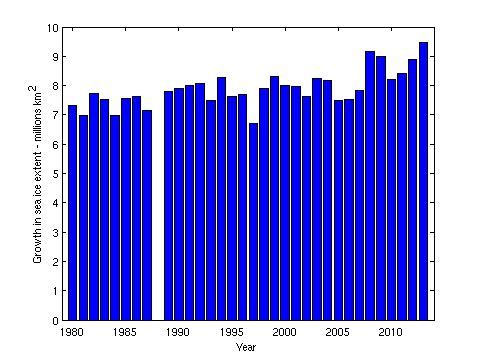
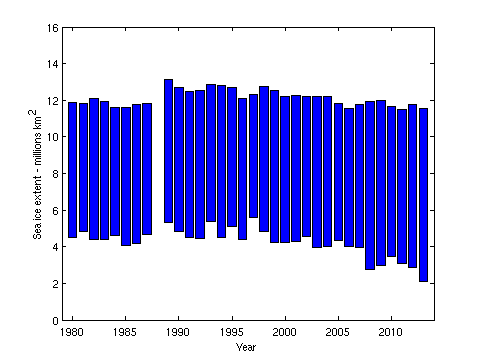
Watts and Goddard are now claiming that "the Arctic has blown away the previous record for ice gain this winter." However, Cawley shows that this is an entirely predictable result, quite simply because the annual sea ice minimum extent is decreasing faster than the annual maximum. With the distance between the minimum and maximum thus increasing, a larger "recovery" over the winter is exactly what we expect to see (Figures 4 and 5), and does not suggest any recovery in Arctic winter sea ice. This is clearly seen by presenting the ice gain as the difference between September and January observations, as shown in Figure 4(b), rather than as a simple bar chart without this context, as shown in Figure 4(a).
 |
 |
| (a) | (b) |
Figure 4: Difference between annual January and September Arctic sea ice areas. The size of the blue bars represents the size of the sea ice "recovery" each year (n.b. there is a known discontinuity in the area measurements ocurring in 1987, clearly visible in the observations, of around 0.88 million km2, due to an increase in the region imaged by the sensors on the satelites.).
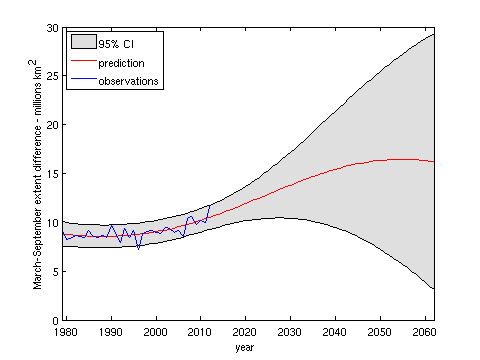
Figure 5: Predicted March-September Arctic sea ice extent difference, or "recovery", using Gavin Cawley's statistical approach.
As these figures show, the annual "recovery" has generally grown over time, and is predicted to continue to grow, simply because the annual sea ice minimum is falling faster than the annual maximum.
Sea Ice Volume
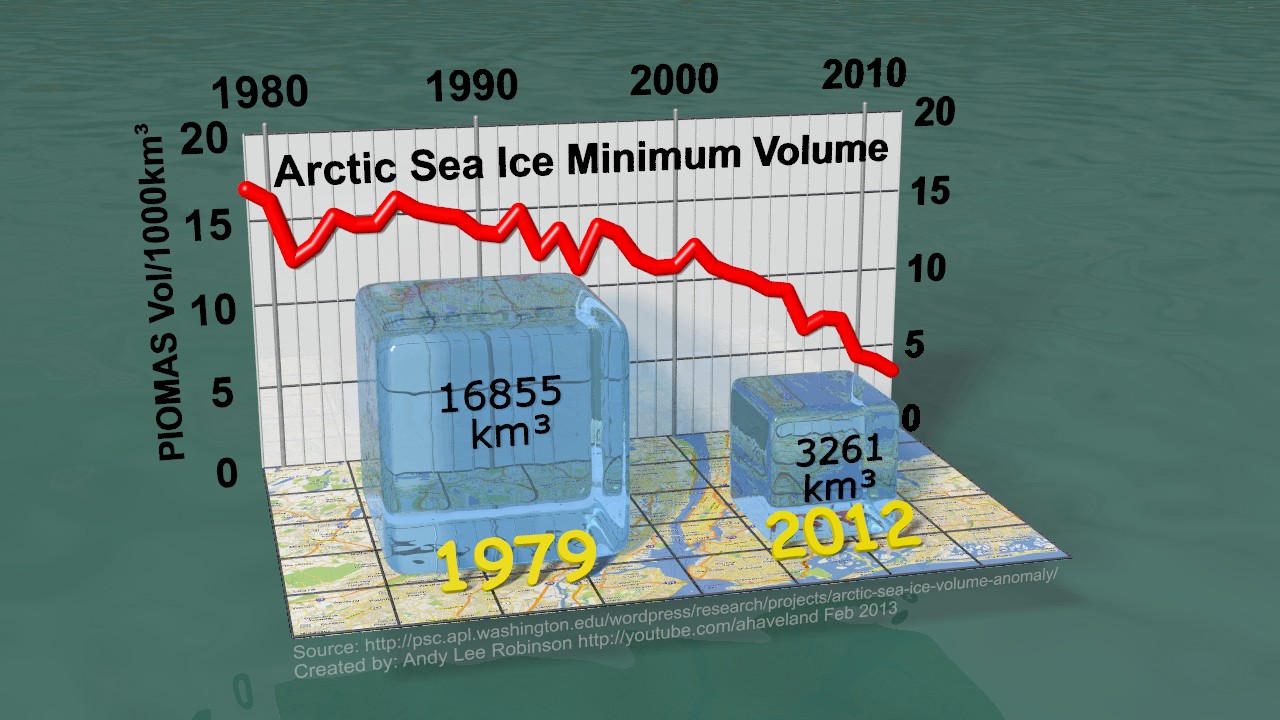
It's also always important to remember that ice is three-dimensional, and so looking at Arctic sea ice extent misses the rapid decline in the thickness of the ice as well.
To illustrate that point, Andy Lee Robinson has put together several great graphics based on the Pan-Arctic Ice Ocean Modeling and Assimilation System (PIOMAS) data from the University of Washington’s Polar Science Center. Now the European Space Agency’s CryoSat-2 probe has generally confirmed the PIOMAS results.
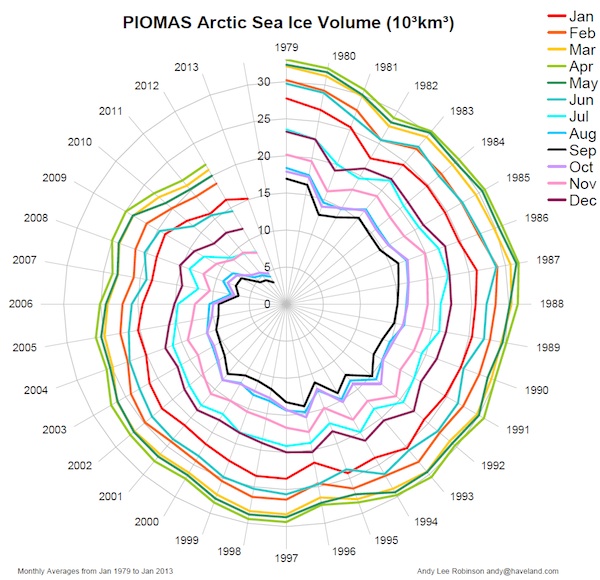
Robinson's two most recent graphics illustrate the incredible loss of Arctic sea ice volume between 1979 and 2012, representing them as ice cubes on a 10 kilometer grid map of New York, and in spiral form, illustrating that the sea ice volume has dramatically declined in every calendar month since 1979.
Robinson is also the creator of this graphic and video illustrating the Arctic sea ice mass loss.
Summary
To sum up,
- statistically-based Arctic sea ice minimum extent predictions have performed relatively well, and expect a continued rapid long-term decline.
- however, they predict that we will most likely not see a new record minimum Arctic sea ice extent in 2013.
- overly optimistic contrarian sea ice predictions have had the worst results; now they're celebrating the "record sea ice recovery", which is an expected result because the minimum extent is declining faster than the maximum extent.
- Arctic sea ice volume is also declining at an alarming rate - we've lost approximately 80% of the total volume over the past three decades.


FYI Dikran, Tamino also just took a look at the Cyosat/Piomas comparison and has plotted the differences. Interestingly, contrarian delirium set aside, this winter shows a pretty low volume; last year, a similar low volume led to the staggering record we remember, so the likelihood of being closer to last year's value than to the mean may be significant.
Robinson's imagery is of superb quality but scary by the astounding loss it shows. We are now so close to zero in summer minimum that is hard to imagine we won't hit a September ice free Arctic before 2030.
Imagine the first team working on these data when satellite were launched in 1979. Now, some dude comes around and tells them: "From these data and others', you're going to see an 80% loss of ice volume over the next 30 years." No doubt they would have laughed. Indeed what phenomenon could possibly be powerful enough to cause what is best described as a geological scale event?
4.25m km2, i.e. above last year's minimum, but below the 2007 minimum.
Going with Maslowski (I've ridden that horse for 5 years now, why stop?), I'll go with 2750 km3 for 2013 expected September volume.
My only worry is that I'm being too conservative.
Funny how the deniers are now celebrating "recovery". Does that mean they feel that 2012 was as low as it would go, and 2013 and so on will have more extent , area and volume. Would be great to know. Also, if they could point out why they think that will be the case.
I feel pretty confident that when the 2012 record is broken (likely before 2015), the deniers will claim that they expected that, and it was due to so and so natural cause.
Thus, I would really like the deniers to make a prediction. Will 2013/14/15 see recovery or a new record and why/why not.
The weather last summer was not especially favorable for melt but a record was still set. What if the weather is more favorable for melt this year? I guess 3million km2 for sea ice extent. Hopefully Dr. Meier is right and the melt slows.
As for regression to the mean, keep in mind that ASV minimum has exceeded the previous year exactly once in the last decade. I'm going with 2600 km3 in ASV, 3.9m km2 in extent, and 2.2m km2 in area. Thickness will spend at least 45 days under 1m average (26 days in 2012).
Since we are most likely seeing the developement of increasing positive feedbacks, I expect that the deteriation in ice volume and extent will exceed the statistical estimates. My guess is 3M km2.
The other prediction is more weather extremes for the NH than last year.
I wish I could predict a colapse in public gulibility for contrarian double think but that does seem to be going strong with the majority being only "luke warmers".
Note that the 2012 maximum volume is barely higher than the 1979 minimum volume. Also that the August and October volume figures are just a hair higher than the September minimums... suggesting that if we hit 'zero' volume at some point in September it will likely only be a few years after that before we start seeing 'zero' volume for three months straight.
Note: I put scare quotes around 'zero' because there will always be some small amount of Arctic sea ice which is still attached to land or only recently broken off from land until Greenland completely melts out.
Back in October, I posted at Neven's a set of predictions for extent, area and volume based simply on Gompertz curve extrapolation. The same method worked reasonably well over the previous 2 years, and expecially so for volume. I view this as a rough null hypothesis for comparison with more elaborate physical models.
PIOMAS mean Sep 2013 volume: 3,100 km^3
NSIDC mean Sep 2013 extent: 3.8 million km^2
CT 1-day 2013 minimum area: 2.3 million km^2
Naive Predictions of 2013 Sea Ice
To make a proper prediction, you would have to take into account the environmental conditions, which would be virtually impossible to predict.
But I would like to suggest that, statistically speaking, the curve is more likely to be asymptotic, and would 'level out' as it approaches zero, rather than declining to zero in 2034 as suggested in Cawley's graph.
Given the forces we've set in motion -- past and current emissions, long atmpspheric lifetime of CO2 (the ultimate "inconvenient truth", IMO), unleashing even some of the 1.7 trillion tons of permafrost carbon (not to mention the methane hydrates), etc. -- it's clear that once we start seeing a Blue Arctic every summer, it will be a "permanent" fixture, with the onset and re-freeze dates being theonly thing worth tracking. (Plus CO2 and CH4 emissions from the permafrost, Arctic ocean temps, Greenland melt, ...)
As for what constitutes a Blue Arctic, we could argue endlessly about that, with people preferring any one of numerous plausible, defensible alternatives; I prefer to go with the famous US Supreme Court Justice comment about obsenity: I'll know it when I see it.
Amateur's question, will the forthcoming El Nino have any effect on this summer's ice?
Statistics are wonderful tools, but they have to be used correctly.
Let's ask oursleves why the rate of melt might not flatten out as we approach zero.
1) Most likely the atmosphere and oceans will be warmer each year. And that heat will have less ice to melt, less work to do.
2) Most likely there will be less albedo with each passing year. Shriking extent exposes more water and water soaks up heat rather than reflecting it back out. And with more first year ice there will be a double whammy. First year ice will likely form more melt ponds (heat absorbers). And thinner first year ice lets more sunlight through to the water below.
3) More open water, with shrinking extent, will mean more fetch and increased wave action which will fracture the ice, making it easier to transport into melting temperature water.
4) More open water is likely to lead to more frequent/stronger summer storms which will both damage and transport ice.
All of those things are melt accelerating events.
Then let's ask ourselves why melt rates might slow as we approach the first melt-out.
Class? Anyone? I just don't know any thing that might work to slow melting. It might be that we'll see increased cloud cover which would serve to block incoming sunshine, but I'm not aware that there has been a significant increase to date.
If there is a physical force which will slow the melt it better make its presence known soon.
I'm going with an exponential curve. Actually an exponential curve until right before the end when the line may go verticle. A melt-cliff.
The volume of transport out the Fram Straight is staying about constant even though the ice is thinning. More "extent" is moving through. And it looks like ice is starting to get shoved into the Canadian Archepeligo channels and into melting water as well.
I can see a big wind event during the last ice year which over a short, few day period simply shoves the last ice out. Not saying that will happen. But I find it more likely than the ice mounting a last attempt to hang on to the bitter end.
13, Bob W.,
One possible slowdown -- if the ice were to stay centered at the North Pole, which I don't believe will happen -- is the fact that the closer you get to the pole, the earlier the arrival of winter night. Closer and closer to the pole means less and less time to actually do the melting. That could result in the leveling you think won't happen.
But, as I said, I don't think that will be the case. The ocean currents and other factors clearly tend to migrate and pile the ice along the northern coast of Greenland and the nearby islands. There is no reason to believe that not only will that trend continue, but even accelerate (as it has this winter), due to the thinner, fractured ice being more mobile. That scenario would suggest that "the end" will come even sooner and more quickly.
Remember that the bottom-melt contribution to Arctic sea ice mass losses has been increasing over the past several decades as the heat sequestered in the oceans continue to manifest itself in the Arctic. At 50%+ now, the melt contribution from the oceans has become the full equal of the sun itself. And all the cloudy days in the world cannot stop that.
“The predominant ice circulation pushes ice toward those coasts resulting in thick ice that tends to get replenished.” (Walt Meier)
From what is that ice being replenished? There is nothing to replenish it!
Reality is the ice on those coasts is also getting thinner, while the last shreds of multiyear ice might – just might – survive for another half year.
“There is a principle in statistics known as "regression toward the mean," which is the phenomenon that if an extreme value of a variable is observed, the next measurement will generally be less extreme, i.e. we should not expect to observe record lows in consecutive years.”
This is no principle in statistics, this is only a principle belonging to gaussian distribution statistics and these are NOT applicable here.
“ This is because when extremes are reached and records are broken, a number of different variables generally have to align in the same direction to make this happen. ”
This is not true. Sometimes extremes are reached and records are broken because one single strengthening driver pushes the system that way.
That is the case here (the driver is known as ‘global warming’ and never forget this pertains primarily to the oceans!).
Last year’s extreme Arctic ice low was realized during a summer that was in no way remarkable. There was no ‘alignment of different variables’ as was the case in 2007. Moreover, the year of greatest volume loss, 2010, was no remarkable summer either. Those of us focusing on the Arctic Summer Storm of 2012 should realize first that the ice was already far below record levels before that storm moved in, and secondly that 2010 featured no such storm.
We can realistically start betting on this or one of the coming couple of years for the first ice free Arctic summer. Forget 2034. Really.
/cRR
The arguments for a 'slow down' in ice loss which I have most frequently seen are;
The fact that these arguments contradict each other indicates that at least one of them must fail. Indeed, it seems clear that both are incorrect. The past few years we have seen huge expanses of thick ice just wither away in days once the thin ice barrier between them and open water is gone... that demonstrates both that this thick ice will not hold out for years on end AND that much of the loss has nothing to do with export.
That said, land ice which extends out over the ocean or breaks off into it can be MUCH thicker than ice formed from frozen sea water. That kind of 'former land ice' will remain around for decades after all of the 'sea water ice' is gone. So there WILL be a 'leveling off' at above zero arctic sea ice... it will just be a very small amount above zero.
5.0 km^2
Recovery year.
cRR Kampen writes From what is that ice being replenished? There is nothing to replenish it!".
I am not an expert in the physics of Arctic ice, but my understanding is that new ice forms accross much of the Arctic during winter, and this is steadily pushed throughout the year towards the Canadian archipelago and northern Greenland throughout the year. Even when the Arctic is substantially ice free during the summer, this "stubborn ice" is likely to continue to be sufficiently replenished in the winter to last all summer, even when there is regular shipping across the Arctic.
"This is no principle in statistics, this is only a principle belonging to gaussian distribution statistics and these are NOT applicable here."
This is simply incorrect, regression to the mean ocurrs in non-Gaussian situations as well, although the motivation for regression to the mean is most easily justified by considering what causes a random variable to exhibit a Gaussian distribution (summation of a number of component random variables). If you have a small number of random variables, the sum may not be sufficently Gaussian, but it will still mean that extreme values will be the result of extreme values of the components, and hence you will get regression to the mean.
However, that is a moot point, as Gaussian statistics are appropriate. Both the model that I use, and I strongly suspect that used by Tamino, assumes the errors of the model are normally distributed, and indeed that looks reasonable from analysis of the residuals.
Also, just looking at the data suggests regression to the mean is just what we should expect, extremes in the observations are generally followed by less extreme observations the next year. Every record low in the data set is followed by a higher extent in the following year. Why should 2012/3 be any different?
Note that the minimum in 2012 came very close to being inconsistent with last years projection, being only just within the 95% credible interval, which suggests that last years minimum was a very extreme event judging by the long term trend.
Note "regression to the mean" doesn't mean that the minimum extent this year can't be lower than in 2012, just that "all things being equal" we would expect it not to be lower.
I agree with Walt Meier on this one, the definition of an ice free Arctic is a bit tricky. It will be functionally ice free (i.e. ships can go more or less where they like, significant decrease in summer albedo) in a matter of decades, but it won't be completely ice free for quite a long time afterwards. I am sure skeptics will be claiming that the IPCCs predictions were wrong on these grounds long after shipping regularly passes over the north pole!
Kevin would you like to add error bars to your prediction, so that it can be unequivocally falsifiable?
No one else has, but sure, +/- .1
Kevin, fair point, everybody should give a credible/confidence interval on predictions, rather than a point estimate. Note I actually did give a credible interval, so it isn't absolutely correct to say "nobody else has".
5 km^2 +/- .1 is a very brave prediction indeed (I presume you meant millions of km^2, I don't think anyone is quite that pessimistic! ;o), given the inter-annual variability is about ten times larger than this.
[DM] "... new ice forms accross much of the Arctic during winter, and this is steadily pushed throughout the year towards the Canadian archipelago and northern Greenland throughout the year. Even when the Arctic is substantially ice free during the summer, this "stubborn ice" is likely to continue to be sufficiently replenished in the winter to last all summer, even when there is regular shipping across the Arctic."
This is simply not true: http://i1340.photobucket.com/albums/o728/OlTom67/cryosat_zpsf2aa8e10.gif (borrowed from a comment under http://neven1.typepad.com/blog/2013/02/cryosat-2-reveals-major-arctic-sea-ice-loss.html ).
Why would this trend reverse - especially as the albedo feedback kicks in ever more?
[DM] ]"This is simply incorrect, regression to the mean ocurrs in non-Gaussian situations as well..."
What 'mean'?
There are situations in which 'mean' is meaningless. Cf catastrophe theory, http://en.wikipedia.org/wiki/Catastrophe_theory .
Many examples are given in 'The Black Swan' by Nassim Taleb, http://en.wikipedia.org/wiki/Black_swan_theory .
What does 'mean' mean if you take the mean daily financial volume on Wall Street while knowing that over past half century only ten loose days account for half the total volume of the entire half century and realizing these are the days with true meaning?
What is the mean melting rate of an icicle on the roof - when it includes its sudden moment of dropping off?
[DM] "Also, just looking at the data suggests regression to the mean is just what we should expect, extremes in the observations are generally followed by less extreme observations the next year. Every record low in the data set is followed by a higher extent in the following year. Why should 2012/3 be any different?"
Again, what 'mean'? To answer your question directly, the chance that 2013 will be different is considerable and actually increases every year - momentarily that is - because the drop of the 'mean' which is really a point value accelerates. Guassian reasoning fails here (and actually forces me to write gibberish like 'a mean being a point value').
Another reason to suspect relatively considerable chance of a new record in 2013 is simply the fact the total volume of ice in March 2013 will be smaller (again) than it was in March 2013. There is simply less ice to melt. And more heat te melt it, too.
[DM ]"Note that the minimum in 2012 came very close to being inconsistent with last years projection, being only just within the 95% credible interval, which suggests that last years minimum was a very extreme event judging by the long term trend."
No it was not, it was spot on considering the long term trend, which exhibits accelerating ice loss.
[DM] "Note "regression to the mean" doesn't mean that the minimum extent this year can't be lower than in 2012, just that "all things being equal" we would expect it not to be lower."
But not all things are being equal. This year the ocean-atmosphere system contains more heat than it did last year. This given, plus the fact total ice is less now than it was a year ago can only lead to the expectation next minimum will be lower. Only thing to save this is sheer luck e.g. a cool summer with benevolent stratus and winds.
Kind regards/cRR
cRR Kampen You made an clear error in asserting that regression to the mean applies only to Gaussian situations, but when I explained why that is incorrect, your response was to argue instead that in some situations the mean is irrelevant. While this is technically true, it is also evasion, and I have learned over the years there is little to be gained discussing science where such errors cannot simply be acknowledged.
Perhaps the easiest way to decide would be for you to provide a numerical prediction for NSIDC September extent, with a credible/confidence interval and we can see how our predictions fare.
My statistical approach has fared pretty well for the last couple of years, I see no reason to expect a spectacular recovery suggested by Kevin's prediction, but at the same time I rather doubt that Arctic sea ice will vanish as quickly as you suggest either.
#24, I might acknowledge your reproach of 'evasion' after you have checked my arguments for disposing with the concept of 'mean' in this case, but not before.
Interestingy 'The Black Swan' is much a report dealing with this kind of 'argument' leveled against Taleb all the time by people who do not seem to understand the concept involved.
Your (and Tamino's et al's) statistical approaches have fared pretty well, but we are increasingly looking at a Turkey Syndrome here -> http://www.attaincapital.com/img/newsletters/20111121_Fig1.gif
yes, I did mean in millions. As to why, which is important.
2012 was very low for a number of reasons, one of which was the storm which dispersed ice. Doubt that will happen again like that this year. As I indicated, I believe it will be a recovery year, which happens with some regularity. Couple the two tegether and there is some pressure to be dramatically higher than last year.
Kevin making testable predictions is what science is all about. However, your two arguments both seem to me to be saying more or less the same thing twice. The reason why there are "recoveries" in the observations is essentially "regression to the mean", after an extreme year, you will generally get a less extreme one.
I would however point out that to get back to five million km^2 would require around the largest annual increase in sea ice seen in the satelite record, which seems rather unlikely as the trend in winter sea ice extent/volume are still downwards.
#27 - "The reason why there are "recoveries" in the observations is essentially "regression to the mean", after an extreme year, you will generally get a less extreme one."
What physics is behind this?
There is a severe circularity in this reasoning involving the definition of 'extreme year'. Apart, of course, from the meaning of 'mean' in cases of accelerating trends on dynamical systems.
Kevin, would you care to list the "number of factors" involved in last year's record?
You mentioned only that one storm. It was clear before the storm that the minimum was going to be extremely low, the storm simply made it impossible to not beat the 2007 record. Considering that this record was not beaten but shattered, I doubt that the storm was that much of a factor. That was also the opinion expressed by Zhang and colleagues from UW.
Overall the conditions over much of the season were "a mixed bag" (NSIDC's words). In contrast, 2007 had a perfect combination of melting conditions.
http://nsidc.org/arcticseaicenews/2012/08/a-summer-storm-in-the-arctic/
@Kevin #26
Re your forecast that 2013 will be a recovery year for arctic sea ice and for future reference, do you like your crow baked or broiled?
Last year the Caa opened up and swallowed the MYI that previously had found a safe haven north of there. This year we could have a repeat of this new avenue for advection and melt or this winter's MYI having slid down from above Ellesmere Island may plug the labrinth of channels.
My WAG is that the Caa opens again & that SIA, SIE & volume will all fall below this years minimum. If the Caa opens, Arctic ice will find that the only place of refuge is above Northern Greenland, ballancing between advection through Nares Strait or advection through Fram Strait.
While it's possible that the remaining ice can evade both traps in any one year, at some point an unfavorable wind or current will ship the bulk of it south. I 'd consider lingering year round ice in 2033 much less likely than an ice free period in 2013.
Considering the probability that we'll go into the coming melt season with less volume than last, and that we'll probably have an open Caa like last year, I'd be surprised if any of the metrics were as high as 2012.
Terry
John Hartz:
I don't seem to be able to find your prediction. Is it here?
Phillippe:
Agreed, that was "one" of the other reasons.
Dikran:
I believe we just had exactly that. And no, I don't believe that a record freeze means the downward trend is over. Is was a record freeze becauseit followed a record melt.
@Kevin
So you predict the NSIDC September average northern hemisphere sea ice extent in 2013 will be 5.0+/- 0.1 million square kilometers, right? For future reference, how much lower than that do you think the actual value needs to be to prove beyond reasonable doubt that you are utterly wrongheaded about climate science and that everything you say about it ought to be ignored? Would 4.5 be low enough? Letting you miss by anything less than 5 times your estimated error without considering it proof positive that you're suffering from the Dunning-Kruger effect seems pretty generous to me but maybe you're more forgiving of your own errors than that.
Kevin, see figure 4, there was indeed a record gain in Arctic sea ice this year, but the January sea ice extent was still lower than last year nevertheless, so the trend in winter extent is still downwards.
The fact that the record gain is very likely to be simply due to the record loss last year is exactly why Goddard and Watts are wrong, it is exactly what would be expected, and doesn't signal any kind of recovery of sea ice, because the extent itself is still on the decline even with a record gain.
Djon,
How about 5 times Tamino's error band. That would make it 0.5 to 9.5 million Km^2.
Where is your prediction?
Kevin, I'm sure Tamino would concede that his prediction was falsified if the observations were outside his stated error bars. There is a good reason why Taminos error bars and mine are much broader than yours, which is because that is the basic scale of inter annual variability around the trend.
I suspect Djon was being lenient as the error bars on your prediction are clearly unrealistic, unless there is something fundamental that you know about Arctic sea ice that the rest of us don't know (including the scientists who work on this for a living).
Kevin,
Do I have to have made a prediction for your prediction to be wrong? In school, did you complain to teachers who gave you a bad grade on a test because I hadn't taken the same test? Maybe, unlike you, I'm not overconfident enough to think I can predict the sea ice minimum to within +/- 100,000 square kilometers seven months in advance. Although "overconfident" doesn't seem like the right word since you don't seem willing to stand by your prediction, judging by your apparent desire to expand your error bars from +/-0.1M to +/-4.5M.
Djon,
I did not expand my error bars. the +/- 4.5 is 5 times Tamino's error band. Since you want to place a consequence to my being wrong, I suggested using Tamino's error band. Maybe you would prefer to use his band without multiplication? (5.0 +/-.9) If you wanted to say my error band was nonsensical, just say so.
cRR Kampen, there is no "physics" behind regression to the mean. Regression to the mean is a human perceptual/judgment of the mathematical fact that (by definition of the mean) observations are more likely to be closer to the mean than farther from it. When observations are independent of each other, an observation happening to be far from the mean does not change the probability of the next observation most likely being closer to the mean than farther from it. The human perception/judgment of those two observations is that the second observation moved toward the mean (regressed toward the mean).
Dikran (35):
That is what I was trying to say, it is easy to set a re-freeze record when so much melted previously. The re-freeze record is not indicative of a new trend, as you point out, the new max is still less than the previous max. I was not trying to state otherwise.
Kevin, well quite, which is one of the reasons that your very confident prediction of a record September recovery seems somewhat peculiar.
By the way, in this post, you ducked the question posed by Phillipe here. He asked you to list the "number of factors" [note plural] involved in last year's record other than the storm that had already been mentioned. Pointing out that "that [the storm] was "one" of the other reasons" suggests you either didn't read his post with sufficient assiduity, or that you were being deliberately evasive. Please could you answer the question, so that we can understand your reasons for your prediction.
Personally I'm skeptical of all statistical methods to predict SIA. I say this based on my personal observation over decades of the way ice melts on the lake behind my house. The area of the ice is extremely non-linear during ice melt. During the winter, ice covers 100% of the lake. During spring, as the weather warms, the ice still covers 100%, because it's melting mostly from the bottom up. At some point the edge gives way to open water, and the covered area is 99% to 98%. And then, in about a day, it goes from 97% to zero, as the ice is no longer thick enough to withstand the wind.
We're seeing basically the same fall-off-the-cliff behavior in the Arctic, starting in the Kara Sea and working east. Last year it made it all the way arount to the Beaufort, and it will again this year too (although at even higher latitudes).
If you want to know when summer ice will hit zero, ignore extent and look at the volume. Ice melts from the bottom up.
I'll go with 4.1 +/- 0.9, error bars based on variability, number on crude extrapolation.
Got to ask Kevin - if it goes below 4, what conclusions are going to draw? What sort of data is required to change your mind? At the moment, I would say 5 is "Math You Do as a "skeptic' to Make Yourself Feel Better", and as likely to be as accurate as Rove.
Ok, I'll throw a few cents into the ring, based on a simple polynomial extrapolation (R² = 0.8194).
Dikran,
Some of the other reasons,
1. 2012 was warm
2. 2011 was warm
3. etc
4. Put several years together in a row that were warm and the logical deterioration of the thickness of the ice occurs. Look at the trend for ice volume. All of these things point to a decreasing ice extent, my point was that the storm was a major cause (not saying the only) for it to be lower than expected. Looking at the "professionals'" predictions, they were all above the actual, so obviously they thought the actual was exceptional as well.
Looking at fig2, you can see several recovery years that do recoup a couple of years losses - these do not portend a general recovery of the overall trend - nor am I implying that - look at years 1986,1992,1997,2001,and2006.
#40 Tom, I am aware of that. The question is: what do we mean by 'the mean' here? Obviously we do not mean the 1979-2000 ice extent/area/volume mean for this number has (literally...) no meaning anymore. Therefore expectations based on this regression concept for 2013 running a higher minimum than 2012 are rather gratuit.
As for the discussion on error bars, as of this year one side of such a bar is very easy to place: it is on the zero of the vertical axis.
#43, Keith - that is my point exactly. This is why catastrophe theory applies, and not gaussian thinking. Even my hypothesis on the evolution of arctic sea ice these years is based on the same sort of observations re canal, pond and lake ice.
That hypothesis dates from 2005 and predicted first arctic ice free summer at +10 to +15 years, which means I can seriously fail this year or next.
The prediction was based on the miracle Britain-sized hole appearing in the north of the East Siberian Sea in August '05, in an area where for centuries to many millenia a massive 2-4 metres ice, usually affixed to the Siberian coast including during the minimum, was the norm.
I am actually quite aghast at the amount of underestimation of this process even in (semi-)professional circles.
Kevin,
Following your suggestion, when I look at figure 2 I see:
- 1986 more or less matches your description, apparently fully recouping the loss that occurred in 1984 and 1985.
- 1992 followed a year of recovery not loss, and 1992 alone didn't have a recovery as large as the preceding two loss years, 1989 and 1990, put together
- 1997 was a year of loss rather than recovery. You presumably meant 1996, not that it recouped two immediately preceding years of loss either. If I were in a generous mood, I guess I'd allow that 1996 recouped the two years of loss that occurred in 1989 and 1990, though I don't see how that helps your argument that the losses of last year should be expected to be recouped this year.
- 2001, like 1992, followed a year of recovery. Unlike 1992, it looks as though the 2001 recovery was about the same size as the preceding two years of loss put together.
- 2006 didn't recoup the loss in 2005, let alone the loss of 2004 and 2005 combined
You're failing to convince me that any careful analysis underlies your beliefs about sea ice.