


 Arguments


2014 Arctic Sea Ice Extent Prediction
Posted on 19 August 2014 by Dikran Marsupial
As September is rapidly approaching, I thought I would update my statistical prediction for this years September mean Arctic sea ice extent. I submitted the prediction in July to the Sea Ice Prediction Network, and it seems to be rather lower than the majority of the other predictions (as my prediction is listed as "Cawley"):
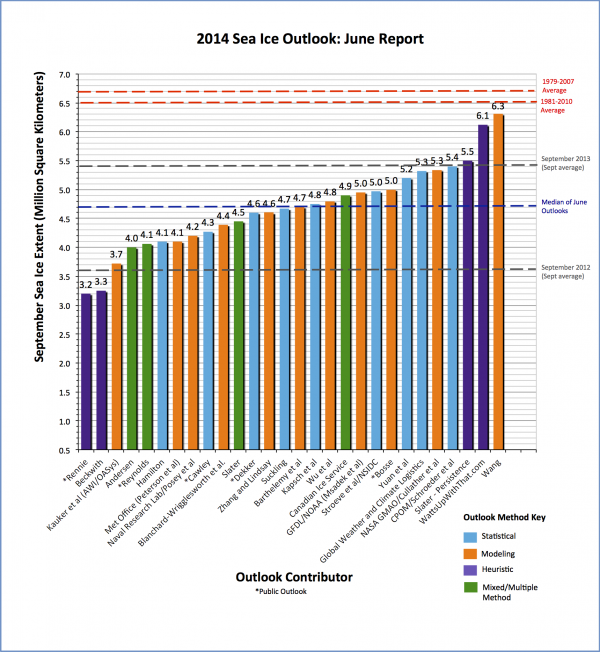
Figure 1. September mean Arctic sea ice extent predictions submitted to the Sea Ice Prediction Network in June 2014.
Last Year's Prediction
Before discussing this year's prediction, lets see how we fared last year. The prediction made last year is shown in Figure 2, and predicted a 2013 September Arctic sea ice extent of 4.1 ± 1.1 million square kilometres. The minimum Arctic sea ice extent of 5.10 million square kilometres was reached on September 13, 2013. Obviously this figure is substantially greater than the prediction, but still lies within the error bars of the projection, and so fits within the range of inter-annual variability considered plausible by the model. The September mean extent was 5.35 million square kilometres, which lies slightly above the credible interval. Note also that the model actually predicts the mean Arctic sea ice extent for the month of September, and so can be expected to somewhat over-estimate the September minimum.
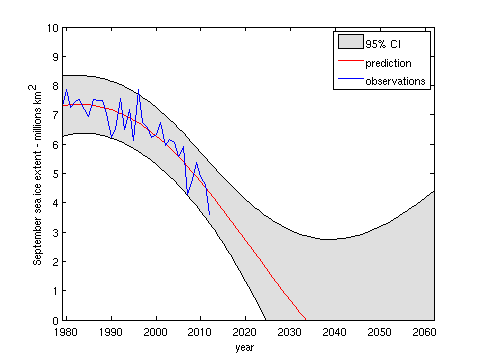
Figure 2. Model prediction for September mean Arctic sea ice extent made in February 2013.
Figure 3 illustrates last year's prediction in comparison with other submissions to the sea ice prediction exercise. My prediction was very close to the median of the submissions, but all but one of the predictions substantially underestimated the actual mean extent. It should be noted however, that some models (such as mine) provide a prediction interval that includes the observed extent.
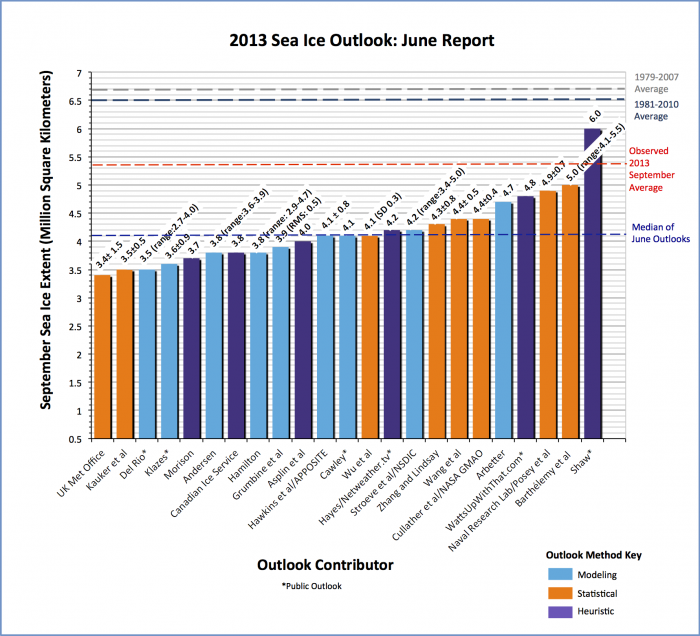
Figure 3. September mean Arctic sea ice extent predictions submitted to the sea ice prediction exercise in June 2013.
This Year's Prediction
The prediction for this years September mean sea ice extent is shown below, the numeric prediction is 4.272 (+/- 1.129) million square kilometres. This is slightly higher than the prediction for 2013, but also the confidence interval is slightly wider. This seems reasonable as last year's surprisingly large minimum extent has a small effect on the overall trend since 1980, and the large variability we have seen in recent years has resulted in broader error bars, suggesting that natural variability may be greater than previously thought.
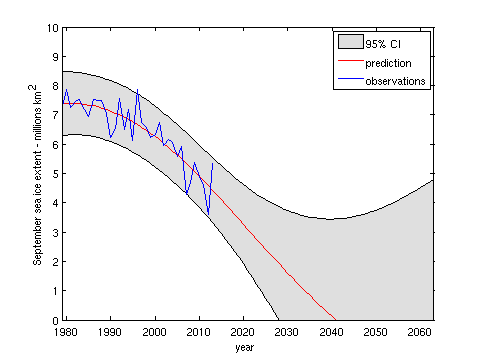
Figure 4. Model prediction for September mean Arctic sea ice extent made in June 2014.
The model predicts that an ice free summer is unlikely prior to 2028, but probable after 2041. However, this is likely to be a pessimistic projection, for the reasons discussed last year.
Caveat Lector
It is important to note that this is a purely statistical prediction, and doesn't take into account any real prior knowledge we have about the physics of sea ice accumulation and loss. I wouldn't regard this as a reliable predictor of Arctic sea ice, but perhaps as a simple baseline for comparison. A brief description of the method is as follows:
"I obtained from data for Arctic sea ice extent from 1979-2009 [2013 for the most recent prediction]...I then fitted a Gaussian process model, using the excellent MATLAB Gaussian Processes for Machine Learning toolbox (the book is jolly good as well). I experimented with some basic covariance functions, and chose the squared exponential, as that gave the lowest negative log marginal likelihood (NLML). The hyper-parameters were tuned by minimizing the NLML in the usual way."
Update: some errors corrected, thanks to billthefrog for spotting them (see comments).


5.35 million square kilometers +/- 1 million
I can't read Figure 4 (it is blank) and a popup keeps asking me for a server username and password to view it.
Monthly average sea ice extent seems to have regressed to the figure given by a linear fit to the historic points, so that is my crude guess, just about 5m km^2 or slightly less.
Any opinion on the "count the early melt pools" method we heard a lot about earlier in the year?
[Dikran Marsupial] Sorry, problem with images should now be fixed, thank you for bringing it to our attention.
Seeing as how JAXA is reporting extent less than 5.7 X 10⁶km2 two weeks before the start of September. the WattsWrongWithThat estimate of 6.1 is already out of the race.
Out of curiosity I have been comparing the NASA daily image set of the 2013 ice extent (in this NASA report), with the Environment Canada daily presentation of Arctic Sea Ice extent (from this web page).
I am not sure if the extent at this time in 2013 was comparable to the current 2014 extent by JAXA shared by rocketeer, but the image comparions seem quite similar in total extent. However, a lot can happen over the next 4 weeks. As with all of these complex climate items, we will have to wait and see what the September average and minimums end up being.
rocketeer the WUWT estimate was the one they submitted for the June round of the prediction exercise, I suspect the predictions submitted in later months were lower. My method only uses the September mean sea ice extent measurements from previous years, so my prediction doesn't change as the Arctic summer progresses.
Having investigated, I don't think WUWT made a submission for July; their August submission of 5.6 million square kilometers is "still in the race", I would be very happy for them to be right, but I think they are being rather too optimistic!
Dikran Marsupial,
rocketeer actually brings up a good point, sort of, what source do you use as your reference/comparisson? JAXA, NSIDC or other?
franklefkin the prediction exercise targets the NSIDC September minimum extent, so I use the NSIDC data to calibrate my model (although I use the mean rather than the minimum).
NSIDC reporting on Arctic Ice extent (here) indicates their expected minimum is between 5 and 5.5 million square kilometers. A range of possible extents from about 5.9 down to about 4.8 based on a variety of projections from the current extent is also presented.
The revised WUWT forecast is indeed still in the race though it is above the upper side of the NSIDC likely range for this year's minimum. But unusual things can and do occassionally happen in the complex climate system of our planet, so we still have to wait to see how this will turn out, and add this year to the total set of information, making no claims based on this year compared to last year.
@ OP
Gavin,
There's a little proof reading problem in the OP, in that Figures 1 & 3 are reversed from the way they are described in the body text.
Also - and please forgive the pun - but I think you're skating on thin ice as regards your characterisation of your model's prediction for last year. My understanding (not that that's saying much) is that all the figures submitted to the SIPN should relate to the mean September figure, rather than the absolute one-day minimum.
The observed figure for the Sept 2013 average was, as shown above, 5.4 million sq kms. (This is, I think, an upward rounding of the 5.35 million sq kms given by the NSIDC.) That being the case, I'm afraid the observed figure did fall outwith your model's error bar range.
I'm usually reticent about criticising the choice of phraseology that people employ (each to his/her own and all that stuff) but one sentence did seriously jangle the nerves. You wrote that...
Note also that the model actually predicts the mean Arctic sea ice extent for the month of September, and so can be expected to somewhat over-estimate the September minimum.
It may not have been your intention, but that sentence sounds as if you were trying to account for some of the divergence between the observed and predicted values. There would be no problem with that if the model had indeed produced an over-estimate, and it was being compared to the absolute daily minimum. If that was the case, it would indeed explain away some, or perhaps even all, of the divergence.
However, since the model produced an underestimate for the monthly average, it doesn't help at all as a mitigating factor in explaining the divergence from the observed one-day minimum. In fact, if you give some thought to the matter, it has quite the opposite effect!
Please note that I'm not in any way suggesting that there is some significant reversal of the decades-long trend in Arctic Sea Ice. Sadly, it is in no way surprising that, in a breath-taking display of revisionism, the lessons regarding the so-called "recovery" between 2007 and 2009 seem to have already been expunged from the collective memory in some quarters.
billthefrog,
Gavin's method uses past September averages to predict a new September average, which then predicts a one day low - hence minimum extent-----I believe. He is obviously better able to describe his method. Given the above, his prediction for last year was just within the bounds.
Billthefrog, thanks for your comments, I'll fix the minor errors when I have a moment (hopefully tomorrow). Last year (2013) the exercise was run by SEARCH, rather than SIPN, and last year, the criterion was the September minimum.
If it is September mean this year, then that means my model is a better fit to the criterion, but the prediction interval is so large I doubt it would make much difference in practice.
I don't see why the sentence
should jangle the nerves, it is just pointing out a known bias in the model, it isn't excusing anything. This is the norm for reporting science, pointing out the flaws and biases in the model. As you can see from the caveat lector at the end, I am not suggesting my statistical model is anything more than a useful statistical baseline, as it does not take into account any of the physics. It also only uses the annual September means, so it is a prediction based on (a little of) what we knew last September. I would be very surprised if it doesn't turn out to be substantially pessimistic.
Note also in recent years the observations have been first at the very bottom of the prediction interval and then at the very top, so this issue doesn't actually help make the model look any more accurate overall anyway! The bias "helps" in some years, and it "hinders" in others, but it is always there.
@ Gavin & Franklefkin,
Hi guys,
Perhaps it might help if we go through this one step at a time. Gavin correctly points out that, in previous years, this exercise was carried out under the Study of Environmental ARctic CHange umbrella (ie SEARCH).
However, I think Gavin is mistaken in the assertion that the criterion requested for 2013 was the daily minimum recorded in September. In the SEARCH background page, it clearly states that...
An integrated monthly report is produced that summarizes the evolution and expected state of arctic sea ice for the September mean arctic sea ice extent, based on the observations and analyses submitted by the science community. (My underlining)
More specifically, the SEARCH Report for June 2013 states...
With 23 pan-arctic Outlook contributions, an increase over the last two years (thank you!), the June Sea Ice Outlook projects a September 2013 arctic sea extent (defined as the monthly average for September) median value of 4.1 million square kilometers, with quartiles of 3.8 and 4.4 million square kilometers (Figure 1). (Again my underlining)
If the submission was made mistakenly thinking that the daily minimum had been sought by SEARCH, then we are into the realms of chalk and cheese. Should this be the case, then the projection of 4.1 +/- 1.1 million sq kms does indeed encompass the observed NSIDC daily minimum of 5.1 million sq kms. (Especialy as NSIDC have, I believe, an uncertainty figure of around 50,000 sq kms.) However, that was not what the SEARCH team was looking for.
On the other hand, if, as Franklefkin suggests, the 4.1 million sq kms daily figure is somehow derived from an intermediate calculation giving the projected monthly average, then we are in the dark as to the value of this hypothesised monthly mean.
A third alternative is that the 4.1 million figure does represent the monthly mean. In that case - barring Snowball Earth and Hothouse Earth intervals - it is impossible, both physically and mathematically, for the daily mean to equal the monthly mean.
Sorry about this guys, but if got to sign off and go exploring ancient ruins on Dartmoor. I will log in again later this evening to explain my "jangling nerves" comment further.
Cheers Bill
billthefrog If you look at the call for contributions, you will find it talk about the September minimum right at the top of the page
but September mean much further down. Presumably that is where the confusion arose, mea culpa (I don't appear to be the only one to make that mistake). Thanks for pointing this out, I'll update the page to reflect this.
What difference does it make? Well not much really, if you have a 95% credible interval (note: it is not a frequentist confidence interval), it means you should expect the observations to lie outside the intervals 5% of the time, even if the model is perfect. If the observations lie very slightly outside the CI they are only slightly more unexpected than if the lie very slightly within. The important thing the model learned from the last two years (where the observations were at opposite ends of the interval) was that it was probably underestimating the variability, which is why the credible interval is a bit wider this year. If you look around 1995, you will see that the observations were outside the CI then, even though that is in the calibration period. This sort of thing does happen from time to time, especially if the model is non-physical - you know it is "wrong" (in the GEP Box sense) a-priori.
Now, nobody is claiming the model is perfect, or even good, just a simple statistical baseline that expert opinion or physical models ought to be able to improve upon.
@ Gavin,
Absolutely no need for a mea culpa. I've been looking at the SEARCH (and now SIPN) stuff for about 5 years, and for the first 12-18 months I thought the same as you - and for exactly the same reason. It was only as I became more familiar with the data, that I realised it had to be the monthly mean which was being used. Largely as a consequence of this confusion, I've tried to drill myself to always explicitly state the time period of a min (or max).
I totally agree with your comments regarding the fact that, whatever the confidence interval selected, there is a gradual transition in the "confidence" of the result. A classic example of this being twisted to nefarious purpose was the loaded question that Phil Jones was presented with in 2010. The case was eloquently described by Dana on the SkS site, with the crux of the matter being the following question and answer...
Q: "Do you agree that from 1995 to the present there has been no statistically-significant global warming?"
A: "Yes, but only just. I also calculated the trend for the period 1995 to 2009. This trend (0.12C per decade) is positive, but not significant at the 95% significance level. The positive trend is quite close to the significance level. Achieving statistical significance in scientific terms is much more likely for longer periods, and much less likely for shorter periods."
When I tried to work out the actual confidence level using the HadCRUT3 dataset, I think it came out at around 93% or 94%, but that's not how it was reported by the usual suspects.
For what it's worth, I tend to omit outliers such as 2007 (and latterly 2012) when trying to "outguess" the Arctic. This strategy wasn't bad in 2010 and 2011, but failed spectacularly in 2012, 2013 and 2014. (No prizes for guessing in which direction I was wrong about each of those years.)
Cheers Bill F
@billthefrog, cheers, hopefully the blog post is better for the editing.
SIPC could use the minimum as the criterion, as I understand that there is daily resolution extent data available, and I did consider modelling the actual minimum instead, but it would have been too time consuming to do it in a statistically interesting way! The model I used was actually just an excuse to play with the GPML toolbox for MATLAB, rather than as a serious exercise; it is interesting that it hasn't done that badly. I was thinking of going back and seeing what the model would have forecast in the earlier rounds of the exercise that I didn't take part in.
I completely agree about the loaded question put to Phil Jones (with whom I have worked on a couple of projects - he is a thoroughly good egg IMHO). The last part of the quote suggests he has a good intuitive understanding of statistical power that is sadly lacking in most of the discussion of the significance of recent trends!
I tend to keep "outliers" in the model, unless I know there is something wrong with the measurements (or there is some other known issue in the data generating process, e.g. a large asteroid hitting the Earth ;o). If you get rid of points that are a long way from the (conditional) mean, then it reduces the apparent variance of the system, and often getting the predicted variance right is very important (one of my research interests).
The confusion about "September Mean Arctic Ice Extent" which is the minimum monthly average, and the "Minimum Arctic Ice Extent" which occurs in September shows how important it can be for everyone to always be talking the same way about an issue.
It would be better if all the exercises and reporting related to minimum Arctic Sea Ice were always about the "Minimum". The NSIDC Reporting seems to mainly present information showing the "Minimum" as in the projected minimums in their latest report on August 19 (here).
p.s. I also find the different baselines used by different global average surface temperature sets to also potentially lead to misunderstanding that can be exploited by someone who deliberately wants to cause trouble. It would be better if all the researchers and reporters agree to adjust their values to always be the anomaly from the pre-industrial value (provided they could all agree on that), and all use degrees C. I know this move to consistency would potentially be exploited by trouble-makers to claim a conspiracy or 'errors being hidden', but their attempts to do so could allow the scientific community and its supporters to collectively and consistently point out the deliberate trouble-makers to the general population.
OPOF There are good statistical reasons for trying to predict the mean (for example, it more obviously justifies the statistical assumptions of least-squares based regression methods), rather than the minimum, so it is a sensible thing to do. While there is a good deal of media interest in the minimum daily value, I suspect the September mean is of more scientific interest, I suspect the difference between the two is well in the noise as far as long term evolution of Arctic sea ice is concerned. As my model shows, the previous years September extent is not that good a predictor of next years September extent, too much depends on the Arctic weather over the year.
Personally I reckon there's a potential sting in the tail of the 2014 Arctic sea ice melting season that no amount of statistics can cater for:
http://GreatWhiteCon.info/2014/08/the-arctic-surf-forecast-for-late-august-2014/
For the science behind that slightly surreal assertion see also:
"Swell and sea in the emerging Arctic Ocean"
That's an interesting idea, Jim, one of those things that seem so obvious once recognized. It seems hard to imagine how large increases in fetch won't contribute to destruction of ice, leading to yet more fetch.
5.35 million sq km looks to be a winner!
franklefkin,
5.35 will be very close, but is likely to be a little high.
The NSIDC interactive chart (here) shows the following Arctic 2014 ice extents (for the area with 15% or more sea ice):
So, with the ice extent likely to continue to decline a few days past the middle of September, the September average is very likely to be lower than 5.35. It may even be lower than 5.2.
Also, the September 14th extent is lower than the minimum 2013 extent (5.101). So 2014 is already the 5th lowest minimum extent in the record. But it is unlikely to reach 4th place (4.626 - September 22, 2010).
Looks like about 5.2 for the September average. So most predictions were low, and many of them significantly low.
My oops about this being the 5th lowest. I didn't count the dashed line of 2012 on the NSIDC interactive chart.
It would appear that predicting annual values needs much more reliable prediction of many difficult to forecast factors. Like many other climate related things, the longer term trend is much easier to predict.