A new resource - high rez climate graphics
Posted on 14 December 2010 by John Cook
Graphics used in science communication are often complicated and overburdened with details, trying to provide as much information as possible. But when you're communicating science to a broad audience, your visuals need to contain just the bare minimum required to get the message across. Cram too much detail in there and your meaning can get lost in a sea of factoids. So often when I scratch around for good climate graphics to communicate the required message, I can't find anything simple enough and am forced I create my own. As the number of visuals at Skeptical Science have built up over time, I often get asked for high rez versions for powerpoint presentations or print publications. Especially since The Scientific Guide to Global Warming Skepticism was released. So to make things easier for everyone (and let's be honest, to save me time in the long run), I've created a new resource: Climate Graphics by Skeptical Science, featuring high rez versions of the original graphics created at Skeptical Science.
All the graphics are licensed under a Creative Commons Licence so everyone is welcome to use them in any non-commercial use (and for commercial use, just contact me for permission). For each graphic, I've included a JPEG typically 1024 pixels wide, suitable for use in Powerpoint presentations. For those printing on paper, I've included Window Metafiles. These are in vector form so they print at high resolution at any size (yep, a Skeptical Science graphic would look great on a billboard). I'll also try to include Excel spreadsheets of the data and links to the data sources whenever possible (e.g. - if I'm not too busy and can be bothered).
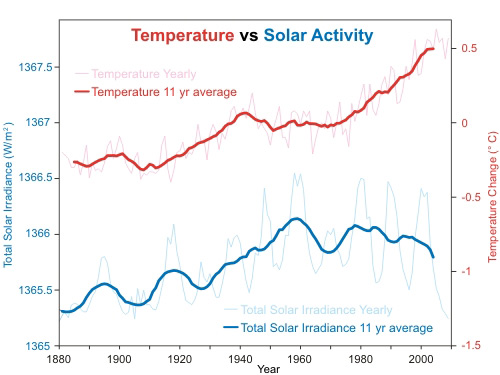
So far, I've only uploaded a handful of graphics - the easier ones that I had lying around in a handy format. I slightly reformatted the Solar Activity vs Global Temperature graph and added some details on where the data came from. The spreadsheet also includes all the raw data:
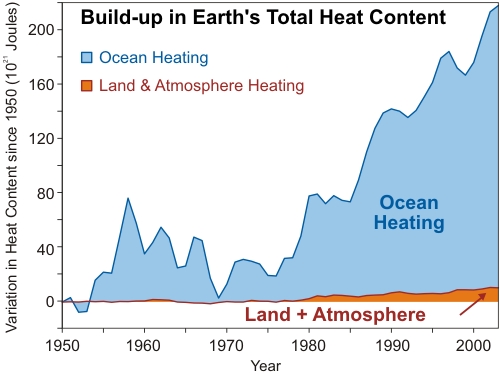
Similarly, when uploading the Total Heat Content graph, I also included some details on where the data came from (I often get asked about this) and also uploaded the spreadsheet (note - the Excel spreadsheet has slightly different formatting to the final version - I did some visual tweaking after exporting from Excel):
I plan to add more graphics steadily over time. When putting together The Scientific Guide to Global Warming Skepticism, I finally figured out how to export graphs from Excel into vector format (by printing to a PDF) so I'd like to go through all my old graphs and create nice sharp, Windows Metafile versions.
I may also set up a feature allowing Skeptical Science translators to add translated versions of each graphic - that'll come in version 2 :-)

Arguments


Bob
http://www.skepticalscience.com/solar-activity-sunspots-global-warming.htm
We know the science concerning CO2 and the greenhouse effect. It matters not whether the current level of CO2 was human in origin or caused by the ravenous bug blatter beast of Traal. What really matters is that we from now on do whatever we can to reduce CO2 emissions. We could shoot the aforementioned beast, if we can find it, but even if we do, we had better cut down on our production. To not take action is akin to refusing to steer round an iceberg on the basis that we humans did not make it.
Florence Nightingale changed British hospitals as a result of one simple diagram (and a lot of campaigning).
http://www.esrl.noaa.gov/gmd/ccgg/trends/history.html
This is the standard vector format for the Internet Age.
I tried UniConvertor, http://sk1project.org/modules.php?name=Products&product=uniconvertor
on the WMF file. It works, but it loses the text of the graphs.
Can you export to SVG from your application?
It's a free open source drawing package.
A couple of options.
Based on my calculations, the energy gain of the earth has been the equivalent of detonating 52 Million x 1 Megaton atomic bombs. That is 100 x 1 Megaton atomic bombs every hour, for the last 60 years.
Another way of looking at it is that over 60 years, the planet has been warmed by the energy equivalent of 62x of the output all of the world's power plants (2010 power plants), operating for 60 years.
DOE says total worldwide electricity generation in 2010 was 16,385 Billion Kwh.
My calculations:
1 joule
0.0002778 watt hours
1.00E+21 joules
2.78E+17 watt hours
2.20E+23 Joules total earth energy gain
6.11E+16 KWh
60 years
525600 hours
1892160000 seconds
1.16E+11 kW net gain (assuming linear over 60 years)
1.6358E+13 Annual electrical energy production Kwh (per DOE)
1,867,351,598 Electrical power generation worldwide KW (average)
62.27 Energy gain of planet vs current electricity production
1 Megaton atomic bomb
4.184E+15 Joules
5.26E+07 Atomic bombs energy equivalent
1.00E+02 Atomic bombs every hour over 60 years
~~ 5.6 × 2003 estimated energy in world's total fossil fuel reserves (~~ 3.9×10^22 J )
Perhaps John Cook could explain how it is possible for the temperature record to be broadly flat between 1950 and 1975 and the OHC content to rise to 80E21 Joules aro 1958 and disappear without trace by 1970 only to pop back to 80E21 by 1980? Given the huge thermal mass of the oceans - such rates of transfer are well nigh impossible - and do not fit with the generally increasing theoretical forcings from CO2GHG and elevated solar irradiance (since 1920 at least).
If your answer is the 'Clean Air Act' please then explain why the IPCC charts show cooling from sulphates steadily increasing up to aro 1970 and then flatlining up to the present.
ANTARCTIC MELTING AS DEEP OCEAN HEAT RISES
It'll be an interesting read when it makes it's way into the peer-reviewed literature.
Maybe the author should compare notes with Josh Willis whose latest information was that there was not much warming in the deep oceans (less than 0.1W/sq.m).
If there is a large amount of 'up and down welling' then you would expect that CO2 as well as heat would be transported and well mixed in a vast volume of water. Such vast mixing of CO2 would result in an infinitesimal change in pH (acidification). There are plenty of claims of significant acidification of the upper layers of the oceans which does not fit with large flows of water to the deep.
I'd like to see one illustrating time scales. When people say (correctly) that the climate has always changed, they seem to imagine that humans have been around to see multiple ice ages, sea level fluctuations, and 1000 ppm CO2 around 55 Myr BP. From our human time scale (one lifetime each) it's hard to grasp the difference between 1000 and 1,000,000 yrs, let alone imagine 55 Myrs.
I remind people that civilization really only started with the invention of beer 10,000 yrs ago. So any climates before that are beyond human experience.
John, I'd hate to be the one to point out the fly in the ointment but there may arise an issue of authenticity. If we were to "redo" charts and graphs we will be accused of cooking (No pun intended.) the charts by our beloved 'skeptics'.
I realize that our intent is not to convince the inconvincible 'skeptics' but we have to keep in mind that our target audience will be weighing both arguments and could, due to their ignorance, be easily sidetracked by spurious arguments.
I personally would prefer, to the best extent possible, to keep charts, graphs, etc. in their original state and then explain to my target audience what they should focus on and what they could safely ignore.
The correspondence between temperature and greenhouse gases levels is striking, and provides vivid evidence of the greenhouse effect. However, this is somewhat lost in the current Wiki plot. Is anybody prepared to have a go at it?
See Image: Vostok 420ky 4 curves insolation.jpg