


 Arguments


Does ocean cooling prove global warming has ended?
What the science says...
| Select a level... |
 Basic
Basic
|
 Intermediate
| |||
|
Early estimates of ocean heat from the Argo showed a cooling bias due to pressure sensor issues. Recent estimates of ocean heat that take this bias into account show continued warming of the upper ocean. This is confirmed by independent estimates of ocean heat as well as more comprehensive measurements of ocean heat down to 2000 metres deep. |
|||||
Oceans are cooling
“Ocean heat touches on the very core of the AGW hypothesis: When all is said and done, if the climate system is not accumulating heat, the hypothesis is invalid.
[…]Now that heat accumulation has stopped (and perhaps even reversed), the tables have turned. The same criteria used to support their hypothesis, is now being used to falsify it.” (William DiPuccio)
The paper Cooling of the global ocean since 2003 (Loehles 2009) looks at ocean heat content as measured by Argo. Argo is a network of over 3000 floats scattered across the globe that measure temperature and salinity of the upper ocean. Loehles finds a cooling trend from 2003 to 2008.

Figure 1: Heat content smoothed with 1-2-1 filter and overlaid with linear trend portion of best-fit model (slope = -0.35 x 10²² J/yr)
As oceans contain around 80% of the climate's total energy, ocean heat is a good measure of what's happening with our climate. So recent ocean cooling has led some to conclude that global warming has stopped. Probably the most articulate article is The Global Warming Hypothesis and Ocean Heat by William DiPuccio. His logic is as follows:
- The anthropogenic global warming hypothesis says ocean heat should increase fairly steadily and uninterrupted (monotonic), barring any volcanic eruptions
- The ocean has been cooling since 2003
- Therefore, the anthropogenic global warming hypothesis is either false or fundamentally inadequate
Let's examine points 1 and 2 in more detail.
1. Does ocean heat monotically increase from year to year?
If the climate is steadily accumulating heat, does this mean the ocean heat content will also show a monotonic steady trend? To answer this, we need to view observations of ocean heat content over the past 40 years.
Figure 2: global ocean heat from 1955 to 2008. Blue line is yearly ocean heat content for the 0–700 m layer (Levitus 2009). Red line is the global mean stratospheric optical depth, indicating the timing of major volcanic eruptions (NASA GISS, data ends in 1999).
The longer record reveals short term variability amidst the long term warming trend. Volcanic eruptions (indicated in red by the stratospheric optical depth) impose a short term cooling influence of several years. But there is also variability due to cyclic effects such as El Nino. It's not unusual for the warming trend to slow or even show cooling over several years. More on what causes short term ocean cooling...
2. Has the ocean been cooling since 2003?
Ocean heat is directly measured by buoys that sink through the ocean, measuring water temperature at different depths. The most comprehensive system is the Argo network which was gradually deployed from 2003 through to 2007, with 3388 floats now spread throughout the globe.
There have been early difficulties in measuring ocean heat. Expendable bathythermographs, or XBT's, measured ocean temperatures before the Argo network was deployed. XBT's have been found to introduce a warming bias so when the warmer XBT data was combined with the later Argo data, the most recent trend showed exagerated cooling (more on that here). In addition, some Argo floats have had pressure sensor issues which impose a further cooling bias.
Loehles 2009 uses a reconstruction of Argo data by Josh Willis (Willis 2008). Another analysis of the same raw Argo data was performed by Leuliette 2009 - a comparison of Willis 2008 and Leuliette 2009 can be found in Figure 3:
Figure 3: Monthly variations in global mean steric sea level computed by Willis 2008 (gray line) and Leuliette 2009 (black line).
Willis 2008 shows a cooling trend since 2004, while Leuliette shows a warming trend. The primary difference between the two is found early in the Argo record, when there were fewer Argo buoys deployed. Leuliette 2009 suggests the discrepancy between the two seems to be due to poor sampling and differences in how the data was handled. But which dataset is more accurate?
When confronted with two papers offering different results, a useful referree is an independently determined dataset. As well as using Argo data, Cazenave 2009 creates two independent estimates of ocean heat. Sea level rise is comprised of two components: mass change due to melting ice and steric sea level rise due to changes in ocean density. Thermal expansion is the main driver of steric changes (salinity is also a minor factor) so steric sea level rise is another measure of total ocean heat.
The first reconstruction uses satellite gravity measurements to calculate the change in ocean mass. They then subtract ocean mass sea level rise from total sea level rise to calculate the steric sea level rise. The second reconstruction uses satellite gravity measurements to calculate the change in mass of land ice and land water. The sea level rise from this contribution is subtracted from the total sea level rise to obtain another estimate of steric sea level rise. Both reconstructions show a statistically significant warming trend.
Argo offer two data streams - real time where the data is available almost instantaneously and delayed which undergoes more rigorous checks. Cazenave uses only measurements with the highest quality control settings (an approach the folk at Surfacestations would surely approve of). The Argo trend closely matches the other two reconstructions.
Figure 4: Three reconstructions of steric sea level, with seasonal element removed. Blue curve estimated from the difference between altimetry and GRACE-based ocean mass. Green curve estimated from the difference between satellite altimetry and total land ice plus land waters contribution. Red curve: ARGO-based estimate (Cazenave 2009).
In climate discussions, the most common error is focusing on a single piece of the puzzle while ignoring the big picture. The ocean cooling meme commits this error twofold. Firstly, it scrutinises 6 years worth of data while ignoring the last 40 years of ocean warming. Secondly, it hangs its hat on one particular reconstruction that shows cooling, while other results and independent analyses indicate slight warming.
The bottom line is there is still uncertainty over the reconstruction of ocean heat. Generally, the various reconstructions show the same long term trends but don't always agree over short periods. The uncertainty means one cannot conclude with confidence that the ocean is cooling. Independent analysis seem to indicate that over last half dozen years, the ocean has shown less warming than the long term trend but nevertheless, a statistically significant warming trend.
Last updated on 15 October 2016 by John Cook. View Archives

 Well, if ISCCP data are considered reliable, nothing like that has happened. There was a sharp decrease of some 4 W m-2 in net incoming flux at TOA between 2000 and 2002. Since then it is practically flat. Therefore reconstruction of OHC history before ARGO is suspect.
Sometimes you should use your own head. No amount of peer reviewed literature could save you that effort.
#87 Riccardo at 06:43 AM on 5 April, 2010 in same thread wrote:
"you're dangerously falling into a grim denialism. You do not bother to verify you claims and let other people do the dirty job to make your denialism apparent. It's a bit boring"
Now. I kindly request our host to comment on this attitude. According to the site's Comments Policy "Comments using labels like 'alarmist' and 'denier' are usually skating on thin ice". A couple of other points come to mind as well. John, I would rather not ask you to delete that comment, as it also includes a false claim I'll comment on shortly, but it definitely deserves one of those green boxes.
#87 Riccardo at 06:43 AM on 5 April, 2010
"Your claim about the jump in the deployment of Argo floats in 2003 which you immagine is the cause of the jump in OHC is blatantly false. Check youself (pag.4)."
Riccardo, you are referring to this image:
Well, if ISCCP data are considered reliable, nothing like that has happened. There was a sharp decrease of some 4 W m-2 in net incoming flux at TOA between 2000 and 2002. Since then it is practically flat. Therefore reconstruction of OHC history before ARGO is suspect.
Sometimes you should use your own head. No amount of peer reviewed literature could save you that effort.
#87 Riccardo at 06:43 AM on 5 April, 2010 in same thread wrote:
"you're dangerously falling into a grim denialism. You do not bother to verify you claims and let other people do the dirty job to make your denialism apparent. It's a bit boring"
Now. I kindly request our host to comment on this attitude. According to the site's Comments Policy "Comments using labels like 'alarmist' and 'denier' are usually skating on thin ice". A couple of other points come to mind as well. John, I would rather not ask you to delete that comment, as it also includes a false claim I'll comment on shortly, but it definitely deserves one of those green boxes.
#87 Riccardo at 06:43 AM on 5 April, 2010
"Your claim about the jump in the deployment of Argo floats in 2003 which you immagine is the cause of the jump in OHC is blatantly false. Check youself (pag.4)."
Riccardo, you are referring to this image:
 First things first. I have not claimed there was a jump in deployment. What I did claim, there is a jump in OHC reconstruction and at the same time instrumentation went through a huge change.
However, as you may notice, there is indeed a jump in Pacific ARGO deployments during 2003.
First things first. I have not claimed there was a jump in deployment. What I did claim, there is a jump in OHC reconstruction and at the same time instrumentation went through a huge change.
However, as you may notice, there is indeed a jump in Pacific ARGO deployments during 2003.

 This jump is due to lack of ARGO floats in southern Pacific (to a lesser extent in southern Atlantic as well) during early 2003. The gap was filled in by December 2003, but it took another four months to get a reasonable distribution by random drift.
As for the number of active ARGO floats, it went like this:
2002-04 465
2003-04 797
2003-07 832
2003-08 860
2003-12 1023
2004-04 1158
2004-07 1257
2004-11 1500
2005-04 1788
2005-05 1871
2006-05 2451
2006-11 2743
2007-11 3070
2008-05 3111
2009-07 3319
The histogram shows the annual number of profiles collected, the blue line is the number of active floats.
This jump is due to lack of ARGO floats in southern Pacific (to a lesser extent in southern Atlantic as well) during early 2003. The gap was filled in by December 2003, but it took another four months to get a reasonable distribution by random drift.
As for the number of active ARGO floats, it went like this:
2002-04 465
2003-04 797
2003-07 832
2003-08 860
2003-12 1023
2004-04 1158
2004-07 1257
2004-11 1500
2005-04 1788
2005-05 1871
2006-05 2451
2006-11 2743
2007-11 3070
2008-05 3111
2009-07 3319
The histogram shows the annual number of profiles collected, the blue line is the number of active floats.
 Compare the distributions above to current status:
 It is only the Number 5 December 2004 issue of Argonautics Newsletter that declares:
"Uses of Argo data
Perhaps the most important feature is that the array is now global and this permits us to start to address important scientific issues and to make the data useful to operational centres"
You can see how sparse OHC data really are prior to ARGO:
It is only the Number 5 December 2004 issue of Argonautics Newsletter that declares:
"Uses of Argo data
Perhaps the most important feature is that the array is now global and this permits us to start to address important scientific issues and to make the data useful to operational centres"
You can see how sparse OHC data really are prior to ARGO:
 All other sources of OHC data also diminished dangerously by the year 2002. It is slide 6 in the Leviticus presentation:
 Caption: The number of 4°x2° boxes that meet the observation criteria as a function of time for both MBT and XBT comparisons based on computations from WOD data.
 Figure S9 from Levitus et al. 2009. Yearly time series of ocean heat content (10E+22 J) for the 0-700 m layer from this study and from Domingues et al. [2008] and Ishii and Kimoto [2008]. Linear trends for each series for 1969-2008 given in the upper left portion of the figure. Reference period is 1957-1990.
You still haven't given any evidence that pre-ARGO OHC data are "unreliable". Since that claim contradicts the results of multiple peer-reviewed studies showing long-term increases in OHC, one would demand very convincing evidence, but you provide no evidence at all, merely assertions.
I think we can conclude that the oceans have in fact been warming over the past half-century. This should be no surprise, since oceans cover more than half the planet, and the surface and atmosphere are also warming.
Figure S9 from Levitus et al. 2009. Yearly time series of ocean heat content (10E+22 J) for the 0-700 m layer from this study and from Domingues et al. [2008] and Ishii and Kimoto [2008]. Linear trends for each series for 1969-2008 given in the upper left portion of the figure. Reference period is 1957-1990.
You still haven't given any evidence that pre-ARGO OHC data are "unreliable". Since that claim contradicts the results of multiple peer-reviewed studies showing long-term increases in OHC, one would demand very convincing evidence, but you provide no evidence at all, merely assertions.
I think we can conclude that the oceans have in fact been warming over the past half-century. This should be no surprise, since oceans cover more than half the planet, and the surface and atmosphere are also warming.
 The huge divergence between reconstructions in 2003-2004 is clearly noticeable. If such problems occur in recent years, why would one believe any of it?
Also, the choice of 1969-2003 as reference interval is nothing else but cherry picking.
The huge divergence between reconstructions in 2003-2004 is clearly noticeable. If such problems occur in recent years, why would one believe any of it?
Also, the choice of 1969-2003 as reference interval is nothing else but cherry picking.
 Anyway. Even by eyeballing (and disregarding lack of significance) the trend between 1959-2001 is 0.2 × 10²² J/year perhaps. It translates to a 0.12 W/m2 net "forcing" at TOA on average during this 42 years long interval.
On the other hand according to the Mauna Loa record, CO2 has increased from 315.98 ppmv to 371.07 ppmv. If we accept the estimated sensitivity of 3.7 W/m2 for carbon dioxide doubling given in IPCC AR4 WGI 2.3.1 as a reference point, it should mean a 0.86 W/m2 increase in "forcing" by the year 2001 relative to 1959.
Log CO2 being almost linear, average should have been 0.43 W/m2. More than 70% of it is nowhere to be found. And not even feedbacks are taken into account yet. With them the effect measured is barely more than 10% of the radiative imbalance projected by IPCC.
The artificial jump of 2003 introduced by Levicus at al. would not improve the situation much. It would make the figure above 15-20% perhaps (of expectations based on mainstream climate science).
Either OHC history reconstructions are useless or theory misses some strong negative feedback.
Anyway. Even by eyeballing (and disregarding lack of significance) the trend between 1959-2001 is 0.2 × 10²² J/year perhaps. It translates to a 0.12 W/m2 net "forcing" at TOA on average during this 42 years long interval.
On the other hand according to the Mauna Loa record, CO2 has increased from 315.98 ppmv to 371.07 ppmv. If we accept the estimated sensitivity of 3.7 W/m2 for carbon dioxide doubling given in IPCC AR4 WGI 2.3.1 as a reference point, it should mean a 0.86 W/m2 increase in "forcing" by the year 2001 relative to 1959.
Log CO2 being almost linear, average should have been 0.43 W/m2. More than 70% of it is nowhere to be found. And not even feedbacks are taken into account yet. With them the effect measured is barely more than 10% of the radiative imbalance projected by IPCC.
The artificial jump of 2003 introduced by Levicus at al. would not improve the situation much. It would make the figure above 15-20% perhaps (of expectations based on mainstream climate science).
Either OHC history reconstructions are useless or theory misses some strong negative feedback.

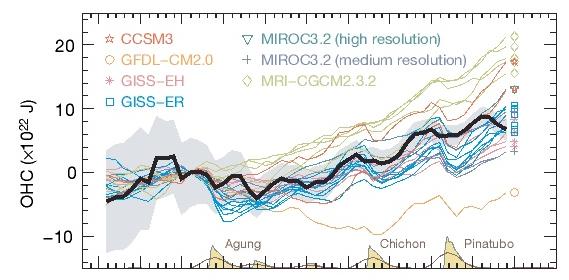 That seems to show their observations falling nicely in the middle of the ensemble of models, which is hard to reconcile with a trend that's only 24% to 41% of what would be predicted from forcings. Unfortunately at the moment Nature's website seems to be down so I'll have to go back and reread Domingues later to see how they explain this.


Climate Myth...