Climate Science Glossary

Term Lookup

Enter a term in the search box to find its definition.

Settings

Use the controls in the far right panel to increase or decrease the number of terms automatically displayed (or to completely turn that feature off).

Term Lookup

Settings


All IPCC definitions taken from Climate Change 2007: The Physical Science Basis. Working Group I Contribution to the Fourth Assessment Report of the Intergovernmental Panel on Climate Change, Annex I, Glossary, pp. 941-954. Cambridge University Press.

Home Arguments Software Resources Comments The Consensus Project Translations About Support

Twitter Facebook YouTube Mastodon MeWe

RSS Posts RSS Comments Email Subscribe


Climate's changed before
It's the sun
It's not bad
There is no consensus
It's cooling
Models are unreliable
Temp record is unreliable
Animals and plants can adapt
It hasn't warmed since 1998
Antarctica is gaining ice
View All Arguments...


Username
Password
New? Register here
Forgot your password?

Latest Posts

Archives

Have American Thinker disproven global warming?

Posted on 22 February 2010 by John Cook

American Thinker have published an article The AGW Smoking Gun by Gary Thompson who claims to disprove a key component of anthropogenic global warming. The article begins by stating "...it seems that the only way to disprove the AGW hypothesis is to address problems with the science". This is a fair statement and a return to an emphasis on science in the climate debate is most welcome. So have American Thinker discovered a flaw in climate science that has escaped the attention of the world's climate scientists? Let's examine Thompson's article to find out.

Thompson looks at several peer-reviewed analyses examining satellite measurements of outgoing longwave radiation. As greenhouse gases increase in the atmosphere, they should trap more outgoing longwave radiation. This leads to a build-up of heat in our climate. It also means less longwave radiation escaping to space. The idea is explored in An observationally based energy balance for the Earth since 1950 (Murphy 2009) . Imagine this simplified thought experiment. The earth is in energy balance - incoming sunlight equals Outgoing Longwave Radiation (OLR). There's a sudden increase in CO2. OLR suddenly drops and the planet is in positive energy imbalance. The planet accumulates heat. A hotter object radiates more energy so OLR increases. Eventually OLR increases to the point where it again matches incoming sunlight and the planet is in equilibrium.  

Thompson looks at the several papers that compare satellite measurements from the 1970s to 1996 and later. The first paper that performed this analysis was Harries 2001. Thompson posts a graph from that paper that compares outgoing longwave radiation over the central Pacific from the 1970s to 1996. The black line is the outgoing longwave spectrum in 1970. The grey line is the outgoing spectrum in 1996.

IMG vs IRIS satellite measurements of outgoing longwave radiation
Figure 1: Observed IRIS and IMG clear sky brightness temperature spectra for the central Pacific (Harries 2001).

Thompson concludes "After analyzing this graph, the following conclusion can be drawn: The 1997 OLR associated with CO2 is identical to that in 1970". By "analyzing this graph", he presumably means eyeballing the graph as he provides no actual data analysis. This is a shame because in Harries 2001 directly below this graph is data analysis of the calculated difference between the IMG and IRIS satellite data as well as a comparison with modelled results. What do models predict will happen with rising greenhouse gases? Less longwave radiation will escape at the absorptive wavelengths of greenhouse gases such as carbon dioxide and methane. As the atmosphere warms, it will emit more radiation over the whole longwave spectrum. So we expect to see an increase in outgoing radiation over some of the longwave spectrum with sharp drops at certain wavelengths. This is indeed what is observed, consistent with model simulations.


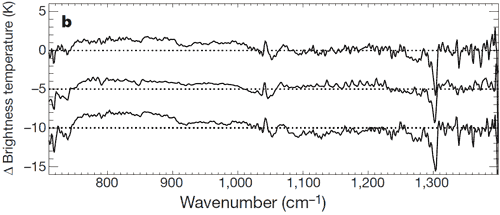
Figure 2: Observed difference between 1970 to 1996 over the central Pacific (top). Simulated difference over the central Pacific (middle). Observed difference for 'near-global' - 60°N to 60°S (bottom) (Harries 2001).

The top curve in Figure 2 is the observed difference between 1970 and 1996 over the central Pacific. This shows strong agreement with the middle curve which is the modelled results. The bottom curve is the observed difference for a near-global area. Observations are consistent with our theoretical expectations of how the greenhouse effect should behave. The close match between observation and simulation lead the paper's authors to conclude "Our results provide direct experimental evidence for a significant increase in the Earth's greenhouse effect that is consistent with concerns over radiative forcing of climate". One wonders how Gary Thompson missed this conclusion as it's stated both in the paper's abstract and in the concluding paragraph.

There is much else that can be gleaned from Figure 2. Interestingly, the near-global observations show a greater drop in outgoing longwave radiation at the CO2 wavelengths around 700 cm-1 compared to the change over tropical regions. Does this indicate the change in greenhouse effect is greater at higher latitudes? It's also worth noting that the data doesn't cover the entire longwave spectrum as CO2 absorption below 700 cm-1 is not shown.

So what do we learn from the American Thinker article. Thompson cites peer-reviewed papers but his analysis consists of eyeballing graphs while spurning the peer-reviewed data analysis. This approach leads to the opposite conclusion of the papers' authors. I first encountered Harries 2001 when documenting the empirical evidence for an enhanced greenhouse effect. After reading the paper, I had many questions. Rather than let the gaps in my understanding lead me to think I knew more than the authors, I emailed my questions to the lead author John Harries, an approachable scientist who was forthcoming with prompt and detailed replies. The American Thinker article does not disprove the enhanced greenhouse effect. It does however provide further evidence for the Dunning-Kruger effect.

0 0

Printable Version  |  Link to this page

Comments

1  2  3  Next

Comments 1 to 50 out of 101:

  1. "Therefore, the AGW hypothesis is disproven." If only it were that simple.
    0 0
  2. Think the first word in your title should be Has, not Have, John, but more to the point - the statistical technique of "eye-balling graphs" is such a common feature of denier science that we could begin calling them "Eyeballers".
    0 0
  3. Now this is just embarrassing. The "skeptics" continue to let the blind lead the blind.
    0 0
  4. eyeballing + accurately choosen graph = demonstrate almost anything Try yourself, is a funny game to play with friends.
    0 0
  5. Nice article. Most people have only the haziest notion of what radiative effects take place in the atmosphere. So any story sounds plausible. In fact, lay out the actual basic facts of longwave upwards and downwards flux at the surface and at top of atmosphere and there will be a lot of people telling you that you are wrong, the numbers are wrong, it breaks the laws of physics, you are mixing up shortwave radiation, and so on.
    0 0
  6. I'd be interested in your questions to the author and his replies mainly because if there is a small critisism I have of your presentation of publications that support AGW it's that you under-represent the limitations of the work. For my part there would be a couple of questions. 1) Figure 2 also has a third graph (c) which shows CO2 absorption around 970cm-1 but there appears no difference in the 1970 and 1996 data. Is this an issue? 2) I'd just query whether you too are seeing what you wish to see in the same way that the American Think guy is. On the 2b graph you state that the top and middle graphs show strong agreement. Are you making this statement based on eyeballing the graphs? Because in the 700cm-1 region the observed difference seems smaller than the modelled difference for the central pacific. 'Observed - model' would be useful here because deviation from the model actually looks significant at the important 700cm-1 wavelength compared which much of the rest of the graph. 3) Is there any problem associated with a ten-fold difference in the data points from 1970 and 1996? While they describe the process for discarding unreliable data and state the absolute numbers of data points used for each time point they don't state what % of data is thrown away for each time point. Is the tenfold difference due to data collection or data rejection? If you are rejecting 50% of the 1996 data but 95% of the 1970 data you'd have to worry what effect this is having on results. 3) Given that the author makes the following statement "But this relationship is complicated by several feedback processes - most importantly the hydrological cycle - that are not well understood" And the author also aknowledges that changes in atmosperic ice would give a result indistinguishable from the observed results shouldn't there be a huge rider on the interreptation of the results. Since H2O has to be ignored in this and it is the most potent greenhouse molecule shouldn't the conclusion just be that we are unable to rule out CO2 having a greenhouse effect and save final judgement for when we do better understand the role of water in all of this?
    0 0
    Response: Here are the questions I sent (italic) and John Harries' responses (JH). Very prompt and very detailed, he's a class act:

    JC: I was curious as to why the comparisons of spectra only went down to 700cm-1 when the IMG data went down to 600cm-1. It seems there would be more CO2 absorption at lower wavelengths.

    JH: The signal to noise ratio below 700 cm-1 decreased rapidly, so the quality of the spectra below this point was not good. The error bars became larger than the expected differences, so this region was not used.

    JC: How did you work out the difference between the IMG to IRIS data?

    JH: For the observations, measurements from both the IRIS and IMG instruments are available. These were calibrated radiometrically by the scientific teams that carried out each project. We had to process the data so that the spectral resolution was the same (choosing the resolution of the lower resolving instrument - IRIS), and we tested that the data processing in each case had not introduced artificial differences (apodisation function, field of view), and that the spectral scales were equalised (comparison of spectral wavenumber of individual features). Once all these effects had been taken into account, so that the two spectra were directly comparable, we took the difference to produce Figs 1a and 1c. For the theoretical curve (Fig 1b), we have programs that can simulate the upwelling spectrum at the top of the atmospehre, if the state of the atmosphere below is defined. We have data for the atmosphere for both periods, for the location chosen, and so these data were input into the program, and two spectra generated. The difference between these two spectra produces the difference spectrum betwen 1970 and 1997. Note that the theory curve confirms that the shape of the two observed difference spectra in the CO2 band is correct.

    JC: I was wondering if your analysis determined whether the total amount of outgoing longwave radiation had decreased from IRS to IMG? If so, is it mentioned in any of your papers (I couldn’t find anything but I may have missed something)?

    JH: It's a good question. The problem is that the observations do not cover the whole of the outgoing spectrum, and so it is impossible to obtain a total integral across all wavelengths. The 'missing' part of the spectrum is mainly at lower wavenumbers than about 500 cm-1, where there are effects due to the water vapour feedback.

    Even if we could integrate the whole of the outgoing IR, there is still the shortwave (SW) side of the net radiation balance, which we would need to consider to look at the total energy change, in and out.

    One other point: to sum up all the energy you would have to use the radiance spectrum, not the brightness temperature spectrum. Though they are equivalent, the transform from one to the other is not linear. So, integrating brightness temperature would not be easy to interpret.

    At present, therefore, the spectral measurements are not available to do the integration you suggest, which is why you found no mention in my papers. If you are interested in understanding any changes in the measured incoming and outgoing radiation, the best approach is to use the broad-band (non-spectral) Radiation Budget measurements from instruments such as NASA's CERES.
  7. I may be foolish to ask such a question, but what does brightness temperature actually mean. Is n brightness temperature (K) equivalent to the amount of energy necessary to create a change of n °s K, per wave-number cm ^-1? And if so can you relate such changes (obviously not directly to surface temperature over the same period? The lack of data below 700 cm ^-1 is not so surprising as there is overlap with water vapour beyond this point and as such it may be more difficult to detect changes. A thought, atmospheric circulation is more complex further away from the thermal equator, and energy/temperature cycling is more dependent upon atmospheric movement than at lower latitudes. Is it possible co2 has a greater effect in part because of this?
    0 0
  8. Another question. Is the Central Pacific data comprimised by the fact that Apr-Jun 1970 was the start of one of the strongest La Nina this century while Apr-Jun 1997 was the start of one of the strongest El Nino. There is no mention of this fact in the Nature paper.
    0 0
  9. I had posted a comment on JREF regarding this Smoking Gun. It's not so very often that I can be ahead of SkepticalScience!
    0 0
    Response: It's not that hard to get the scoop on me - I'm hardly known for my promptness or punctuality :-)
  10. @7 The absorption regions used these graphs - specifically the ones between 700 - 800 cm^-1, are not attenuated by h2o and as such change at that range in the spectrum cannot be attributed to it. Below 700 cm^-1 the absorption regions of co2 and h20 begin to overlap, so change in that region can be correlated to co2 alone. Point 2. There is no co2 absorption range at 970 cm^-1 that i am aware of, though i believe there to be a 03 region somewhere there about.
    0 0
  11. HumanityRules, 1) no, different absorption bands have different strength. As you can easily see in panel a, the band at 970 cm-1 is minuscule. The difference is scaled proportionally so is minuscule as well. 2) From the paper: "All the principal features due to changes in CO2, CH4, O3, temperature and humidity are well modelled, as are the small changes due to the chlorofluorocarbons (for example, at 850 and 920 cm-1) and weak CO2 bands (for example, at 795 cm-1)." It appers that John actually read the paper. 3) didn't understand what the point is. 3) this paper shows the increasing absorption of CO2 and other GHG. This is unambiguous whatever H2O might have done. The conclusion that it "[...] is consistent with concerns over radiative forcing of climate" is appropiate.
    0 0
  12. Whoops my bad. They do mention the 1997 El Nino but not the 1970 La Nina. Still not so happy with the one liner suggesting it may just shift the base line. The reversal of the trade winds during these two periods is surely going to have a major impact on the atmosperic components over the Central Pacific and elsewhere.
    0 0
  13. HumanityRules, I think it's great that you're asking so many questions. My question to you might require a little introspection. I don't know whether you had seen the original post about this graph at "American Thinker," but if you had, would you have put in a comparably aggressive effort to question Gary Thompson's representation and conclusions? In other words, are you this skeptical towards claims on both sides of the issue, or only in one direction? Perhaps you would have ... but if so, you would have been pretty much alone among Mr Thompson's audience. I didn't read through all the comments over there, but I did examine the first 20 posts. Not a single one raised any questions about Gary Thompson's mis-representation of the paper. Instead, here is a summary of those 20 comments:
    • Expressing congratulations: comments 1, 2, 12, 15, 18, 20
    • Promoting conservative political agenda: comments 2, 4, 7, 8, 10, 11, 12, 14, 17
    • Attack on scientists: comments 3, 5, 7, 9, 10, 13
    • Statement that AGW is a hoax/fraud/scam: comments 10, 11, 13, 14, 17
    • References to Al Gore: comments 7, 11
    • Praise for Lindzen or other prominent "skeptics": comments 9, 10, 15
    • Linkage to other climate-"skeptic" issues: 13 (snow this winter), 18 (claims of ice age in 1970s), 19 (Medieval Warm Period, hockey stick, etc.)
    • Linkage to other issues: comments 10, 17 (both advocating use of DDT as a pesticide)
    In other words, there's a complete absence of skepticism over there. Indeed, there's little more than self-congratulatory backslapping, repetition of widely available "talking points," and a tendency to see everything in the light of a particular current US conservative political agenda. Whatever your position on AGW is, one should at least acknowledge that John Cook has done an admirable job of creating a site here where science is discussed openly and critically, and where politics and personal attacks are mostly left outside.
    0 0
    Response: After posting this article, I was a bit annoyed with myself that I forgot to read the comments on the American Thinker article - there may have been someone who raised similar objections and hence the author's response would've been interesting. If all comments were similar to the first 20, I'm glad I didn't waste my time.
  14. It seems to me, that the main theme here is "skepticism" about the American Thinker, not only "Longwave radiation" ... Is so surely my earlier (deleted) comment was not about what You write?
    0 0
    Response: That comment was deleted because it was off-topic - it seemed to come out of left field and I struggled to see what it had to do with the discussion at hand. I'd say it was more appropriate in a discussion of what's causing the rise in atmospheric CO2.
  15. Remember last weeks postings on the Dunning-Kruger effect? Well, Gary Thompson's writing is a perfect example of it.
    0 0
  16. http://www.eumetsat.int/.../pdf_conf_p50_s9_01_harries_v.pdf I think this is the newer study to the (Harries 2001). If it is the place it above and delete my post thanks.
    0 0
  17. TruthSeeker, to easy to call data massaging whatever analysis is made on the raw data. Do you really think that cutting edge science is made with just a thermometer, a tape meter and a screwdriver? Do you think that you can just fly a satellite and it will say "hey, this is the number you were looking for"? It's silly. Look around other scientific fields or even what is behind many technological applications and you'll find even more data "massaging" than in Harries paper.
    0 0
  18. John: "The American Thinker article does not disprove the greenhouse effect." Agreed - but as I read it, it does not set out to try and do so. What it does is seriously challenge the hypothesis that "... Increased emission of CO2 into the atmosphere (by humans) is causing the Earth to warm at such a rate that it threatens our survival." The issue it addresses is one of magnitude is it not?
    0 0
  19. Riccardo @ 17 - {to easy to call data massaging whatever analysis is made on the raw data} TO make comments like this easier for my brain to "get", I try to find an anology in my world. The one that jumped out at me this time was MP3 players. They are able to squeeze so much information onto their drives, by "massaging" the data with an algorithym. Only keeping so much of the "raw" data, then when needed, "putting" it back in place. Anyway this works for me. Keep up the good work, enjoy your posts.
    0 0
  20. Leo G, that's a good one, really a lot of massaging in the MP3 compression algorithm.
    0 0
  21. Ubique, a little below the fourth graph: "So the results of three different peer-reviewed papers show that over a period of 36 years, there is no reduction of OLR emissions in wavelengths that CO2 absorb. Therefore, the AGW hypothesis is disproven."
    0 0
  22. The article states... "Thompson looks at several peer-reviewed analyses examining satellite measurements of outgoing longwave radiation" If "outgoing" simply reflects the raw data of temperature as measured by pointing the detector towards the Earth, it would seem that these curves represent a superposition of both Earth surface and atmospheric radiative emissions. It would seem like what matters is where the extra temperature is coming from. If it is coming from the surface of the Earth, that would support evidence for AGW. But if it is coming from the atmosphere, it would actually imply something a little different, more like a GHG heat conduit effect.
    0 0
  23. RSVP, the continuos part of the spectrum comes directly from the surface and reflects surface temperature. The atmosphere is overall much colder, i.e. much lower emission intensity and a peak shifted to lower wavenumbers, and being almost transparent has a lower emissivity. On the contrary, the level at which the strong absorption bands saturates reflects the tropospheric temperature or, to be more precise, the air temperature at the height from which IR escape directly to outer space.
    0 0
  24. Ubique at 04:05 AM on 23 February, 2010 In order to "seriously challenge" the AGW hypothesis, Thompson's paper would need to be free of the errors John identified, misinterpretations that leave Thompson's argument seriously deficient. Can you refute John's analysis?
    0 0
  25. Ubique, the "article" discussed does not really address any issue of magnitude. It confuses the readers by misinterpreting graphs picked from a peer-reviewed publication and suggesting conclusions based on the misintepretation. In doing so it completely fails to consider the very paper in which the graphs were found. I don't see how it could be of any interest whatsoever.
    0 0
  26. What Thompson does with the Chen 2007 paper is take the IRIS measured data graph (1970) and compare it to the TES measured data graph (2006), for brightness temperature. It's rather strange that he would do that, since there is a graph in the Chen paper that does exactly that and also compares the modeled results, it follows right after the other 2 graphs, the ones showed by Thompson. Then comes Chen's conclusion: "The TES data compare very well with the IRIS data, suggesting successful normalization of the different instrument characteristics. The TES and IRIS difference spectrum covers the time range of 1970 – 2006, a period of 36 years. Simulated spectra represent the state of the HadGEM1 coupled model for 1970 and 2006. Changing spectral signatures in CH4, CO2, and H2O are observed, with the difference signal in the CO2 matching well between observations and modelled spectra. The methane signal is deeper for the observed difference spectrum than the modelled difference spectrum, but this is likely due to incorrect methane concentrations or temperature profiles from 1970. In the future, we plan to extend the analysis to more spatial and temporal regions, other models, and to cloudy cases." Thompson makes no mention of that conclusion at all and does not delve into the details of how exactly he "suuperimposes" the TES and IRIS brightness temp curves, nor what would be the expectations considering how GH gases have varied over the 36 years.
    0 0
  27. The drop on the left is probably CO2. The drop on the right is either Methane or water vapor. The drop in the middle, I'm not sure. It could be CO2 as well. It could be Ozone. (I have a subscription to spectralcalc.com this month - still hasn't run out.)
    0 0
  28. I am the author of the AT piece. First off let me tell the website admin (John Cook) that I really like this website. This and Realclimate.org are the two main sources I go (daily) to see the science debated and talked about. as I stated in the article, I’d rather debate the science than talk about the IPCC, Climategate, Jones, Mann, etc. All of that makes good news stories but it doesn't get to the heart of this issue which is the science. And the fact that I frequent these sites and join in the discussions means I’m comfortable with criticism and having an open conversation about the science. I appreciate the comments/questions already posted and let me see if I can answer those who have asked something specific of the author (me). First off, I never stated in the article that I was disproving the greenhouse effect. My aim was to disprove the AGW hypothesis as I stated in the article "increased emission of CO2 into the atmosphere (by humans) is causing the Earth to warm at such a rate that it threatens our survival." I think I made it clear in the article that the greenhouse effect is not only real but vital for our planet (since we'd be much cooler than we are now if it didn't exist). Also, my aim was NOT to misrepresent the conclusions of the authors of the original 3 papers. I tried to be very clear in the article that the authors came to very different conclusions than I did and the authors were very clear as to why they came to those conclusions. There were three links to papers in this article and John chose to talk about one of them here (which happened to be the 2nd link) so I’ll take that one first. It is true that there is a spike down of about -1K in the region of 700-710 waves/cm but the rest of the range which extends to about 780 waves/cm, shows a the delta either zero or positive. The CO2 absorption range that is covered in the paper - as John pointed out and many know - extends further to the left and peaks at around 667 waves/cm so we don’t know what the data showed below 700 wave/cm. But if someone were to take this data - as given - and convert the BT measurements to OLR flux numbers (W/m2) I believe we'd see an increase in OLR flux (1997 vs. 1970) since the delta over the majority of this range (again, not the complete range but the range in this paper) will contribute positively to that delta. I didn't go through this exercise and plug this into the Planck function, integrate between the absorption wavelengths as listed in the paper and then compare the 1970 with 1997. I don't have the real data and to try and grasp that from a graph would be silly. Visually, this apparent lack of decline of OLR seems pretty obvious to me (when looking at the actual measured data). I suggest you take a look at the first link in the article as well. When looking at the graphs of the actual measured data in this paper, it becomes even clearer that there is an increase in OLR from 1970 to 1997 in the range where CO2 absorbs IR. The third link is the more updated Harries paper that several have posted about here so I did include that in the article as well (this compared OLR 2006 vs. 1970). In my opinion, this data falls into the same category as the paper reviewed here by John - a small -1K spike in the lower frequency OLR (again, it's not really the 'lower' frequency since the graph starts well to the right of the peak absorption for CO2) but then back up above zero for the higher frequencies in the CO2 absorption zone (which is also nicely grayed out in the more recent Harries paper). My point in this article was to show that you can see from the actual measured data that OLR is not decreasing in the area where we'd expect it to because of all the extra CO2 we've been spewing into the atmosphere (and just for the record, I am not arguing this CO2 rise - the Mauna loa data is easy to interpret). I was also pointing out the question that puzzled me - why the authors put so much value in the graphs that they produced via models - which showed a very large, significant drop in OLR in the CO2 range. We have increased the CO2 in the atmosphere about 17% from 1970 to 2006 (328ppm vs. 383ppm) and the OLR appears to have remained constant when you look at the raw data from these three papers. Does that mean water vapor is generating OLR that doesn't get absorbed by CO2? As John alluded to in his Q/A with Harries - I’d really like to see this data extended out to the 600 waves/cm to see what happens at the peak absorption wavelength of CO2. I’m fairly swamped at work this week and will check back if there are more direct questions you want to ask me. I only mention this so that no one takes my non-response as non-interest. If you have questions regarding details of this article I’ll try and respond as timely as I can. If there are no questions I’ll just sit back and enjoy the conversation and criticism. ok, let me have it.....
    0 0
    Response: Gary, many thanks for commenting. You're correct in that your article wasn't about 'disproving the greenhouse effect' - I've updated that wording to 'disproving the enhanced greenhouse effect' which I believe more accurately represents your position.

    I'm not sure that the authors do put so much value in the simulated graph (eg - Figure 1c from Harries 2001). The main point of their papers is to compare the measured data with the simulation (Figure 1b) to show that our understanding of the enhanced greenhouse effect is confirmed by observations. The use of modelling to filter out the effects of humidity in order to show the isolated effect of trace gases is not a crucial part of the paper (but it is interesting).

    I'm not optimistic that we'll see the analysis extended to 600 cm-1 as that is limited by the 1970s satellite data.

    Anyway, I appreciate your comments and expect (nay demand) that commenters here will abide by our commenting policy and treat you with respect.
  29. I find this very interesting. From my admittedly low level of understanding, it seems that the main point is the following. Let us for the sake of the argument ignore all the complications of climate, and only discuss the effect of greenhouse gasses. This is a very crude simplification, but lets make it anyhow. Then a certain concentration of greenhouse gasses will correspond to a certain ground equilibrium temperature. At this temperature, the Earth will radiate exactly as much heat as it absorbs from the sun. If the actual temperature on the ground is lower than the equilibrium temperature, the ground will warm up. As it warm up, the Earth radiates more heat, and eventually equilibrium will be restored. So we do not expect to see a net influx of heat at any particular time, we expect (in the first approximation) an approximate balance between the more or less constant influx from the sun and the total heat radiation from Earth into space. What will change if we increase the amount of greenhouse gasses is not the total amount of radiation over all wavelengths (that will be approximately equal to total influx, and thus constant), but the distribution of the radiation over wavelengths. If the heat radiation from the Earth increases at some wavelengths it must also decrease at some other wavelengths, because in the first approximation we expect the total amount to be roughly constant. Since we know that the Earth has has warmed in the period 1970-1996, we would naively expect an increase in the total amount of heat radiated from the Earth. This cannot be, and has to be explained somehow. The AGW hypothesis explains this is saying that some of the radiated heat is trapped, shifting the escaping radiation down at some wavelengths. I believe that it does not say that the total amount of escaping heat has changed - just its distribution along the spectrum. Please correct me if I'm talking nonsense here... I'm just trying to learn.
    0 0
  30. Gary Thompson says here: "I tried to be very clear in the article that the authors came to very different conclusions than I did and the authors were very clear as to why they came to those conclusions." In the comment thread of your blog, he says this: (Posted by: gdthomp01 Feb 18, 03:07 PM) "But even on the wavelengths shown, there was no decrease in OLR at those wavelengths so I still felt comfortable drawing the conclusions I did - and the authors of these papers (using simulated results from climate models) drew those same conclusions using these wavelengths although they weren't based on the actual measurements." This is hard to reconcile with the conclusion of the Chen article that I quoted above and clearly addresses the measurements: " Changing spectral signatures in CH4, CO2, and H2O are observed, with the difference signal in the CO2 matching well between observations and modelled spectra." In addition to the measurements, it would be strange for them not to examine model results, since these were the very subject of the paper. They found the model results to correspond very well to the observations, contrarily to what G. Thompson suggests in his conclusion. Thompson's conclusion also misrepresents the intention of the autors by alluding to possible dishonest conduct, or attempts to "trick" the reader, a reference to the well publicized hacked e-mails. G. Thompson: "All three of the links referenced here devote the latter sections of the papers to removing the impact of surface temperatures and water vapor and graphing the OLR that is associated only with trace GHGs. The authors perform this trick (there is that word again...) based on the climate models and not through actual measurements, and surprise, surprise -- these simulated results show a reduction in OLR emission with wavelengths that are absorbed by CO2." This in complete disagreement with Chen's conclusion (see above), since they clearly address the observations.
    0 0
  31. Gary Thompson, In your AT piece you said: "All three of the links referenced here devote the latter sections of the papers to removing the impact of surface temperatures and water vapor and graphing the OLR that is associated only with trace GHGs. The authors perform this trick (there is that word again...) based on the climate models and not through actual measurements, and surprise, surprise -- these simulated results show a reduction in OLR emission with wavelengths that are absorbed by CO2. Computer-simulated results based on climate models are never a replacement for actual measured data [...]" But the authors cited compare the increase in absorption to the increase the models predicted would occur at those wavelengts. So, the model differential outputs get compared to the subtration of the two observed spectra. Look at figure 3 in Chen et al.. The clack line on this graph is the result of directly subtracting IRIS data from TES data. Yet, in the your AT piece you only displayed the first two figures and suggested IRIS and TES were identical. Figure 3 shows that they aren't regardless of the model predictions.
    0 0
  32. The "clack" line is black, of course.
    0 0
  33. garythompson @ 28 quotes himself for the AGW hypothesis: "increased emission of CO2 into the atmosphere (by humans) is causing the Earth to warm at such a rate that it threatens our survival." My question isn't a technical one: where did this definition of 'the AGW hypothesis' come from? It doesn't seem like a very scientifically-stated hypothesis. Is it anything more than a strawman?
    0 0
  34. garythompson, i have a couple of comments on your article and, of course, on the explanation given here. The first is not about the science. You accuse the authors of the three papers of substituting actual measurements with model data while you omitted to show the third graph in Chen et al where both model results and data are shown. This a serious omission which undermine your claim. As for the sicence, there is a clear misinterpretation of how the radiative balance works. Indeed, it is not true that one should expect an overall decrease in OLR. If the planet is out of balance, as it is now, and trying to recover it needs to increase the overall OLR by increassing its temperature. This simple concept is unfortunately too often overlooked. What we see in the IR spectra is the superimposition of these two different effects, a decrease of the IR intensity at the absorption bands due to the increased GHG concentration and an increase elsewhere (the background thermal radiation from the surface) due to the increasing surface temperature. No surprise that near the edges of the absorption band the increasing thermal emission may outweight the increased CO2 absorption. On passing, extending the measurement range to lower wavenumber would not add much. Below 700 cm-1 the absorption saturates and the difference would obviously go to zero; you will end up with two spurious peaks on the two sides of the central frequency with zero in between.
    0 0
  35. Please correct me if I'm talking nonsense here... I'm just trying to learn.
    I think that's largely correct, Marcel. The irradiance from the Sun also can change, however, as can the bond albedo of Earth. These are relatively minor changes, though.
    0 0
  36. John Cook interprets Gary Thompson's misreading of the scientific literature as evidence of the Dunning-Kruger effect, but I feel this is a misinterpretation of D-K, and also misses the role of an even more harmful influence in the interpretation of scientific data, which is bias. D&K provide evidence that individuals having a low level of understanding of a topic tend to overestimate their own degree of mastery of that topic; however D&K treat this phenomenon as distinct from bias. While Thompson’s self-assessment might be higher than it should be (or not?), it would be difficult to argue that his knowledge of radiative heat transfer is not substantially greater than average. Why should this knowledge not provide an advantage, rather than a disadvantage, in his reading of the literature? The culprit here appears to me to be the insidious impact of bias. In contrast with pharmaceutical evaluations, or other experiments where human psychology can influence the results, we cannot realistically design a “double-blind” experiment to remove the influence of bias in the study and interpretation of climate change. We are constrained, instead, to making a sincere effort to minimize its impact. Skepticism is fine; however, if we approach climate science with the presumption that AGW is wrong, and that, ipso facto, evidence that appears to support it must be wrong as well, we substantially increase our chances of misinterpreting the scientific evidence by unjustifiably dismissing or ignoring evidence that is inconsistent with our ideology, and by failing to apply the same level of skepticism toward our own reasoning that we apply to evidence supporting AGW. After reading the articles, and blog comments above (including Mr. Thompson’s @#28), I conclude that Mr. Thompson has commited both offenses in the present case, perhaps inadvertently. Simply acknowledging the risk of bias is less than half the battle of eliminating its effects. I have seen many well intended individuals completely undone by bias, of which they seem to have only the faintest glimmering of self-awareness. Given the preponderance of specious arguments in the climate change “debate”, and the pervasive political ideology in AGW skepticism, it’s my conclusion that most of the criticism of AGW is rooted in ideology rather than science, and efforts to build a scientific case typically lead to what we see here. Indicators of the (inferred) ideological roots of Mr. Thompson's position may be found in his “Straw Man” definition of AGW (cf. Post #28 and #33), the politically “loaded” rhetoric in his essay, as well as the political slant of the very webzine where he chose to publish his results. (And while I’m not convinced that Mr. Thompson’s essay itself provides evidence for the Dunning-Kruger Effect, it’s worth considering that the webzine title “The American Thinker” might!) To me, this is the principal battleground of the present climate change debate, while climate scientists continue to do their best to understand the scientific evidence.
    0 0
  37. It seems that a lot of those who comment on the site (American Thinker) have a poor understanding of how scientists get paid through grants. I would correct them, but, alas, I am forever banned. Glad to see others contribute to the comments pages this article at AT. Good article, John. Love the iPhone app.
    0 0
    Response: Don't forget to post a review in iTunes :-)
  38. I am glad to see some serious discussion on this issue! I agree that the IMG, IRIS and AIRS spectral data do not cover a sufficient band to see the whole picture. Non-spectrally resolved satellite measurements indicate that the total outgoing long wave radiation has gone UP over periods of increasing CO2 and temperature. Here is one example: http://www.isprs.org/publications/related/ISRSE/html/papers/332.pdf As CO2 concentrations increase, the total OLR should decrease since more and more of the long wave radiation is trapped that would otherwise have escaped to space. If OLR does not decrease, then the radiative balance would be moving toward cooling, not warming. The increase in temperature to move the system back toward equilibrium would result in more IR emission as temperature goes up, HOWEVER the OLR increase resulting from this would have to be less than the decrease due to increasing CO2, otherwise the balance would be reversed and cooling would ensue. I would understand a relatively constant OLR, since an increase in surface emission in the window region could balance the decrease in the CO2 band in a quasi-equilibrium condition of increasing CO2. An increasing OLR is just not supported by increasing GHG warming. Some have said that OLR is predicted to increase - see Murphy 2009, Figure 1. This is a fundamental misunderstanding. The figure in Murphy is for an idealized step function increase in GHG. The increasing OLR only occurs AFTER the increase in GHG has STOPPED. When you apply this step function response to a monotonically (long time scales of course) increasing GHG concentration, the OLR will DECREASE over time. The OLR will only increase after the GHG increase has stopped or slowed significantly.
    0 0
  39. @coal geologist Not only are you a geologist, but you also make a great psychologist. I have been wondering for a long time why people simply cannot, or do not want to get their head around what is in essence a simple truth, namely AGW.
    0 0
  40. guinganbresil, your assertion that "...OLR increase resulting from this would have to be less than the decrease due to increasing CO2, otherwise the balance would be reversed and cooling would ensue" is incorrect because it is an overgeneralization. So is "The OLR will only increase after the GHG increase has stopped or slowed significantly." The amount of increase in OLR depends on the actual values in the specific situation, of the extra insulation from the greenhouse gases, of the rate of incoming radiation, and the rate of temperature increase. What you have stated as a logical requirement is not a logical requirement. It is only one possible case.
    0 0
  41. This discrepancy between the GCM models and the Satellite measurements has been known and discussed for years. The results has always been inconclusive.There has been no way to reconcile the results. 1. If you believe in the GCMs then they are right. If you believe in Satellite measurements then they are right. The conclusion is NOT definitive. The two systems get different conclusions. There is no way to determine which is correct.(so far) To take it one step further, I take exception to both studies. They are both wrong. Now try a THIRD theory. Called "EXCESS CO2 Scenario "(available free at www.scribd.com.) First I take exception to Gary Thompsons assumption that the GHE is valid. Arrhenius's GHE IS valid. He said Add an energy photon to a GHG and you get GHE warming. IPCC & the GCMs GHE says : Add a GHG to the air and you get warming. (They implicitly assume that there is excess photons always available for every GHG that is added) This is wrong. It is my claim that Arrhenius's GHE only works up to the point where we reach equilibrium in the air. I.e. if there is excess energy photons, then adding a GHG will give more GHE. BUT when you get to equilibrium, where energy in equals energy out to space via direct radiation AND CO2 delay & then radiation (hence GHE warming) , then ALL of the absorbable energy photons DO get absorbed, and there are no more available for when you add more GHGs. If there are no more photons available then you have EXCESS GHGs in the air AND the GCM feedback mechanisms do NOT work because there are no more photons to be absorbed by the feedback WV GHGs. The simple proof is that the energy spectrum for both CO2 & Water Vapor absorbs 100%.i.e. leftover GHGs. The next proof is that there is excess WV in the air. Otherwise the GHE would continue (runaway GHE) until all the WV was at the 900C of a GHG with a photon.- i.e. the GHE would continue until the oceans dried up. Third proof: When the humidity of the GHG WV goes from say normal 33% to raining or 100%, then the temperature does NOT increase like it should (i.e. instead of 32C from WV we should get 96C from rain??? It doesn't happen. But if the energy photons are limited and limiting then when you add more WV then the GHE would not increase. 4th proof: In the morning the sun light energy photons increase. The GHE increases. At night the sunlight goes to zero, The temperature decreases, the GHE decreases. The CO2 and WV that WAS transporting photons to space as part of the GHE, no longer do it. so they are now made available in the air, i.e. the available GHGs increases, but the temp goes down as the GHGs goes up. IPCC is wrong. IT is the Photons that dictate, NOT the GHGs. Once you get to equilibrium, the Arrhenius GHE CHANGES to no longer work. (there are no energy photons to drive it.) This means that adding more CO2 by mankind burning hydrocarbons, ONLY adds more excess unused GHGs to the air (more plant food) Finally I PCC's "more GHGs means more GHE" is wrong (only works when excess energy is available) because you can NOT warm an object up without adding energy (2nd Law of Thermo) What this all means is that 1. Arrhenius's GHE works, but only up to equilibrium where it becomes limited by the amount of photons coming in. (i.e. about 32C out of 287 or about 11%). BUT when the energy in increases every morning and the temp goes up by say 10C, then 11% of that is due to INCREASED GHE. As is 11% of any reduction when the sun goes down. 2. We are at equilibrium daily- go from absorbing energy to radiating on a rotating basis. Hansen's GCMs claims that we are NOT at equilibrium for 50+ years due to the extra added CO2. This is wrong. As #29 was getting to, if the ground gets hotter then it radiates more faster until we cool off to equilibrium (as dictated by the amount of energy coming in). Likewise if we cool off (unless volcano dust reduces the energy in,) the energy in will keep pushing and pushing and pushing until the temp returns to the equilibrium dictated by the energy in. It happens every day, at the speed of radiating photons (i.e. speed of light) Bottom line Mankind can NOT change the temperature unless he changes the amount of energy coming in (volcano dust, SO2 will lower it), or produces more energy (by oil gas & uranium- which is super trivial compared to solar insolation.) All adding more CO2 does is add more excess CO2 to the air. i.e. AGW is false. BUT GW is true. (as the AGW experts claim- a few missing data points do not change the conclusion that we have warmed. BUT obviously it DID warm from 1970-1998. So what caused it (because solar insolation has essentially been constant since the 60s.??? See John Dodds Wobble Theory of Global Warming at www.scribd.com - summary is free!) (John Cook, on the basis of the referenced papers I request that you ADD Gravity and Planetary Eccentricity to the list of causes of Warming & climate change)
    0 0
  42. @garythompson, Your claim is: "A key component of the scientific argument for anthropogenic global warming (AGW) has been disproven." Even if this was true, it does not disprove AGW in toto, contrary to your commenters at American Thinker. Many theories, accepted as valid, are often retained even with an anomaly or two. Newton's Law of Gravity could predict the existence of Neptune, but was not rejected solely because it could not explain the orbit of Mercury (Einstein's theory could). Science works in "paradigms", or (perhaps better) in "research programmes", of which climatology has been a resounding recent success. As we know through the work of Naomi Oreskes, 95% of climatology papers accept AGW. So to bring your claim home, you need to get it peer-reviewed & published, discussed at conferences and tested with new data. Science is inherently conservative and an accepted paradigm is not changed easily. Having read your article, I find like Ricardo at #34, your failure to discuss the last chart in paper 3 rather damns your thesis. You take the previous two charts, claim that one can be overlaid on the other, there there is no difference in the OLR between 1970 & 1997. But chart 3 shows is difference is non-zero. It seems to me that you lack the analytical skills to seriously investigate these data, because "eyeballing" is just not good enough.
    0 0
  43. garythompson "We have increased the CO2 in the atmosphere about 17% from 1970 to 2006 (328ppm vs. 383ppm) and the OLR appears to have remained constant" John Cook "Anyway, I appreciate your comments and expect (nay demand) that commenters here will abide by our commenting policy and treat you with respect." As long as the debate is focused on whether CO2 is causing global warming or not, oil interests are off the hook. Ironically, those who are crusading for the planet's health (in terms of correlating warming to GHG emissions) are in some sense impeding that attention be focussed on what is directly measurable... that being anthropogenic CO2. Of concern specifically is the planet's capacity to absorb CO2, and where all this could be taking us. This may be more of a problem than any warming. I dont really know this, but somehow if anything has me genuinely concerned, it is not runaway global warming, but runaway global CO2 concentration. I have placed these two excerpts side by side to contrast what appear to be two realities. One reflecting a known. The fact about CO2 global levels (even though I arrived at 14% using these values). The other, John's need to mediate the hubris of those "in the know". I would go further still and ask what guarantees does proving AGW have on taking action against curbing CO2 emissions? Maybe the warming will be seen as necessary as temperatures actually start dropping for other "radiative forcings". On the other hand, focussing directly on the ills of CO2 and our ability to control its output seems like enough work in its own right. ETC.
    0 0
  44. Tom Dayton (40), may assertion is based on conservation of energy. If you SUDDENLY add insulation to an object that is in thermal equilibrium, the heat loss from the object SUDDENLY goes down. The object's temperature then increases (and its heat loss through the new insulation) to restore the equibrium to the original heat loss. Conservation of energy would prohibit both the heat loss AND temperature to increase at the moment you add the new insulation unless the insulation were creating (or adding) energy to the system. The heat loss has to DROP before the temperature can increase. The more realistic case is a continual adding of insulation (increasing CO2) rather than a step increase. In this case the same applies, the increase in heat loss would only occur after the addition of insulation has been reduced (or stopped as shown in Murphy 2009.) At best, you could achieve a state of quasi-equilibrium where the increase in temperature (and thus its contribution to heat loss) matches the decrease in heat loss from the increasing insulation. I agree with you that IN REALITY the OLR could be going up due to some cause OTHER THAN CURRENT CO2 INCREASES - changes in albedo, insolation, or recovery from a PAST high CO2 transient that has been reduced. I have not seen a good explanation of the disparity. The increasing CO2 cannot warm the Earth (with downward long wave) if it is causing more heat loss to space (upward long wave) unless it is GENERATING ENERGY. I understamd the wavelength bands of the specific upward and downward fluxes are different, but overall energy must be conserved.
    0 0
  45. "Riccardo at 06:00 AM on 23 February, 2010 RSVP, the continuos part of the spectrum comes directly from the surface and reflects surface temperature. The atmosphere is overall much colder, i.e. much lower emission intensity and a peak shifted to lower wavenumbers, and being almost transparent has a lower emissivity. On the contrary, the level at which the strong absorption bands saturates reflects the tropospheric temperature or, to be more precise, the air temperature at the height from which IR escape directly to outer space. " I am sorry, but I do not follow. I thought CO2 is making the atmosphere that much warmer? Here you are saying it is colder, and that the extra IR is coming from the Earth's surface. If this energy is escaping because the atmosphere is transparent at these wavenumbers, how exactly is the surface getting warmer? If I am skeptic about anything, it has to do with my faith in "believers of AGW" to make a convincing argument about AGW. I think it would be more productive if we all just concentrated on lower CO2 for other reasons.
    0 0
  46. guinganbresil, you have to think in terms of a time dependent process. Separate, at first, the two contribution, energy absorbed by increasing CO2 and energy emitted by the warming surface. Both increase monotonically. When you start adding CO2 the first term must prevail pushing the system out of equilibrium. Then the system responds increasing its temperature. Two cases need to be considered: 1) if the increase in temperature is not strong and/or fast enough, absorption keeps prevailing pushing the system further and further out of equilibrium. This is the "pathological" case of the runaway warming. 2) if the increase in temperature is able to keep up with the forcing, the trend in total OLR reverses and the planet will exponentially reach a steady state. The take away message is that in any reasonably real situation on planet earth, if you measure a decreasing OLR the planet might be going toward a runaway warming or at least it's too early to tell (remember, it's a time dependent process); if you measure increasing OLR the planet is going to reach a steady state. Luckly the latter applies to the current situation and at least for now we can rule out runaway warming.
    0 0
  47. RSVP, does it come as a surprise that the atmosphere is on average colder than the surface? Never heard about lapse rate, i.e. that it gets colder with altitude? I thought it was preatty obvious. You still miss to distinguish the two componets of an IR spectrum as measured from satellites. There is the part that is due to absorption, the relatively narrow absorption band, and the part that is transparent to IR and hence can measure what comes directly from the surface. The former causes warming, the latter is what hopefully tries to restore equilibrium. You do not need to have faith on "belivers of AGW", you probably need to look a bit more deeply into the physics involved; 'cause even if all the climate science is wrong, it's not obviously wrong for sure.
    0 0
  48. Hello Gary I don't know if you are still paying attention to us. I agree with Toby Joyce's advice, you need to try to get this published in peer-review. It is meaningless on a blog site. There are millions of those. You cannot expect any of the climate scientists who need to review this to see it where it is. Personaly I will wait for that before I bother to read it. Johns'critique points out the serious flaws and is good enough for me. Anyway, given the rising global temperature, melting glaciers, melting Greenland and Antarctic ice sheets, bark beetle disasters, increase in extreme weather events and so on, I think your conclusion has been overtaken by events and rendered rather moot. :+) It is sort of like arguing that there is a serious flaw in the Case-Shiller housing index and housing prices are therefore not going to fall. Best regards Tony
    0 0
  49. On this blog and on the comments to my AT article there were two interpretations of my article that disturbed me. A) readers thought that my article somehow stated that the authors of the three cited papers agreed with my conclusions and B) I was being deceptive in not showing a graph that depicted the delta in BT between TES and IRIS. That was not my intent but since I was the one who wrote the article I am to blame for those perceptions. One of my favorite one-liners about life is that "in the absense of clear communication, people will make up their own story so it is up to me to communicate effectively." I updated the American Thinker article to clarify those two points and AT has uploaded the new version. First I put further language in the article that unambiguously states that the conclusions drawn in this article are from the author (me) and not the authors of the three cited papers. In many respects my conclusions were in direct opposition to the authors' conclusions in their papers. Also, I included the graph from the third paper that showed the comparison of the real measured data from TES and IRIS (2006 and 1997). I still think this data isn't compelling enough to draw a conclusion about the OLR decreasing over the spectrum of CO2 absorption and I didn't change any of my conclusions because I still believe those. I can live with counter viewpoints on how I interpret the data and my supposed lack of understanding of the underlying science but I can't abide being percieved as A) misrepresenting someone else's conclusions and B) cherry picking data and hiding contrary results. I Thanks to all here who brought this to my attention.
    0 0
  50. Hat tip to Gary Thompson, and to John Cook who-- by inflicting cruel and unusual demands for polite comportment on us all-- demonstrates that it's actually possible to have a productive dialog on this topic! Who knew?
    0 0

1  2  3  Next

You need to be logged in to post a comment. Login via the left margin or if you're new, register here.


The Consensus Project Website

THE ESCALATOR

(free to republish)


© Copyright 2024 John Cook
Home | Translations | About Us | Privacy | Contact Us