Climate Science Glossary

Term Lookup

Enter a term in the search box to find its definition.

Settings

Use the controls in the far right panel to increase or decrease the number of terms automatically displayed (or to completely turn that feature off).

Term Lookup

Settings


All IPCC definitions taken from Climate Change 2007: The Physical Science Basis. Working Group I Contribution to the Fourth Assessment Report of the Intergovernmental Panel on Climate Change, Annex I, Glossary, pp. 941-954. Cambridge University Press.

Home Arguments Software Resources Comments The Consensus Project Translations About Support

Twitter Facebook YouTube Mastodon MeWe

RSS Posts RSS Comments Email Subscribe


Climate's changed before
It's the sun
It's not bad
There is no consensus
It's cooling
Models are unreliable
Temp record is unreliable
Animals and plants can adapt
It hasn't warmed since 1998
Antarctica is gaining ice
View All Arguments...


Username
Password
New? Register here
Forgot your password?

Latest Posts

Archives

Arctic Sea Ice (Part 1): Is the Arctic Sea Ice recovering? A reality check

Posted on 12 April 2010 by Peter Hogarth

Guest post by Peter Hogarth

The dramatic downwards trend in the annual summer extent of Arctic sea ice - and marginal increase in Antarctic sea ice have both sparked intense debate and commentary. Viewed in a global context, the amounts of polar sea ice are relatively small compared with the massive total volumes of ice in the land based ice caps of Antarctica, Greenland, and the Himalayas. If we take into account the observations of recent accelerating ice mass loss from these areas, plus the mean length, thickness and mass loss from the worlds glaciers (and we consider that the often cited Antarctic sea ice is significantly thinner on average than the Arctic sea ice, and much smaller in extent during the melt season), it is evident that the global reservoir of perennial ice is diminishing. Coupled with the evidence of mean ground permafrost temperatures in all Arctic regions rising towards critical melt threshold over the past three decades, the evidence of ongoing average ice melt is global in extent and is currently following an accelerating trend. The relatively thin layer of sea ice floating on the Arctic Ocean appears especially vulnerable, and the clear multi-decadal decline in summer extent has become one of the most compelling indicators of recent climate change.

However it has been claimed that since 2007 the Arctic ice has been recovering. What does the actual data from Arctic studies show? Here we look at recent data and multiple strands of independent evidence to see if this claim has any basis in reality. Temperature, almost by definition, is the main factor that governs seasonal melting and re-freezing of ice. The amount of Arctic sea ice can almost be regarded as a self calibrating proxy for regional temperature, but there are several inter-related dynamic factors driving the high latitude weather patterns, air and oceanic temperatures, currents, and thus ice area and thickness. These causal factors will be the subject of a future post. Certainly, average temperature over the central Arctic has increased more than in any other region of the planet over at least the last fifty years, and the average length of the ice melt season has significantly increased over the past three decades (Markus 2009, Howell 2009, Rodrigues 2009).

The “extent” of sea ice (usually defined as area of the ocean covered by more than 15% of ice) is most commonly used when discussing changes in Arctic ice. Unlike the Antarctic case, the growth of Arctic ice area in winter is constrained by the land masses which almost completely surround the Arctic Ocean.


Credit for AOOS (Alaska Ocean Observation System) data Cavalieri, Markus, and Comiso. 2004. AMSR-E/Aqua Daily L3 12.5 km Brightness Temperature, Sea Ice Concentration, & Snow Depth Polar Grids V002, 2002 to 2009. Boulder, Colorado USA: National Snow and Ice Data Center.

For the Arctic, there are records of the annually advancing and receding ice edge on charts going back to the beginning of the 20th Century and some from even earlier (Walsh 1978, Mahoney 2008, Vinje 2003). It is possible to reconcile the early ice chart and aerial reconnaissance data with satellite data processed for ice edge, despite technical difficulties and several different algorithms and definitions (Comiso 2008, Comiso 2009, Spreen 2008, Anderson 2007). There are enough recent overlapping independent data series to attempt to resolve these differences and develop long term climatic records with quantifiable errors (Walsh and Chapman 2001, Rayner 2003, Bronnimann 2008, Cavalieri 2003, Scott and Meier 2010).

Looking at the long term trend of Arctic ice extent using satellite data back to 1972, and linking them as best we can to historical observations going back to the late 19th Century, there is a dramatic downwards trend, though shorter term, decadal (and regional) variations are apparent. These variations are relatively small compared with the seasonal variation between September minimums and March maximums.


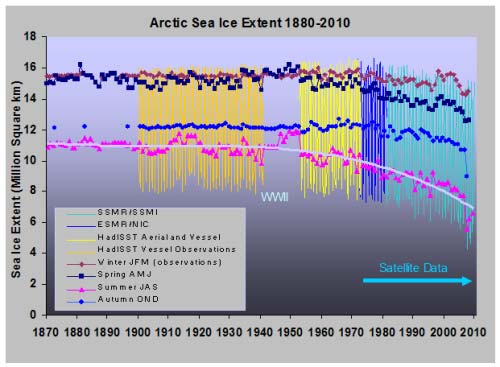
Long term seasonal trends in Arctic Ice extent. The data from HadISST and the ESMR “merged” data have been normalized to the SSMR and SSM/I record. The trend line is fitted to the three Summer month mean values (Walsh and Chapman 2001). The HadISST record from 1900 to 1944 is interpolated data fitted to observations and chart data, and uncertainties are larger.


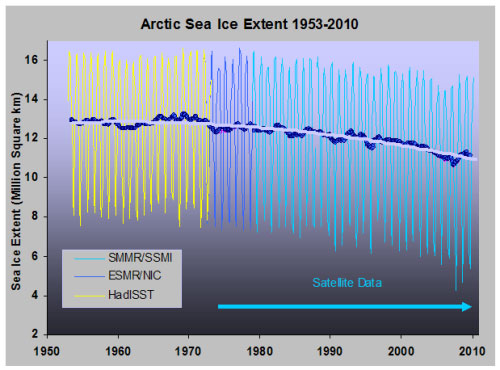
Higher resolution seasonal data and annual average values with trend from 1953 onwards.

In 2007, there was a large decrease in summer Arctic sea ice extent. By this time the summer minimum had diminished to around 40% of the 1979 to 2000 average. The amplitude of the swing between summer and winter extents has also increased, partially as a result of the increasing proportion of young ice forming in winter and more rapidly melting in summer in the warming Arctic environment (Goosse 2009).

It can be seen that in 2008 and 2009, the summer minimum sea ice extent increased slightly from the very low 2007 value. So does this mean that the arctic sea ice is recovering? Looking at the long term trends, the average long term decline is accelerating (Comiso 2008). It seems unlikely that this trend could be reversed over the course of two or even three years, and several periods of temporary multi-year increase are evident in the record. Are extents in 2008, 2009 and 2010 any different through the rest of the annual cycle? Let us zoom in further.


Animation of annual trends over the SSMR and SSMI satellite sensor period, month by month. All trends are significantly negative.

With hindsight and the benefit of two more years worth of data it is possible to view the anomalous 2007 decrease in ice extent as a temporary deviation away from the longer term downward trend (similar to those in 1990 or 1995). This trend appears to continue below model predictions (Stroeve 2007) and though recent refinements to climate modeling work has shown that an imminent dramatic change in this trend or “tipping point” is unlikely, at least in the Arctic (Notz 2009, Eisenmann and Wettlaufer 2009), these models still suggest a substantially Ice free Arctic before 2100 (Wang 2009, Boé 2009, Zhang 2010).

Can we say anything else about the amount of sea ice? Extent is the most visible proxy for the total amount of ice, and as we have seen we have relatively good ice boundary records for many Arctic regions for most of the 20th Century. Extent is important but to determine the total amount of ice we need observations of ice thickness in order to estimate ice volume. Ice thickness data from before the 1950s is sparse. Recently declassified submarine sonar based data from 1958 onwards, covering more than 38% of the Arctic Ocean, shows that overall ice thickness has almost halved in the past 30 years, and the thinning trend is accelerating (Kwok and Rothrock 2009). Observations over the whole Arctic region from before 2007 showed that the reducing ice extent was accompanied by a significant reduction in older sea ice (Rigor 2004), and a corresponding reduction in overall ice thickness (Yu and Maykut 2004, Lindsay 2009, Wang 2010, Shirasawa 2009). This average Arctic thinning trend, as measured by satellite radar altimetry (Giles 2008) and ICESat satellite laser altimetry (Kwok 2009), continued through 2008 and 2009 despite the increase in minimum ice extent. The loss of older ice has also continued through 2009 (Nghiem 2010). Satellite radar backscatter (QuikSCAT) data, which can highlight textural differences between new and older ice, cross checked with airborne and surface data records from 2008 and 2009 confirm that the winter perennial ice extent had reduced to the lowest levels on record.

Arctic wide studies show that the ice loss has not been constant or uniform over the entire Arctic area. Over the past ten years older ice around the North pole towards Siberia has diminished rapidly, whilst an area North of the Canadian Coast remains least affected (Agnew 2010, Haas 2010).


Movie of QuikSCAT 13GHz RADAR Scatterometer data clearly showing build up of new first year ice and areas of older ice, and the changes in overall extent and reductions in older ice from 2000-2009. Credit for images David Long, Brigham Young University, JPL NASA.

Even here, ice shelves which are estimated to be more than 3000 years old have “calved” or fractured since 2000, and recent voyages have provided direct observational data (Barber 2010, Barber 2009) showing that many areas reported as multi-year ice in 2009 by satellite sensors was in fact “rotten”, containing approximately 25% open water. Thus 2009 ice coverage as reported by satellites is likely to be an overestimate. Even so the satellite records showed that at the end of summer 2009, whilst about a third of the ice cover was second-year ice (an increase in proportion over 2007) multi year ice had reduced to a fifth of the total ice cover, the lowest in the satellite record. When age, thickness and extent are all combined, the total volumes of Arctic Sea ice through 2008 and 2009 are also estimated to be the lowest on record (Maslowski 2010, Tschudi 2010, press release). However it is the fact that these estimates are the most recent points on longer term downwards trends in extent, thickness and volume that is most important. Against this background, claims of recovering Arctic ice are not supported by the overall evidence.


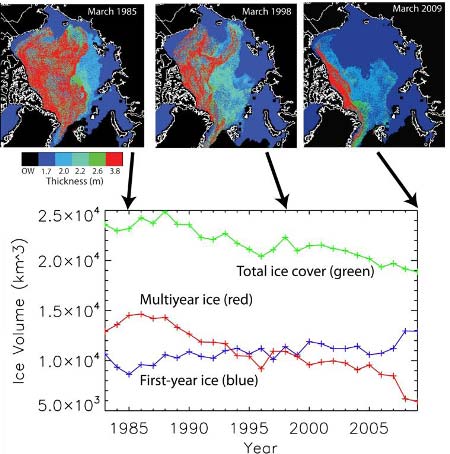
Estimates of ice volume since 1985(from Tschudi 2010) Image credit Jim Maslanik and Chuck Fowler, Colorado University, and Ron Kwok, JPL (NASA)

Although at the end of March 2010 Arctic ice extent enjoyed a brief anomalous increase due to cold weather conditions in the Bering and Barents seas, this ice is thin and young, and though there is also an increased proportion of overall second year ice since 2009, much of this has formed North of the Fram Strait and also in a large lobe North of Alaska along with a proportion of the remaining multi-year ice. Based on recent patterns of ice melt and motion it is likely that the scene is set for significant loss through 2010.

Viewed in a global context the amounts of polar sea ice are small compared with the massive total volumes of ice in the land based ice caps of Greenland, Antarctica, and the Himalayas. The Arctic sea ice is a diminishing and progressively thinning layer floating on the Arctic Ocean, and this makes it increasingly fragile and vulnerable to a number of related mechanisms which are likely to further enhance ice loss. The consequences of this loss for the inhabitants of the region could be profound (Ford 2009).

0 0

Printable Version  |  Link to this page

Comments

1  2  Next

Comments 1 to 50 out of 57:

  1. If 2007 was the lowest sea ice on record, I would expect ice coverage in 2008, 2009, and 2010 to consist of a considerably larger proportion of 'new ice' and for total volumes of Arctic Sea ice through 2008 and 2009 to still be among the the lowest on record. What is more interesting is that for whatever reason new ice is still forming. The post argues that the 2007 decline was an anomalous increase in an inexorable downward trend. However, given the physically impossibility for newly formed ice suddenly to turn into multi-year ice, we can't exclude the possibility that ice coverage may indeed be showing signs of recovery. New ice by its nature will be thin and fragile. Of course, we won't know for sure for another five or ten years (unless the present seeming recovery proves illusory over the next one or two years).
    0 0
  2. You can make the observation of a decline in arctic sea ice without it necessarily being linked to temperature change. Your article shows many depictions of the decline but doesn’t show that this is linked to temperature. In fact you could have mentioned two recent papers both of which describe mechanisms for ice loss from the arctic and neither of which rely on temperature increase. GEOPHYSICAL RESEARCH LETTERS, VOL. 37, L07701, doi:10.1029/2009GL042356, 2010 Ogi et al - Influence of winter and summer surface wind anomalies on summer Arctic sea ice extent Geophys. Res. Lett., 37, 3, doi:10.1029/2009GL041872, 2010 Kwok et al - Large sea ice outflow into the Nares Strait in 2007 The first describes the influence of wind for ice export in the Fram Strait and the second discusses the formation of ice arches that block the flow of thick multiyear ice out to the Greenland sea.
    0 0
  3. HumanityRules at 00:07 AM on 13 April, 2010 I am familiar with the references. Ogi 2010: The Fram strait and winter ice export is mentioned only once in passing, in the context of a paper by Shimada. From the summary of Ogi: “In addition, the polar atmosphere has displayed rapid warming. These changes probably caused the rapid sea ice loss after 1996, but the direct influence of atmospheric trend to sea ice needs to be studied”. Kwok 2010, from the conclusion: “If there is a decreased likelihood of arch formation as the ice cover becomes thinner and weaker due to warming, there is the potential for the Nares Strait to shift to a higher flow state”. You were saying?
    0 0
  4. chriscanaris at 23:18 PM on 12 April, 2010 Estimates of older ice, and overall average thickness and volume continued to decrease through 2007, 2008 and 2009. I don't exclude any future possibilities!, but it is sobering to look at previous "recoveries" with an eye on the trend.
    0 0
  5. #2 HumanityRules, this article covers the latest blog noise about a claimed recovering arctic sea ice extent, it's not about exploring the cause of the decline (or claimed recovery). Therefore, complaining about a missing explanation to link the decline to temperature increase seems a red herring to me. This site has explored the cause before in Arctic-sea-ice-melt-natural-or-man-made. And I assume that this article could have linked to the papers you mention, but do those papers add something important that was not already covered in the article (see below) or in any of the other linked papers whether sea ice extent is decreasing or increasing? The amount of Arctic sea ice can almost be regarded as a self calibrating proxy for regional temperature, but there are several inter-related dynamic factors driving the high latitude weather patterns, air and oceanic temperatures, currents, and thus ice area and thickness.
    0 0
  6. HumanityRules at 00:07 AM on 13 April, 2010 My apologies, your first reference is actually Ogi 2009, here is a link to Ogi 2010 to which I was referring.
    0 0
  7. #2 HumanityRules, Well, this post is about whether there is a receovery in sea ice. The Arctic has experienced more warming than any other region in the whole world. It is difficult to imagine how this can contribute to a stable trend in sea ice. I have not read the two documents you've linked, but I would bet that none of they say or imply that temperature is not the main driver of the long-term declining trend. Anyway, I would try with these ones: Human influence on Arctic sea ice detectable from early 1990s onwards Min et al 2008 Geophys. Res. Lett., 35, L21701, doi:10.1029/2008GL035725 On the Detection and Attribution of Anthropogenic Global Warming Using Northern Hemisphere Sea Ice Extent Mitchell, John F. B. - Garrett, Donald - Robock, Alan - Parkinson, Claire L. - Walsh, John E. - Stouffer, Ronald J. - Vinnikov, Konstantin Y. - Zakharov, Victor F. - Cavalieri, Donald J. -
    0 0
  8. Okay. I accept the assertion that the ice is thawing. But what is the explanation for this phenomenon?? We need to analyze the relationship vapor/fog water in the atmosphere because water vapor is the thermal battery of our planet. It's the "battery" that provides thermal energy to warm the night (no sun) and to soften the harsh winter (low sun). In summer the water and/or fog for to pass into the vapor state (potential energy - the latent heat) reducing the temperature of the planet releases this energy in the winter making it less strict. The same can be said of the temperatures of day and night. The greater the difference the winter/summer or day/night the greater the occurrence of extreme events. Defrost is an extreme event. Translate this paper (portuguise/Inglish) http://www.scam.com.br/tjdavila/solo/termostato.htm
    0 0
  9. #8 Tarcisio José D'Avila, Water vapour is a feedback, not a forcing (or here)
    0 0
  10. #9 doug_bostrom, Yes, I immediatly wrote John to let him know that I had missed a bold closing tag in the first reference. I hoped he could add this closing tag, but never mind. These were the references for #2 HumanityRules: Minn et al 2008 and Mitchel et al 2009. I haven't read his two references, but I would bet they don't say or imply that the (amplified) temperature trend is not the main driver of the sea ice long-term downward trend.
    0 0
    Response: I fixed your original comment and removed Doug's #9 response. Don't forget to use the preview button if you're posting HTML tags in your comment :-)
  11. Jesús Rosino at 02:57 AM on 13 April, 2010 Many thanks, I hadn't found those ones. Here's the link for Kwok 2010
    0 0
  12. I believe I mentioned it elsewhere here but for those keen on remote sensing as it relates to Arctic ice, good news as CryoSat 2 (link to comprehensive SpaceFlightNow story) was successfully launched a few days ago. This satellite is specifically equipped to monitor draft or thickness of Arctic ice.
    0 0
  13. Ultimately, the only statistic which tells us which way Arctic ice is going is the total volume. Extent is easy to measure, but not particularly useful. Consider; A single cube of ice 10' x 10' x 10' in size has a volume of 1000 cubic feet and an extent of 100 square feet. If we then chopped that block up into 1000 1' x 1' x 1' cubes, tossed out 950 of them, and arrayed the remaining 50 in a 'checkerboard' pattern the resulting volume would be just 50 cubic feet but the extent would still be 100 square feet. This is because 'extent' is defined as the area of ocean with at least 15% sea ice... and thus indeed a carefully scattered 15 one foot cubes could STILL cover an 'extent' of 100 square feet. From this example we see that two equal 'extents' can represent VAST differences in ice volume and even the surface area of actual ice (i.e. it only takes 15 square feet of ice surface to create an extent of 100 square feet). Thus, something as simple as a prevailing wind causing ice to bunch up in an area or scatter more widely can have a huge impact on 'extent' without changing actual ice area (and thus albedo) or volume at all. All studies indicate that total Arctic ice volume is still decreasing. Ergo, all the talk about blips in the 'extent' data is meaningless... even if they weren't classic examples of ignoring a pronounced long term trend to focus myopically on minor short term statistical variation.
    0 0
    Response: I wouldn't say sea ice extent data is meaningless. Just that extent shows a lot more variability than sea ice volume as extent is also affected by weather, wind, sunlight and year-to-year temperature changes (eg - an unusually cold winter will lead to greater reforming of first year ice). Nevertheless, Arctic sea ice extent is a good proxy for Arctic temperatures when considering long-term trends - you just need to be careful drawing conclusions from short-term fluctuations.
  14. RE #8 OK. I read the article in your Linck. He analyzes the steam only in the vapor state. Do not analyzes the transformations vapor / fog / cloud / vapor or rain dominated the "latent heat". We need to analyze the relationship vapor/fog of water in the atmosphere because water vapor is the thermal "battery" of our planet. It's the "battery" that provides thermal energy to warm the night (no sun) and to soften the harsh winter (low sun). In summer the water and / or fog to pass into the vapor state (potential energy - the latent heat) reducing the temperature of the planet releases this energy in the winter making it less strict. The same can be said of the temperatures of day and night. The greater the difference the winter / summer or day / night the greater the occurrence of extreme events. But these climate modelers did not predict that the ammonium produced by decomposition of organic matter disperse and waterproofs the clay soil. Today, the evaporation of water on the continents is reduced by requiring the oceans to warm up to replenish the moisture in the air. I'm trying to draw attention of the scientific world to this fact. http://www.pnas.org/content/104/39/15248.full.pdf "Because SSM/I moisture retrievals are unavailable over the highly emissive land surface (18), our focus is on the total column water vapor over oceans, Wo, for a near-global domain." Translate this paper (portuguese/Inglish) http://www.scam.com.br/tjdavila/solo/termostato.htm
    0 0
  15. John, inline comment #10, Thanks, John. My fault, and it's not the first mess due to my quick writing (though I didn't imagine I could affect the whole thread). I'll be more careful. Peter Hogarth #11, Thank you for this post, I'm looking forward to reading the upcoming 2nd part! Let's see if I can find the time to finish the translation of this one before that :)
    0 0
  16. There seems to be a "recovery" in multiyear ice(older than 3 years) http://nsidc.org/arcticseaicenews/ http://nsidc.org/images/arcticseaicenews/20100406_Figure6.png If this is really a "recovery" is debatable, as most of this "multiyear ice" is really 3-year ice. Older ice is still at record lows. It will be nice to see an estimation of ice THICKNESS based on those sea ice ages, to see if there is any sign of recovery in ice VOLUME.
    0 0
  17. Thanks to Dr. Hogarth for this interesting post. I would like to echo his and others' comments speaking to the fact that the role of winds on modulating Arctic sea ice has long been known. The role of warmer temperatures conditioning the sea ice to be more sensitive to extreme events such as 2007 has also been established. Also, see figures below to see how the number of melt days has been increasing over the satellite record. I'm afraid the 2007 event is going to become the sea-ice equivalent of the 1998 spike in global SATs, and will be seized upon by those in denial about AGW to confuse lay people and to muddy the waters. 
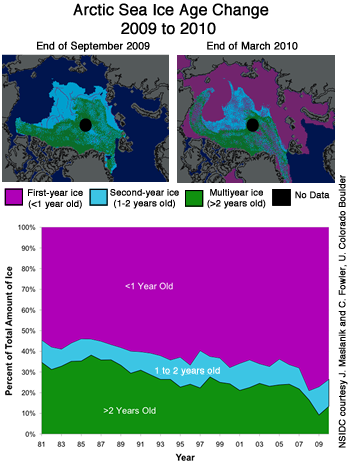
2010 is going to be an interesting year. How this melt season pans out will be determined, in part, by what the AO does in the next 5 months or so. Perhaps more importantly, there is a lot of young and thin ice over the Arctic basin (about 10% is covered by ice more than two years old, compared to 35% in the early eighties): Claims that the Arctic sea ice is "recovering" based on just a few data points are irresponsible and premature.
    0 0
  18. The "Long term seasonal trends in Arctic Ice extent." graph going back to around 1870. How come this doesn't seem to match up with the temperature reconstructions of the arctic going back that far? In particular those temperature reconstructions show warming in the early 20th century (eg here), which I would have caused quite a bit more sea ice decline than appears in the sea ice reconstruction?
    0 0
  19. Re #CBDunkerson - “Extent is easy to measure, but not particularly useful.” There’s one way in which extent of sea-ice (and snow cover) is absolutely critical - its impact on albedo. Sea ice reflects around 80 per cent of incoming solar radiation; open water absorbs about 80 per cent, and the effects of the subsequent warming can extend inland over 1000 kms. From a preliminary study by the PEW Environment Group on the CURRENT feedback impact of melting sea-ice and snow (albedo effect) and permafrost (methane release): “In 2010, the loss of Arctic snow, ice and permafrost is projected to cause warming equivalent to 3 billion metric tons of carbon dioxide, equal to 40 percent of total annual U.S. emissions.” Apparently this study is the first formal attempt to quantify these feedbacks. Its findings, if confirmed, are truly hair-raising.
    0 0
  20. #18 wingding My guess is there isn't a great deal of confidence in the early part of the long term record extent shown here. As john might put it the meme of low ice in the 1930s and 1940s is pushed by skeptics. #17.Albatross You seem to have it the wrong way around. Alarmists made the most of the aberrant 2007 sea ice extent to push the worst case scenario's. Recovery from that aberration has left them back peddling. It's not unexpected that skeptics would make the most of that. You should be most critical of the extreme alarmists, they do more to undermine the science. Short termism on both sides of the argument are unhelpful. If this article is only about whether there is a recovery in arctic ice wouldn't it be simple enough to state one aberrant month (March 2010) is insignificant compared to several decades of loss. I wouldn't dispute the downward trend for several decades or that the past two years can be considered a recovery. My objection continues to be the assumption that this is down to temperature when other factors are obviously important, if not dominant. This article contains many sentances where the temperature/ice extent relationship is assumed. For much of the highest latitudes the melt season has remained unchanged for the past 6 decades. What is driving ice loss in this region?
    0 0
  21. Wingding at 08:37 AM on 13 April, 2010 This is actually an interesting question. Though ice chart data from Russian waters does show some correlations (see Mahoney 2008), and it would be interesting to track where the sparse temperature data is from, we can agree (hopefully) that temperature is a major part of the story. The chart you have referred to is air temperature. As a fair proportion of the ice melt is basal melt caused by warmer waters we also have to factor this in, (as well as energy transport by currents and atmospheric variations). Unfortunately there is little Ocean temperature profile data from before the 1950s, but we do have a proxy, and that is Sea level rise. HumanityRules at 16:04 PM on 13 April, 2010 I think you missed the references to significant trends in lengthening melt season in the post? The somewhat misleading animation in your comment becomes a little clearer when plotted in full for the length of the record. I have plotted the NCEP data and the Danish Meteorological Institute data from 1958 (where the DMI series starts). I’ve added a simple trend line. I'll get a larger version available.
    0 0
  22. Re: Hugh #19, actually 'sea ice extent' is NOT "critical" in determining the ice albedo effect. If you refer back to my previous post you will see that I mentioned the albedo effect and explained the difference between ice area (which directly impacts albedo) and ice extent (which can be up to 667% of the ice area). In short, the fact that 'sea ice extent' is a measure of OCEAN area with "at least 15% sea ice" means that a 100 square foot area of ocean completely covered by ice has exactly the same 'extent' as one with only 15 square feet of ice coverage... but the albedo impact is going to be hugely different. In response to the comment attached to my post #13... I wasn't saying that ice extent is in all ways meaningless. Rather that even a ten year trend of increasing sea ice extent would not mean that Arctic sea ice was recovering if the same ten year period showed arctic ice VOLUME decreasing. This is because ice extent is a proxy (with up to a 667% error rate) for ice area... which is in turn a proxy for ice volume (providing two of the three dimensions needed to calculate it). Likewise, since ice extent is heavily impacted by temperature, winds, and currents it could serve as a proxy for any of those. However, due to the huge error bands involved it is only useful for getting a general idea from very long term trends. Hopefully the just launched Cryosat-2 and NASA's forthcoming ice monitoring satellite will finally give us the ability to measure ice volume more precisely and consistently. Ice extent had been the only game in town, but using it for predictions has been a bit like guessing what a cloud will look like three days after you first spot it.
    0 0
  23. Up to date Ice Volume Anomaly Estimates can be found here: Ice Volume Anomaly
    0 0
  24. Unrecovered at 01:37 AM on 14 April, 2010 Many thanks, this is a great resource, well worth highlighting. Zhang et al, PIOMAS chart from Polar Science Center, Advanced Physics Lab, University of Washington.
    0 0
  25. Humanity @20, "Alarmists made the most of the aberrant 2007 sea ice extent to push the worst case scenario's. Recovery from that aberration has left them back peddling." Yes, some people were perhaps overly concerned that the 2007 event was the beginning of the end, ands some rather silly dates were thrown around. But 20 years form now we may agree with them that 2007 was a paradigm shift, only time will tell. Regardless, the NSIDC et al. are not "back pedalling" as you are trying to suggest. Overall, the scientists have been level-headed on this. As noted by Dr. Hogarth above "an imminent dramatic change in this trend or “tipping point” is unlikely, at least in the Arctic (Notz 2009, Eisenmann and Wettlaufer 2009)," Some scientists (Dr. V. Pope I think) suggested that the demise of the Arctic ice sheet may occur in steps. Humanity, the old argument that "they (the alarmist) did it so the fact we did is OK" does not cut it. A agree with your observation that "Short termism on both sides of the argument are unhelpful." Humanity "I wouldn't dispute the downward trend for several decades or that the past two years can be considered a recovery." This statement is internally inconsistent, and is also inconsistent with the your statement that "short termism on both sides of the argument are unhelpful." The long-term trend is statistically significant, the short term trend is not, there is no way of getting away from that fact. Also, you do not quantify by what you mean by a "recovery" (recovery of what exactly, to what extent/volume, transient or long-term?). It seems that you are setting a very low bar for "recovery" and a very high bar for "downward trend". The animation from DMI that you show is, IMO, misleading. First, the data are for 80 N and we all know that the Arctic starts at 66.5 N, with most of the sea ice north of about 72 N. Second, the scale makes it really difficult to discern small changes. Third, your statement seems to assume that the ocean, air and ice north of 80 N are isolated from their surroundings, which is not true. Fourth, the satellite data showing changes in the melt season in my original post do not extend north of 82.5 N (?), but they do show an increase in the summer melt right up to the edge of the data void (i.e., north of 80 N). Fifth, the seasonal warming over the Arctic in the summer has been documented using ERA data by Graversen et al. (2008, Nature). See their Fig. 1. While most of the warming (between 1979-2001) north of 70 N was observed in the boreal winter and spring (surface trends >0.8 C per decade), surface warming was also observed in the summer (0.1 to 0.2 per decade; 0.4 C per decade near 70 N). And in the fall, the warming was >0.5 C per decade North of 70 N and >0.7 C per decade north of 80 N. Also see their Fig. 4 which shows thew warming trend between April and October north of 80 N to be at least 0.4 C per decade. By comparison, global temperatures are increasing at about 0.15-0.17 C per decade. In a response to Graversen et al. (2008), Grant et al. (2008) convincingly demonstrate using both sounding and ERA data that the near surface warming between April and October over the Arctic (incl. north of 80N) is significant (see their Fig. 1). They did find issues with the warming near 700 hPa found in the ER-40 analyses which did not seem to be supported by in-situ radiosonde data. That all said (phew), we have to keep in mind when looking at the ERA-40 data north of 82.5 N is that the data are no longer constrained by radiosonde observations, but rather sub-par satellite data (Thorne, 2008 Nature; critique of Graversen et al. 2008). The trends in surface data in ERA-40 north of 72 N do appear to be reliable and those data are showing a distinct warming trend between April and October (and also for the summer months) which is not easily teased out of the DMI animation. Interestingly, WUWT is fond of using that DMI graphic. I think that we all know why that is.
    0 0
  26. Peter @24, That graph says it all. Thanks unrecovered.
    0 0
  27. Peter, thank you for putting the Arctic ice information together so well with so many good references. I also added Polar Science Center to Bookmarks. Even before I saw this article and that graph though, it was apparent to me from the NSIDC site that Arctic ice volume has not recovered, so I have no idea why anyone says Arctic ice has recovered, and i do not consider attempts to explain that simple fact to people as 'backpedaling' in any way.
    0 0
  28. 21.Peter Hogarth Peter I think the concluion from your graphic and my graphic are pretty much the same. The seasonal variation in your plot illustrates the point. The trend line you have plotted is essentially the average temperature. What I'd be interested in is a plot for the year high (or summer/melt seson) and for the year low (or winter temp). It'll probably show very little trend in the summer season (there appears no increase in max temp) and the greatest trend in the winter. Interestingly if you do a similar season plot for ice extent you see the lowest trend in winter and highest downward trend in the summer. The opposite to the temperature. 25.Albatross Maybe my wording was poor. I trust the satellite record shows a 30year downward trend. I also don't think the past two years constitutes a recovery. I think we actually agree on that! I take your point that the graphic I show is for the highest latitudes. But yourself (post #17) and others have pointed out the importance of age/thickness of the the ice and much of the oldest and thickest ice is at these higher latitudes. I just came across a paper which maybe resolves our two positions "The authors speculate that decoupling of the ice thickness-volume relationship resulted from two opposing mechanisms with different latitudinal expressions: a recent quasi-decadal shift in atmospheric circulation patterns associated with the AO’s neutral state facilitated ice thickening at high latitudes while anomalously warm thermal forcing thinned and melted the ice cap at its periphery."
    0 0
  29. There has been an increase in snow cover on some NW Montana glaciers since 2007. The Stanton was nearly all bare ice in late Sept 2007 and completely covered with snow (mostly from 2008) the same week of 2009. The Grinnell showed similar improvement in late August. Are these two part of the "90% growing"? The growth is unlikely to continue since we are at 50-60% of normal snow pack this year. (I hope growth continues, it is easier to ski snow than ice.)
    0 0
  30. Humanity Rules: Surface temperature is limited over the summer ice by the melting ice itself. The temperature in the past was near zero celcius and continues near zero. It cannot go up until the ice is gone. Even then, the surface temperature is constrained by the cold arctic ocean. It is not suprising that summer temps have risen less than winter. There is more room for change in the winter. It will be interesting to see in the next decade if the summer temperature starts to rise faster now that there is so much less ice. There are reports that the old ice near Canada includes large sections that are rotten (contain much degraded ice). This ice may not be resistant to melt in the summer, depending on the weather. I have seen a variety of predictions when the Arctic is expected to be ice free, ranging from 2013 (!!) to 2070. It seems to me that Dr. Hogarth has adopted a conservative tone for this thread (IMO a good position). These models are in flux as the ice changes from year to year. The next few years data will be interesting to see.
    0 0
  31. Reference for claim of rotten ice near Canada in previous post: Barber, D. G., R. Galley, M. G. Asplin, R. De Abreu, K.- A. Warner, M. Pucko, M. Gupta, S. Prinsenberg, and S. Julien. 2009. Perennial pack ice in the southern Beaufort Sea was not as it appeared in the summer of 2009. Geophysical Research Letters 36, L24501, doi:10.1029/2009GL041434.
    0 0
  32. Don Gisselbeck at 10:36 AM on 14 April, 2010 Not sure on those specific glaciers! I guess it depends on how much is left after summer as well as how much falls in winter. More snow and more melt are not necessarily exclusive. But have a look at Bolch 2010 which looks at the pretty high glacier loss trends in BC and Alberta (25% loss in glacier area in Alberta 1985-2005, a bit better in BC)
    0 0
  33. OK, arctic sea ice extent in 2007 was low. Is it unprecedented? Not quite so. Ice edge in mid July was never 200 km north of Svalbard in recent times. You can check it here and here. And 1664 was deep in the Little Ice Age, winter of 1664/65 being one of the coldest ever in England. Looks like sea ice extent and temperature are not closely related. I have also made a rather boring gif movie using ACSYS historic sea ice data.
    0 0
  34. Berényi Péter while I can think of all kinds of problems with trying to generalize conclusions from Arctic ice in 1664 versus Arctic ice in the present, you are as usual to be congratulated for actually doing original work on this topic. But your conclusion "sea ice extent and temperature are not closely related" is not up to your usual snuff. Surely you can better qualify that remark?
    0 0
  35. This is what i'd call extreme cherry-picking: one day, in one year, in a small portion of the arctic where extreme melting in 2007 did not occur. People could use their time and intelligence more productively.
    0 0
  36. #34 doug_bostrom at 03:32 AM on 15 April, 2010 Surely you can better qualify that remark? Do I have to? The LIA is the coldest period during the last eight thousand years. On the other hand, the last decade is claimed to be at least as warm as the Holocene Optimum five thousand years ago. Still, some years in LIA show sea ice extent lower than the lowest recent summer one. Therefore sea ice extent and temperature should not be closely related. Either this or the last decade is not so warm after all.
    0 0
  37. BP my point is, surely there is some relationship between temperature and sea ice extent? I think we could agree that if the polar regions never dipped below freezing, we'd see lower ice extent? Not to be snarky or facetious but instead just point out there's a continuum here that is sort of inevitable. Also I agree w/Riccardo; I don't think the extent information you've got is sufficient to warrant much in the way of conclusions about where we're headed with regard to ice mass. The gif movie is cool but you ought to add some indication of recent median extent to the base image.
    0 0
  38. Berényi Péter at 05:55 AM on 15 April, 2010 I like the animation, but you are basing a controversial statement based on a snapshot of a section of data that is far less than 10% of total Arctic “edge”, with uncertain navigation errors, and with unknown definition of ice concentration. If I thought the ACSYS data was representative of overall Arctic Ice extent I would have used it, but their accompanying documentation gives fair warning. I'd have liked to push the data as far back in time as possible and presumably so would Vinje and Goosse (ACSYS). Anyway, here is their modeled estimation of historical Northern Hemisphere ice extent anomaly.
    0 0
  39. Russia among other nations has had a fleet of ice breakers and ice breaking cargo ships operating in the Arctic, breaking ice to open their ports and rivers and even taking excursions to the North Pole. The latest of 8 operating nuclear powered versions will make ten knots through 8 feet of ice with a maximum ice depth of 9 feet. The USSR's first nuclear ice breaker was launched in 1959. The first of the latest Antarctica class was launched in 1975 they are used for clearing the sea lanes north of Siberia and for sightseeing, with excursions to the North Pole. The effect of breaking up all this ice and exposing the broken surfaces to the warmer seawater plus the heating effect of sunlight on the exposed water cannot help but have an effect on the system. Broken ice would experience accelerated melting in the summer and slower ice build up in the winter due to precipitation falling on water and not having a chance to freeze and accumulate as it would on ice. How much has this disturbance changed the balance of nature in the arctic? -T http://www.youtube.com/watch?v=Q6OHHGrVM3g&feature=related http://www.youtube.com/watch?v=g4RQXkI3B8w&feature=related http://en.wikipedia.org/wiki/List_of_icebreakers http://en.wikipedia.org/wiki/Lenin_(nuclear_icebreaker) http://en.wikipedia.org/wiki/Arktika_(icebreaker) http://en.wikipedia.org/wiki/Arktika_class_icebreaker http://en.wikipedia.org/wiki/SS_Manhattan_(1962) http://en.wikipedia.org/wiki/Ice_breaker http://en.wikipedia.org/wiki/Nuclear_powered_icebreaker
    0 0
  40. Albatross @ 25 in response to Humanity Rules @20 'The long-term trend is statistically significant, the short term trend is not, there is no way of getting away from that fact.' We have no way of knowing except via the passage of time whether the short term trend will eventually be statistically significant. I think this is broadly equivalent to what statisticians call a Type II or Beta error - rejecting a statistically non-significant trend because of insufficiency of data. Wikipedia amusingly calls it an 'error of excessive skepticism.'
    0 0
  41. tobyw at 10:57 AM on 15 April, 2010 I guess in winter the re-freeze will be pretty quick, and there’s precious little sunlight to warm the temporary open water. In summer the Russian routes are increasingly ice free. However, I didn’t know this is one of the NSIDCs frequently asked questions. They say effects are minimal (no doubt about anthropogenic though!)
    0 0
  42. chriscanaris #40, again I point out the fallacy of your argument... sea ice extent is a proxy at two removes for sea ice volume. Data shows that the ice volume has continued to decline... therefor no 'recovery trend' exists to have this 'statistical significance' argument over. That sea ice broke up more and/or was more spread out (the two factors differentiating 'extent' from 'volume') for a few years is irrelevant to the overall state of the ice... which is still declining.
    0 0
  43. What CBDunkerson said @42
    0 0
  44. Re the short-term trend - yes, the passage of time will tell us whether it's a statistically significant trend, but by then it will be a long-term trend, not a short-term one... :-D I think that's the whole point re the 'statistical significance' - there's not yet enough data to show whether this is a trend that may continue, or a short-term upward variation in a downward trend. The null hypothesis, of course, being that the existing (downward) trend continues, and this is a short-term fluctuation. Thanks to the folks who provided the references on ice volume - very informative. I suppose decreasing volume at the same time as increasing extent means thinner ice which will melt that much faster during summer. Will be interesting to see what happens this year.
    0 0
  45. I'm going to be a bit pedantic. If the trend is not statistically significant we can not refuse the null hypothesis, i.e. that we didn't get the result by chance. This does not mean that you can claim the opposite, you just can say nothing. In our case, we have a statistically significant downward trend while the recent upward trend is not. We must conclude that the probability of having the short term upward trend by chance is high. @ Bern i'm still in a pedantic phase :) Statistics won't tell you anything about wether or not the trend will continue in the future. It may eventually allow you to claim that there has been a trend in the past. For example, there is a statistically significant downward trend every spring but you can count on the opposite trend in autumn. To predict the future you need a physical model.
    0 0
  46. Volume = ice area * average thickness Extent = ice area / average concentration (15% to 100%) The past two years the minimum extent has increased while the volume has continued to decrease. Looking at the formulas above we can quickly deduce that this suggests the ice has gotten thinner but more spread out. Which makes perfect sense because it is easier for thinner ice to be broken into pieces which can drift away from each other rather than remaining one large solid block. In short, the recent small increase in extent is IMO actually a bad sign. Given that the ice is thinner and more broken up I'd expect to see a significant increase in ice area and extent... as in my example where a 1000 cubic foot solid block broken into 1 cubic foot components could go from covering an extent of just 100 square feet to as much as 6,667 square feet. The comparatively minuscule increase in extent observed over the prior two years suggests that not only is the ice getting thinner, but more of it is also melting away entirely... leaving a smaller area of thinner ice which is just spread over a larger area of the ocean.
    0 0
  47. The website Cryosphere Today cryosphere today has a lot of data and animations on arctic and antarctic ice. They show their data using ice area, not extent like the NSIDC does (the data comes from NSIDC). I have followed them for about two years and there is little difference between the area and extent graphs. This year Cryosphere Today shifted to a thirty year baseline (NSIDC uses twenty years) and that made more difference than extent versus area. They have an interesting ap where you can compare any two days in the arctic ice record to see the difference between different years. Cryosphere Today rarely comments on the data. In the current era of data being challenged by sceptics I think ice extent is easier to defend to laymen. The extent data is simple and requires little massaging to obtain.
    0 0
  48. For those wondering above where glaciers are advancing, you can see a few of them in Southeast Alaska in the maps shown on pages 5 and 6 of this report but they are surrounded by many more that are wasting. Also, as the author suggests in the Discussion (#5 at page 7), the reason for advancement may be due to increased precipitation feeding glaciers whose bodies lie predominantly at higher elevation. In other words, climate change (more moisture in the atmosphere) may be contributing to their advancement. To be fair, he notes that there are many complex variables affecting glaciers - but his maps of how many are wasting are pretty sobering.
    0 0
  49. #48 http://www.wgms.ch/mbb/sum08.html The world glacier monitoring service preliminary data for 2007/2008 suggests 1/3 of studied glaciers are advancing while overall there is a nett retreat. The need to qualify glacier advancement seems like a bias in the outlook of the reporter. No real need to explain the many complex variables of retreating glacier the answer in that case is obvious!
    0 0
  50. 34.doug_bostrom at 03:32 AM on 15 April, 2010 35.Riccardo at 05:42 AM on 15 April, 2010 Both seem a little unfair to BP. While he highlights to record he also provides a visual representation over several centuries. Data is data. If we threw away all incomplete data in the climate sciences there would be very little left. I'm also not sure why you'd want a particularly linear decrease in sea ice over a century or more as indicated by the figure in #38.Peter Hogarth. This reconstruction of Greenlands temperature for the past 150 years (fig10) by those infamous skeptics Jones and Briffa suggests that temperatures are far from linear. In fact the 1930's were warmer than present. http://www.cru.uea.ac.uk/cru/data/greenland/vintheretal2006.pdf
    0 0

1  2  Next

You need to be logged in to post a comment. Login via the left margin or if you're new, register here.


The Consensus Project Website

THE ESCALATOR

(free to republish)


© Copyright 2024 John Cook
Home | Translations | About Us | Privacy | Contact Us