Climate Science Glossary

Term Lookup

Enter a term in the search box to find its definition.

Settings

Use the controls in the far right panel to increase or decrease the number of terms automatically displayed (or to completely turn that feature off).

Term Lookup

Settings


All IPCC definitions taken from Climate Change 2007: The Physical Science Basis. Working Group I Contribution to the Fourth Assessment Report of the Intergovernmental Panel on Climate Change, Annex I, Glossary, pp. 941-954. Cambridge University Press.

Home Arguments Software Resources Comments The Consensus Project Translations About Support

Twitter Facebook YouTube Mastodon MeWe

RSS Posts RSS Comments Email Subscribe


Climate's changed before
It's the sun
It's not bad
There is no consensus
It's cooling
Models are unreliable
Temp record is unreliable
Animals and plants can adapt
It hasn't warmed since 1998
Antarctica is gaining ice
View All Arguments...


Username
Password
New? Register here
Forgot your password?

Latest Posts

Archives

Breaking News...The Earth is Warming... Still. A LOT

Posted on 16 March 2012 by Glenn Tamblyn

In a previous post we discussed how the argument that the Earth has stopped warming doesn't make much sense because the people claiming this don't know how to draw their 'system boundaries' correctly - how can you work out whether the Earth is warming if you don't take account of all the places where it may be warming? And most commentary seems to only focus on surface temperatures. Which is only 3% of the Total Heat Content change.

So in this follow-on we would like to try and convey this warming from all the parts of the climate system in terms that we can all grasp. Grasp at an imaginative and visceral level. Because numbers, no matter how accurate, can be rather dry and hard to digest.

Do the math, Follow the heat....

Previously we showed the following diagram from the IPCC's 2007 AR4 report, highlighting the warming of the atmosphere and how small it was compared to the total warming.

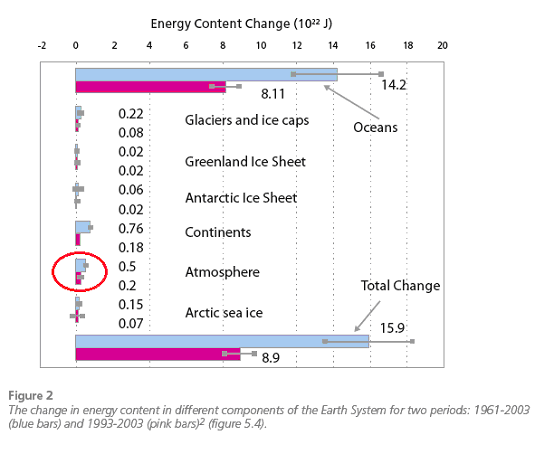
Now we would like to focus on the total figure at the bottom and try to convert that into numbers that we can all get our heads around. To try and make numbers with lots of zeroes meaningful.

The total heat accumulation in the environment from 1961 to 2003 is estimated as 15.9 x 10²² Joules. Got that? Is that clear in your head? Now read on...

Next, this graph from the National Oceanographic Data Centre, looking at Ocean Heat Content in the upper half of the ocean shows the following:

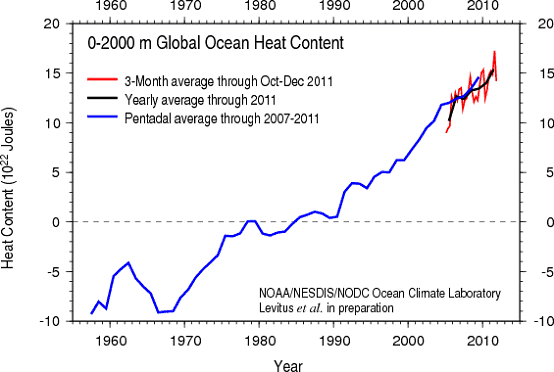
Roughly 5 x 10²² Joules since 2003. Since the IPCC's graph above up to 2003 shows that most of the energy from global warming is in the oceans, to a first approximation, Ocean Heat Content change since then is going to be close enough to the Total Heat Content change.

So, total heat content change from 1961 to 2011 - 50 years - is approximately 21 x 1022 joules. 

210000000000000000000000 joules

(a joule is 1 watt for 1 second. So a 100 watt light bulb will use 100 joules in 1 second)

A BIG number but somewhat unreal. So how much heat is this. What could it do? What is it in the real world, where we don't routinely look at numbers that big.

That is HOW Big...?

This is a rate of heating of 133 Terawatts. Or 0.261 Watts/m2

133 Terrawatts is 2 Hiroshima bombs a second. Continually since 1961.

Over 50 years it could heat around 500 trillion tonnes of water from 0 °C to 100 °C - around 870,000 Sydney Harbours.

If we now add in the heat needed to boil water dry once it has reached 100 °C and apply this to Sydney Harbour we calculate a very simple answer:

It would boil Sydney Harbour dry EVERY 12 HOURS!

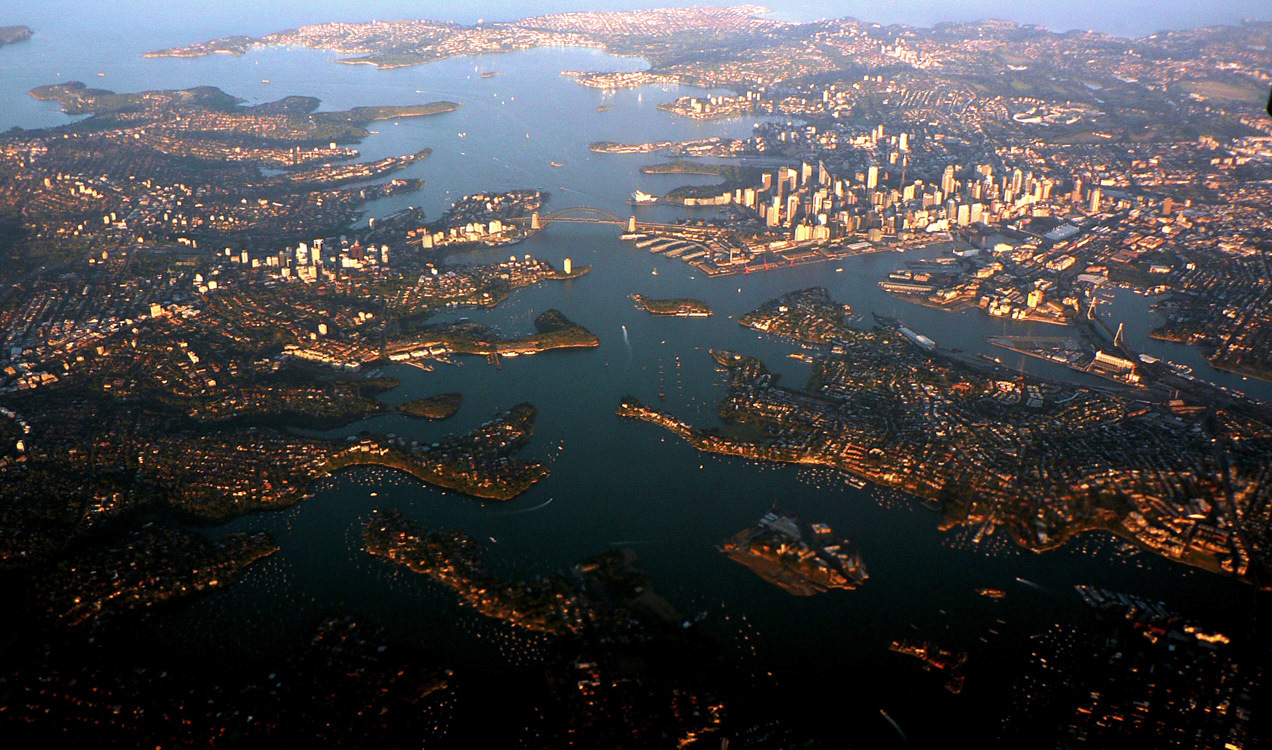
[EDIT. Mike 22 over at ClimateProgress found this cool image so I had to add it.]

One of the worlds great harbours boiling dry twice a day! And this has been happening for the last 50 years.

Imagine. You get up in the morning to go walk the dog before you go to work and there is Sydney Harbour - ferries, yachts, tourists. The Bridge (Australians still sometimes still call it the Coat-Hanger) and the Opera House. When you come home from work that night the ferries and the yachts are all sitting in the mud at the bottom of the now evaporated harbour. And this has been happening twice a day since before the Beatles first started making Hits.

But why don't we notice this? Because instead of all this heating happening just in Sydney Harbour, this is spread out through out the worlds oceans. And they are huge: approximately 2,300,000,000 times the size of Sydney Harbour. So heat that boils the harbour would only warm the entire ocean by a fraction of a degree. So we don't notice it much. Not that it isn't real, just that we don't notice it.

And if this much heat had instead gone into just warming the atmosphere - you know, that thing we call Climate - it would have raised Air temperatures by around 42 °C over the last 1/2 Century! When I was in kindergarten, in 1961, a hot day at the beach was 35 °C. Imagine that it was now 77 °C

So lets investigate...

Where could this heat have come from?

Since the extra heat, mainly in the the oceans is the equivalent of warming the atmophere by 42 °C, if this heat had been extracted from the atmosphere to warm the oceans we would have seen a drop in Air temperatures of a similar scale: ≈ 40 °C or so of atmospheric cooling. I think we can agree that this hasn't happened.

Similarly, if freezing of ice & snow was supplying heat that could warm the oceans - hard to imagine what the process might be but theoretically possible so we need to consider it - this would require the freezing of around 12,500 Billion tonnes of extra ice per year. In contrast actually 500 Billion tonnes of ice is melting each year. No, that isn't the source.

Could it be Geothermal heat - heat coming from inside the Earth?

Sorry, no, that doesn't work either.

The rate of geothermal flux to the surface, for the entire Earth is around 47 Terawatts. This comes from residual heat remaining from when the Earth was first formed and heat from radioactive decay of minerals within the Earth. And it doesn't change suddenly. What is sudden? To a geologist, 100,000 years is sudden.

But this flow is only around 1/3rd of what is needed to account for the increase in heat. And since this flux has been very steady for a very long time, it can't be the source of the change in heat content. Since it has been so constant for so long, the normal geothermal energy flow must be part of the normal heat balance. Therefore to account for the increase in heat content, the global geothermal heat flux would need to have increased by a factor of 4 over the last 1/2 century - 1 normal flow and 3 extra flows.

Suggest an idea like that to any geologist and just watch for the look on their face!

And now we have run out of terrestrial heat sources that might do the job. Since Geothermal Energy is the only energy source on the planet large enough to even conceivably supply this much energy and even it is too small, that leaves only one option left.

An imbalance in the heat flows to and from Space. Nothing else fits the evidence.

Lets be very clear about this: NOTHING ELSE FITS THE EVIDENCE

Not theory, not ideology, not political views, not internal variability, not questions over surface temperature records, not fudged or not fudged data, not hockey sticks or Medieval Warm Periods, or perhaps missing 'hot-spots'.

The Earth is experiencing an energy imbalance with space!

NOTHING ELSE FITS THE EVIDENCE.

So, this imbalance could be because the Sun is getting warmer. But it's not.  Over the last 1/2 century the Sun has, if anything, cooled slightly. See here, here, and here.

So what are left standing as viable explanations?

Greenhouse Gases and Clouds. Known Greenhouse Effect impacts of the GH gases, and possible changes in cloud behaviour. Exactly where most informed discussion of AGW occurs. The known impacts of GH Gases and the recognised uncertainties over cloud behaviour.

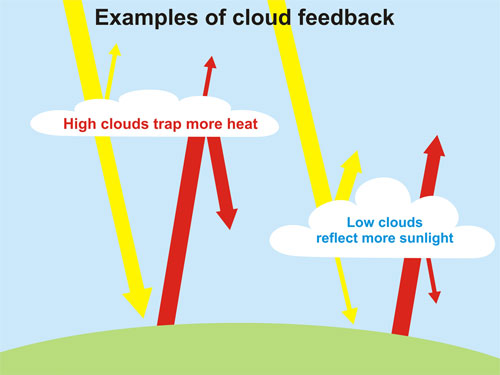
Some Cloudy thinking...

Lets look a little more closely at clouds. Clouds have both a cooling effect and a warming effect, depending on the type of cloud. See here and here. Low level clouds cause some cooling because they tend to reflect sunlight, while high level clouds cause some warming by trapping Infra-Red radiation.

However we can rule out the effect of low level clouds causing changes in reflection of sunlight as a cause. If the warming was because of this we would expect to see that Atmospheric warming would be strongest when the Sun is shining - Daytime & Summer. But its not - see here. Warming is happening just as much or more at Night-time or in Winter. In contrast the GH Effect operates 24/7. So low-level cloud changes can't be the cause. The evidence just doesn't fit.

So what we are left with are just 2 possibilities. High level clouds are increasing - relative to low level clouds, because it is the difference between their 2 effects that counts, or the GH gases are causing more of the GH effect.

Add to this that our understanding of the radiative effects of GH gases is based on masses of detailed data and is applied in many fields - Astronomy, Defence, Satellite observations of all types, Meteorology, even designing Micro-wave ovens - oh, and Climate Science.

Whereas the "It's the clouds" answer requires that certain types of clouds have become more common, but other types haven't. Without any viable mechanism to explain why.

It has been suggested that Cosmic Rays may influence cloud formation, and this is certainly a possibility although the evidence suggests the effect if it exists isn't very strong. And this theory is based on Cosmic Ray levels reaching the Earth varying over the 11 year Solar Cycle. So this can't explain continuous warming over nearly 5 Solar Cycles - there would need to be a long term trend in Cosmic Ray levels which isn't supported by the observations. And this theory predicts that the changes will occur in low-level clouds and as we discussed earlier, this sort of change is contradicted by the evidence about when the warming is happening.

So, we have a solid understanding of the effect of the GH gases, and clouds need to be doing some surprising flip-flops to be the only possible alternative explanation.

Can we totally rule out cloud flip-flops? No. But what are the odds that masses of detailed data are wrong but instead 'something else' is happening. Possible yes. But probable? Likely? No.

The number that changed the world....

All this can be deduced from one simple number - 21 x 1022 - that removes almost all other considerations from the table.

Its GH Gases or high level cloud changes. NOTHING ELSE FITS THE DATA.

When the first analyses of Ocean Heat Content calculated from old temperature data from the oceans where first published in the early 2000's, they were described as the 'Smoking Gun'. Because they were. They are the primary observational evidence for Global Warming and the human nature of it.

So think about this the next time you look at a picture of Sydney Harbour. Or any other harbour of your choice.

As it boils dry in your minds eye, ask 'Why?'. The possible answers to your question are very limited. Very limited indeed.

0 0

Printable Version  |  Link to this page

Comments

1  2  Next

Comments 1 to 50 out of 59:

  1. Thank you for pointing this out. I really wish Dr. Judith Curry would read this and stop using the skeptical meme of "no significant warming since 1998". It really does her reputation as a climate scientist a great deal of harm. I know she thinks she is talking about the troposphere, but as you've correctly pointed out, it's a small fraction of the total warming of the Earth's system. She claims the evidence for warming in other areas, especially the ocean, is not supported by the evidence. I can only wonder how she reaches this conclusion when the evidence is quite overwhelming the other way.
    0 0
  2. I think the position of the deniers is understandable in terms of the focus on surface temperatures. As far as they are concerned, soaking up heat in the ocean is part of the magical meechanism that holds the earth in a comfort zone. In parallel to their attitude towards extractive industries (coal, oil, fossil water), that these are "given" to us to exploit, the ocean and deep ocean's heat capacity is also a resource to be mined to compensate for increased energy being trapped on the earth.
    0 0
  3. From the article:

      "The total heat accumulation in the environment from 1961 to 2003 is estimated as 15.9 x 10²² Joules. ..." "So heat that boils the harbour would only warm the entire ocean by a fraction of a degree."

    Yes, and the IPCC tells us right off the bat in Chapter 5 of their AR4 report:

      "The oceans are warming. Over the period 1961 to 2003, global ocean temperature has risen by 0.10°C from the surface to a depth of 700 m." Executive Summary

    Not 0.09 or 0.11 but 0.10°C spread over 42 years, and expressed as 14.2 x 10²² Joules, it is very impressive. But 0.10°C isn't going to warm anything anywhere anymore than something less than 0.10°C.

    0 0
  4. Hi Glenn, I looked at other graphs from NOAA data centre where you courced your OHC. When you switch to "figures with error bars" and look at figure no 6 (Pentadal Global OHC (0-2000 meters)", you notice thet the error bars are quite small (rougly +-2E22J in 1960s and less than 1E22J in XXI century). +-2E22J is very accurate, considering the anomally of 2E23J from 1960 until today... I wonder how did they obtain such accurate estimate of OHC down to 2000m as far back in time while there is no direct temp data available. I understand they've been measuring temp only in 700m range. They've started measuring down to 2000m sometimes in 2005: that's why some short term average graphs of 2000m are shown for 2003-2011 only.
    0 0
  5. Steve Case But 0.10°C isn't going to warm anything anywhere anymore than something less than 0.10°C. That would only be true if the warming was uniform.
    0 0
  6. You do illustrate the relation correctly, but you somehow introduce an oblique into the preceding 1 Joule = 1 Watt.Second. Steve Case @3 Echoing Sceptical Wombat @5. You will note your IPCC figure of 142 ZJ for 700m depth is not much smaller than to 159 ZJ for 2000m. If you delve further into AR4 you will find the global surface temperature change commenserate with these ocean warmings is far from insignificant for climate or for us humans that exist within that climate.
    0 0
  7. Quite possibly my favourite post on SkS to date. Very sophisticated science broken down into layman's terms that utterly refute denier's substitute arguments while clearly explaining the sheer scale of the problem. The Sydney Harbour heating example was particularly effective I believe (even to one who has never visited that side of the world). All told an outstanding post Glenn, I'll be sharing it with a few skeptics I regularly come into contact with
    0 0
  8. Terra and tera aren't quite the same thing! Semantically, Earth's geothermal flux would be 1 "Terrawatt", which is currently 47 terawatts.
    0 0
  9. Wow. Thank you for an article than even a science/mathophobe like me could understand.
    0 0
  10. nitpick (echoing MA Rodger's comment): One Watt is 1 Joule per second (1 W = 1 J s-1) so the line with the lightbulb analogy needs to be retrofitted since I understand the point being made is trying to express a Joule in reference to Watts rather than the other way around. Overall: An excellent post that clearly and compellingly summarizes the very basic reason why we know global warming is real.
    0 0
  11. Steve Case @3. Maybe I misunderstand your point, but I don't think it's contended that the measured increase in ocean heat is going to heat "anything, anywhere, anymore". The issue is not that that the ocean is going to heat the rest of the system. The point (among others in the article, such as GHG's being the logical reason for heat retention in the system) is that the magnitude and trend seen in ocean heat content is consistent with the mainstream climate science contention that global warming has not "stalled" in any sense. So a "skeptic" showing a graph of surface temperature change with a flattish line through the last decade or so of data is disingenuous and misleading with respect to the surface temperature changes we should anticipate for the next decades.
    0 0
  12. R. Gates, I really wish Dr. Judith Curry would read this and stop using the skeptical meme of "no significant warming since 1998". It really does her reputation as a climate scientist a great deal of harm. Honestly, I think Dr. Curry's well past the point of caring about her reputation among mainstream colleagues. That boat sailed around the time she threw her weight behind Montford and Watts. While I don't think anyone's beyond redemption, I suspect Dr. Curry's going to have to do a lot more than acknowledge the obvious to earn back the respect she's forfeited.
    0 0
  13. Pretty unimpressed with the focus in this article. A lot of heat in total (so what, our civilization is on the surface skin); it's .1dC (using the joules scale to make it look heating-enhanced). As for the "Nothing Else Fits the Data" ... that's sending everyone out to come home on their shields - because the current pro-pollutionist angle is claiming the heat pulse is driven by diffusion from the Indian Ocean and cannot be accounted for in a GHG scenario. Why is the Indian Ocean Heating Consistently? http://www.springerlink.com/content/131362w27500712j/ There's focus and attention on the role of the Agulas System (the drain from the Indian Ocean to the southern Atlantic). http://www.sciencedaily.com/releases/2011/04/110427131809.htm If the goal is a decent global response to the pollution, it's damage in the places that matter - a few hundred meters below the surface to the top of the livable surface. Heat going to the vast deep oceans is a slam-dunk win for the pro-pollutionists with "see, it's sequestered naturally."
    0 0
  14. This is a rate of heating of 133 Terrawatts. Or 0.261 Watts/m2 0.261 W/m^2? Isn't that too little? Too little because Hansen expected a warming rate of roughly 0.8W/m^2 and Trenberth estimated it to be 0.9 W/m^2 based on satellite measurements of ingoing and outgoing radiation.
    0 0
  15. From Peru - that's rather outdated work you are referring to there. See SkS post: Search For 'Missing Heat' Confirms More Global Warming 'In The Pipeline'. Both of those earlier estimates of the top-of-the-atmosphere (TOA) energy imbalance were climate-model based. Based on measurements, Loeb 2012 has the imbalance at 0.5 (±0.43) W/m2, and Hansen (2011) has it at 0.58(±0.15)W/m2. But it is important to note the time frames involved. Glenn's figure is for 1961-2011. Note figure 2 in the post, especially the period from 1961-1990. Clear now?
    0 0
  16. Owl905 - "Pretty unimpressed with the focus in this article. A lot of heat in total (so what, our civilization is on the surface skin)" Glenn makes a very important point here - heat is still going into the oceans. In other words the largest component of global warming has not skipped a beat. See figure 2. It's obvious that the rate of ocean heating has increased over the last two decades. That does not mean all that heat will remain forever buried in the deep ocean - that is a peculiar idea that you seem unable to shake, no matter how many times it is corrected. You are wrong. The surface layers of the ocean are gaining heat too. That heat has been buried in the subsurface ocean because of the La Nina-dominant trend over the last 5-6 years. That, however, is unlikely to last too much longer. The upward arm of the solar cycle and a return to El Nino dominance will likely see rapid warming over the next 3-5 years.
    0 0
  17. I have this comment as a standard response to all this "no warming" nonsense: I think it is helpful to talk about global heating, i.e. the excess energy from the planetary energy budget that ends up as thermal energy which heats the oceans, melts ice, heats land and soils, and heats the atmosphere. In order to talk about the massive amount of thermal energy that is heating the planet, I think relating the annual thermal energy being absorbed by the planet to the annual thermal energy releasing by 'mining' and burning fossil fuels is the best way to show the significance of the global heating. When fossil fuels are mined and burned, the annual fossil fuel thermal energy (FFTE) released is about 4x10^20 J annually. Let us express all the other heating as multiples of this annual FFTE. Recent annual average SLR due to ocean water thermal expansion is using about 20 to 25 FFTE. Total land ice melt from ice sheets and glaciers as well as the heat absorbed by the net melting of the Arctic ice cap is about one FFTE. Land surfaces are heating up by approximately a half of FFTE released by burning fossil fuels. By contrast the entire atmosphere heating at a rate of 0.2K per decade uses only one quarter of the annual FFTE released by burning fossil fuels.
    0 0
  18. The other thing to keep in mind; during La NIna episodes, the planet is heating faster than during El Nino episodes, since the outgoing longwave radiation from the Pacific Ocean declines during La Nina episodes. So in 2011 and so far in 2012, planet Earth heated much faster than the average heating rate discussed in this post. The global heating rate in 2011 was likely +50% to +100% higher than the average global heating rate over a longer time period.
    0 0
  19. Finally, a comment on the title of this post. It really shouldn't say the planet is warming... the measurements and data discussed in the post are units of heat, not temperature. The post should be titled "Breaking News...The Earth is Still Heating... And heating A LOT!"
    0 0
  20. zinfan94, just to clarify, I think the amount of energy released by FF is largely irrelevant, (apart from a comparison) - it would would have normally just radiated away and any heating would be local, temporary and last as long as the fuel lasts. It is the unfortunate consequence of releasing vast amounts of CO2 that is causing the Earth to warm up, looking for a higher thermal equilibrium.
    0 0
  21. The author forgot one very important, and influential terrestrial heating source: electricity consumption. Electricity consumption has increased ~11,000 TWh's since 1980. This means more night-time lights, more winter heaters. This is going to have an influence on night-time and winter temperatures. Even if only 1% of that electricity is converted into heat (light and radiative heat) then that's a massive amount of heat added to the system. Source of consumption figures: http://www.world-nuclear.org/uploadedImages/org/info/world_electricity_consumption_region.png
    0 0
    Moderator Response: Nope. See It’s waste heat.
  22. Rob Painting: Hansen 2011 is this paper? Earth's Energy Imbalance and Implications If there is no link to a paper, would be better give the title of it, not only the autor and date. The title is much better for a google search than the author + date info.
    0 0
  23. You think Climate science is hard. Thats nothing compared to proof-reading: Nits picked - Joules are wattts x seconds, tera not terra. The thrust of this and the previous articles is focusing on the following points. 1. We can't judge what is happening to the Earth by just looking at the surface. 2. The Earth is still accumulating heat. It hasn't stopped as some claim, which would be quite strange given the continuous nature of what is driving it 3. The magnitude of the heat accumulation in the ocean logically precludes most explanations for that heat accumulation. chriskoz @4. Thats why I preferred to use the IPCC graph which shows error bars for most of the estimates. As far as how they could estimate below 700m, its not true that there is no data. Programs using measurement platforms lowered over the side of research vessels give some data all the way to the sea floor. But they don't have the coverage of the XBT system let alone the ARGO system. But they do allow some estimation of the deeper water, with reasonable error margins. Hence the error bars on the IPCC graph. Apparently there is a paper in production that will explain the methodology better. Should be an interesting read. From Peru. @14 Rob is correct. The forcing is growing over time as we add more CO2 so the total accumulated heat is the roughly the integral of the forcing over time. And this is then moderated by how surface temperatures change in response. During the past decade or so where sequestration of heat into the middle ocean seems to have restrained surface warming, the forcing will have grown more rapidly (apart from the uncertainties about aerosol effects) where as in the previous decade where surface warming was greater the net forcing may not have grown as fast.
    0 0
  24. owl905 @13, That depends how intelligent is the denialist you talk to. The article is very good in talking to a reasonable person who understands the basics of energy balance and the fact that this enormous heat must escape into the space sooner or later to put the thing back into equilibrium. So, the heat must be eventually transferred to the atmosphere in order to escape as an increased IR. Because of water's high heat capacity, it is better to talk of GW in terms of OHC increase rather than LST or SST increase where temperature signal is prone to relatively large and decade-lasting noise like ENSO. OHC signal is much clearer and will be even better as we improve the OHC measuring techniques in the future. On the other hand, the silly denialist, those "see, it's sequestered naturally" arguers, are just as mentioned by Dave123@2: hard to convince by this argument. For those, you have to use other, simpler arguments. We can only hope that the silly minds will become rarer in the future as people will gain better understanding climate science.
    0 0
  25. @chriskoz - (-snipYour response, like Rob Painting, simply doesn't get it. Your tone has an air of conceit similar to his use in discussions in threads past.Hidden obnoxious comment here-) The claim about the inevitability of escape into space is both technically incorrect about totality, and reduced to meaningless if the return from the its immediate destination is millennium in time-frame. It is not better to talk about AGW in terms of OHC increase. It is technically-balanced ivory-tower nonsense. (-snipYour comment referring to me as a "silly denialist" is incorrect, vulgar and personally insulting.Hidden obnoxious comment here-)
    0 0
    Response:

    [DB] Please cease looking for provocation where none is implied or intended.

    Suggestion:  Try asking for clarification on a remark before assuming the worst.

    Please note that posting comments here at SkS is a privilege, not a right.  This privilege can be rescinded if the posting individual treats adherence to the Comments Policy as optional, rather than the mandatory condition of participating in this online forum.

    Please take the time to review the policy and ensure future comments are in full compliance with it.  Thanks for your understanding and compliance in this matter.

    Inflammatory rhetoric snipped.

  26. Mod @21 Your article is ridiculous. "Or putting it in plain English, the amount of heat being added to our climate." The GHE does not "add heat" to the climate. It stops heat from leaving. But that's beside the point. Adding 11,000 TWh's of electricity across the globe WILL alter the numbers. Even if it's only 1% that is converted to heat, there's 110 TW's of the claimed 133 TW's in the article. You can't say it doesn't have an effect as that defies logic.
    0 0
    Response:

    [DB] Your claim is fully addressed on the It’s waste heat and on the interminable Waste heat vs greenhouse warming thread. Many.Times.Over. 

    Take it there or let it go.

  27. Glenn Tamblyn @23 Spot on!! Proof reading can send anybody potty. zinfan94 @17 & andylee @20 The heat released by FF burning as a function of the heat captured from CO2 released by that burning of the FF depends on the fuel being burnt. The CO2 that remains in the atmosphere from burning coal (coal provides energy solely from burning carbon->CO2) captures the same energy in the atmosphere as from the burning in about 9 months. For gas (which includes more hydrogen than oil) the period is nearer 18 months. For your average Fossil Fuel the period is about a year & the energy released from FFs is currently about 2% of energy captured by FF released CO2 (we'll ignore other GHG here). So as andylee @20 says, it "is largely irrelevant."
    0 0
  28. Dale - What the moderator was directing you towards is an entire thread on waste heat, the byproduct of our energy use, the entropy of our energy use. That's all of it - transportation, electricity, etc. That energy represents 1% of that entrapped by increased GHG's, hence while it is a component of warming, it's small enough to be very minor in effect - a total of perhaps 0.01 C since the Industrial Revolution, small enough that if this was the only warming effect we probably wouldn't notice it.
    0 0
  29. "You think Climate science is hard. Thats nothing compared to proof-reading: Nits picked - Joules are wattts x seconds, tera not terra. " Wattts? :) (couldn't resist pointing this out in a sentence that points out that proof-reading is hard!)
    0 0
    Moderator Response: Whattttt. Are youyouyou makkking fun ooooff me now?
  30. Over here in, oh I'm not going to say where, but you can probably guess, we're making a lot of noise about 'Seawater air-conditioning'. Where you pump up deep water (4 C, as y'all know, yes?), heat exchange it, and cool an entire downtown area without burning fuel. Early proponents being Cornell and the City of Toronto (not near the ocean but near large bodies of water). So, the inevitable complaint from, perhaps not surprisingly, the left, is about how you're going to warm the ocean with all that heat you're dumping into it. It makes me want to laugh (because its easier and more fun than crying). And, as most people reading this article should now know, wrong. The CO2 you DON'T liberate by seawater air-conditioning would do much more to 'blanket' the oceans and thus heat them, than the puny contribution of your sweatshop-overworked downtown. And, besides, I also like the idea of dumping my downtown heat into the worlds largest radiator, to be communicated to deep Space, probably saying, in Dr Seuss fashion, 'We Are Here!'.
    0 0
  31. Dale: you're mixing TW (teraWatts) and TWh (teraWatt-hours). They are not the same thing. A TWh is one TW for one hour (i.e. 1TW*3600 seconds). It is an absolute quantity of energy, whereas TW is a rate of energy transfer. One TW over a year (or decade) dwarfs a TWh. It has been suggested you go to the "It's waste heat" discussion. I'd suggest doing a little reading (and learning) before posting again.
    0 0
  32. Dale @21 11,000 TWh is the rough increase in total net electrical energy generated. However this is a per annum figure. Since there are 8766 hours in a year this is actually an increase of 1.25 TW. since 1980. However this is net generation - Input energy in the fuel might give us 3-4 TW change. Factor in other uses such as oil for transport, mechanical work, direct heating etc and it may be as high as 10-15 TW. I have heard a figure quoted (don't have a source for it) that total human energy usage is 40% of geothermal energy which would put the current total at 18.8 TW. So still much less than 133 TW. And the 133 figure is the average over 50 years, not the current figure. From Hansen, Trenberth etc, the current figure based on an approximate value of 0.5 W M^2 would be 255 TW vs 18.8. This might alter the numbers I have given somewhat but not the overall conclusions. Warming is still happening and it can't be a terestrial source. This is why I didn't include these extra numbers. They would have complicated a post that I wanted to keep simple, and not alterered the basic conclusion.
    0 0
  33. owl905 @25, "...claim about the inevitability of escape into space is both technically incorrect about totality, and reduced to meaningless if the return from the its immediate destination is millennium in time-frame" I disagree. Firstly, most of the heat is going into the 0-700m. And it exchanges with atmosphere as the result of welling in a decal time-frame. Hansen 2005 estimated the climate lag time is between 25 to 50 years. I think this estimate still stands. Secondly, even if some of that heat goes into deep ocean and its eventual release to the surface may take centuries (maybe millennia according to your claim), there is no reason to ignore it. Even if not felt as elevated surface temp, it may have some undesirable effects such as SLR due to thermal expansion or decreased ability by the ocean to absorb CO2. Finally, your last (left-unsnipped) remark: "It is not better to talk about AGW in terms of OHC increase. It is technically-balanced ivory-tower nonsense" not only bears somewhat unnecessarily emotional language but may also be your misunderstanding. I see GW in a larger timeframe (note that I did not use AGW acronym contrary to your remark) and for me a warming imbalance in the system that lasts centuries/millenia is still a fast event in the geological timescale. Also, when I talk about something "global" I really mean "affecting the globe" and not just its surface as you seem to imply in your emotional remark.
    0 0
  34. The post says: "So what we are left with are just 2 possibilities. High level clouds are increasing - relative to low level clouds, because it is the difference between their 2 effects that counts, or the GH gases are causing more of the GH effect." It seems to me that there are two supposed effects of clouds: 1) Neutralizing the warming effect of GH gases 2) Causing the observed warming It also seems to me that clouds would have to have both these effects simultaneously, to explain GW. Am I right in suggesting that? And, is this actually possible?
    0 0
  35. Some of the confusion on the thread with power (or energy flows, or even energy flow density) versus total energy (heat) could be avoided if we kept to using heat units. I really dislike the focus of talking about energy balances in terms of Watts per square meter, for example. This is misleading because of significant variations in energy flows around the planet and from year to year. I am a chemical (process) engineer, and we do energy balances all the time, so the focus on heat transfer and heat units comes naturally to my thought process. Thats why I prefer to think of global heating. I like to compare to the total energy released by burning fossil fuels, because I can relate to this. I think of all the power plants, with their massive heat sinks; all the refineries that consume about 10% of energy moved through the refinery, and all the engines on all the cars, all the jet engines on all the planes, all the heaters and furnaces on all the houses and buildings, with all the hot exhaust heat, and so forth... And if I add all that up, its still only a few percent of the heat being absorbed by the planet due to the imbalance in the planetary energy budget caused by greenhouse gases. Then when I think of this massive energy imbalance, and realizing only a small portion (about 1%) of this massive imbalance currently heats the atmosphere and raises surface temperatures; then I can start to recognize what a dangerous and risky position mankind has created by ignoring greenhouse gas emissions. The heat sinks (ocean, ice packs, land ice, and continental land/waters) are keeping the planet from seeing much faster atmospheric temperature rises. Only a small reduction in the ability of the heat sinks to store heat, would drive atmospheric temperatures much higher. We are betting our lives on the untested assumption that the heat sinks will continue to absorb 99% of the energy imbalance. Then I can realize that something similar is happening with the CO2 sinks. Carbon dioxide levels could start rising much faster if the uptake in CO2 by the oceans and the continental soils slows... Again we are betting our lives on the untested assumption that these sinks will continue to absorb about half of our fossil fuel CO2 emissions. Humans are taking a risky bet that the planetary processes for sequestering heat and carbon dioxide will not change, even as the planet heats and carbon dioxide concentrations rise. If the sinks do begin saturating, and either CO2 levels climb faster, or the heat ending up in the atmosphere increases, the forecasts by climate scientists of future global warming, will be too low. In my opinion, the issues regarding heat and CO2 sink saturations, along with other possible tipping points, are the "elephant in the room"; difficult to talk about or quantify, but potentially what could kill us in the end.
    0 0
  36. Brilliant. Glenn I don't know what your background is but you obviously have a very clear grasp of the physics here because this is the best explanation of how the increase in thermal energy being retained by the planet due to additional green house gases being added by humans that I can recall reading. It is simultabeously simple, concise, comprehensive and accurate. Thanks - I'm keeping a copy on my system as reference to share and use (attributed of course)
    0 0
  37. Excellent to see the scale of this problem brought down to something more of us may intuitively grasp; the result with Sydney Harbour is pleasingly accessible. We're wretched at dealing with large numbers; I've often thought that much of the communications problem with our gassy dilemma is down to our poor fitness for thinking about "billions." Ten fingers and a horizon a few miles away just doesn't equip us very well.
    0 0
  38. Seeking Answers The difference is in the type/altitude of the clouds. Low level clouds are dense so reflect sunlight back to space, thus having a cooling effect. In contrast their contribution to the GH effect is small because, being closer to the ground they are at a temperature closer to the surface temperature. So when they absorb IR radiation then reradiate it, they are doing it at a temperature close to surface temperature. High clouds in contrast tend to be much thinner. So they are poorer reflectors of sunlight. But they are still dense enough to absorb IR. And being higher and colder, when they re-radiate that IR it is at a loer total energy because of their lower temperature. Thus they restrict energy flow to space and contribute to the GH effect All told, clouds (and the atmosphere itself) reflect around 23% of incoming solar radiation. And low level clouds contribute about 25% to the Greenhouse Effect. So it is the relative change in the two different types that would have an impact. Roughly equal increases or decreases of both types would tend to cancel out.
    0 0
  39. doug_bostrom Agreed. Being able to assimilate quantitative information as a routine part of daily life is a relatively rare trait in people. Its basic psychology that although most of us learn our arithmatic at school, we don't treat it as a toolbax for looking at all facets of life. We tend to compartmentalise quantitative thinking as to be used for 'numbers stuff', not for all of life. And it certainly isn't most peoples default mental mode. So doubly so when we then need to deal with number of a size that are outside our experience. Most people probably then fall back on using more qualitative reasoning processes instead rather than trying to engage with the quantitative. This was encapsulated wonderfully in an interview I read years ago in New Scientist with a Professor of Psychology - I wish I could find the article now or remember her name. However, she used the expression 'Insensitivity to Magnitude' to describe much of our mental processes. For most of us most of the time, qualitative style thinking processes are the norm and we have to stretch a bit to apply quantitative reasoning. This is not a criticism of people, just an observation of the nature of human psychology. But in rare situations such as AGW, where we need most people to 'buy in' to understanding it, this aspect of human nature has a serious cost.
    0 0
  40. zinfan94 @35 I agree. Way to much out-of-sight, out of mind stuff. I have just seen 'John Carter' at the movies so it set me thinking. Imagine a nearly desert planet, no oceans. Then add the extra CO2 we have done. There would be no question that we were warming the planet - it would be far more visible and obvious. Our Blue-Green planet may be wonderful but it poses the most sever cognitive challenge to us.
    0 0
  41. A small correction. I gave a figure for the worlds oceans as being around 2,300,000 times the size of Sydney harbour. Actually the figure is more like 2,300,000,000 times larger (2,313,167,259 times actually). I screwed up when combining one figure in cubic metres and another in cubic kilometers. Note to self, turn thousands separators on in Calculator, helps with magnitude checks. Thanks to nuclear_is_good for the spot.
    0 0
  42. "Its basic psychology that although most of us learn our arithmatic at school, we don't treat it as a toolbax for looking at all facets of life. ... doubly so when we then need to deal with number of a size that are outside our experience." School arithmetic! I find tutoring primary aged children who are 'worst' at simple calculation are the ones who have the most trouble when asked to "see" numbers in the world around them. Car wheels, bird wings, fingers & toes. I'm pretty certain that the older ones who come to me for algebra, totally unable to write exponents, let alone understand them, would have been unable to name 2 as the relevant number for bicycle wheels a few years earlier. As for counting zeroes .... (but even the best of us can have trouble, sometimes.)
    0 0
  43. Glenn Tamblyn @38 A long shot, but neuro-scientist Talia Sharot had a book out last year that got her into New Scientist. Coincidentally, she appeared on BBC 2's Horizon last Tuesday. This i-player link sadly does not work worldwide (perhaps even extra-UK). Sharot was featured in the programme (about 20 mins in) quizing folk while watching their brains to find out why their responses were so stupid. To make this comment more meaningful for those unable to access BBC i-player, it goes something like this:- Subjects were asked 80 questions (this is a test from psychology) about chances of them in future suffering something bad, a broken bone, cancer etc. After answering, they were given an answer based on real-life data which is acceptably a more accurate figure. Afterwards they were asked the same 80 questions again. Where they had over-estimated the bad outcome first-time-round, the happier 'accurate' data-based figure tended to be their answer second time round. But where their 'less accurate' initial response gave the happier answer, the second response tended to ignore the 'accurate' data-based but unhappy answer. Sharot's work shows the bit of brain that deals with negativity doesn't work so well in humans. Humans have a built-in optimistic "yeeehaaaa" bias.
    0 0
  44. owl905 #25. Huge oceans slow down a rise in temperature but later slow down a fall. Also, the inertia of the oceans might possibly mean we overshoot the equilibrium value by a larger amount (if not, we simply exponentially decay towards it) since everything we gain today we pay for tomorrow. Deep oceans vs shallow oceans may not change the equilibrium value by much (if by anything), and it will mean "momentum" we have to stop tomorrow. Are we going to leverage the extra time the oceans are giving us today or are we going to let a much larger avalanche accumulate for our descendants? I foresee a future where we find many ways to control the climate temperature. This is a great time (say the next 5 decades) to figure out how to cheaply lower the GHE since it is easier to work at this solution under current temperatures than under the hotter ones of tomorrow.
    0 0
  45. Excellent piece, Glenn! If reasonably open-minded people with some science background read this, it’s hard to understand why they should not be convinced the Earth is still warming, and that an increased greenhouse effect is the only possible explanation. Maybe I will translate it to Norwegian, but in order to make it more interesting for Norwegian readers, I would like to add a paragraph about how fast the increasing heat content could boil away lake Mjøsa, the largest lake in Norway. The volume of lake Mjøsa is about 56 cubic kilometres, and its average temperature is close to 5°C. On that background I would be grateful if someone could confirm that the following calculations are accurate: The heat capacity for water is 4.2 J/g/K, so it should take 4.2 x 95 = 399 joules to heat each gram of water in Mjøsa from 5°C to 100°C. According to Wikipedia, the water’s heat of vaporization is 2257 joules per gram at the boiling point, so it should take 399 + 2257 = 2656 joules to heat each gram of Mjøsa to 100°C and then boil it away. The total amount of water in lake Mjøsa is 56 km3 x 1 billion x 1 million = 5.6 x 10^16 cm3 or grams. Boiling all this water away once should therefore take 2656 x 5.6 x 10^16 = 1.49 x 10^20 joules. If the total heat content change the last 50 years is 2.1 x 10^23 joules, this is enough to boil away lake Mjøsa 2.1 x 10^23 / 1.49 x 10^20 = 1409 times. And if the present energy imbalance is 0.58 w/m² or 2.96 x 10^14 watts globally (twice the average for the last 50 years), this should be able to boil away lake Mjøsa in a little less than 6 days! Is this calculation more or less correct, or have I missed something here?
    0 0
  46. Glenn I agree great article. I shared it at SkepticForum and our old pal X had a few things to say. In particular, I'm curious how you would reply to this (at #21): Tamblyn seems to be making the claim that ocean heat content is the only significant measurement, despite that scientists do not have a very good understanding of the ocean's heat content. Trenberth is at least honest enough to admit he does not know where the heat went (assuming it exists and went somewhere).
    0 0
  47. Thank you, Glenn, for an informative, but alarming, article, and thanks to the commenters for their further refinements and contributions. I have one question: haven't meteorologists, atmosphere scientists, and climate scientists made measurements of the ratios of low clouds to high clouds over the past 50 years, or at least over recent decades? I'm surprised that data relevant to calculating the contributions of clouds to global warming do not appear to be readily available.
    0 0
  48. The escalator graph seems to be a reflection of periods when there is more mixing in the ocean, absorbing heat and allowing the atmosphere to cool a little and periods when mixing is less (el Nino conditions?) and the atmosphere temperature jumps. We should be due for an El Nino very soon and it will likely fall within the present, fairly weak solar maximum. Perhaps the next upward lurch in the Escalator graph will convince the skeptics but I doubt it. Perhaps the accompanying Arctic sea ice melting will be more convincing. What happens if we melt enough of the Greenland ice to shut down the overturn by the Gulf stream. That could be interesting.
    0 0
  49. Am I right it's more than 2300 tonnes of heat?
    0 0
  50. william, you ask
    What happens if we melt enough of the Greenland ice to shut down the overturn by the Gulf stream.
    Could you explain that process to a complete layman, please? I had not realised that the one could cause the other.
    0 0

1  2  Next

You need to be logged in to post a comment. Login via the left margin or if you're new, register here.


The Consensus Project Website

THE ESCALATOR

(free to republish)


© Copyright 2024 John Cook
Home | Translations | About Us | Privacy | Contact Us