


Latest Posts
Archives
|
 |

Comparing volcanic CO2 to human CO2
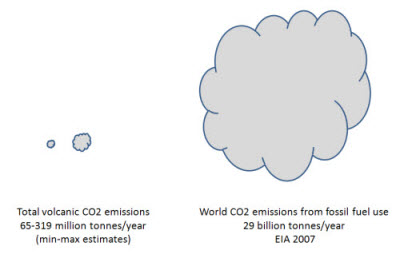
Posted on 27 August 2010 by Andy SkuceThe solid Earth contains a huge quantity of carbon, far more than scientists estimate is present in the atmosphere or oceans. As an important part of the global carbon cycle, some of this carbon is slowly released from the rocks in the form of carbon dioxide, through vents at volcanoes and hot springs. Published reviews of the scientific literature by Moerner and Etiope (2002) and Kerrick (2001) report a minimum-maximum range of emission of 65 to 319 million tonnes of CO2 per year. Counter claims that volcanoes, especially submarine volcanoes, produce vastly greater amounts of CO2 than these estimates are not supported by any papers published by the scientists who study the subject.
The burning of fossil fuels results in the emission into the atmosphere of approximately 30 billion tonnes of carbon dioxide per year worldwide, according to the EIA. The fossil fuels emissions numbers are about 100 times bigger than even the maximum estimated volcanic CO2 fluxes. Our understanding of volcanic discharges would have to be shown to be very mistaken before volcanic CO2 discharges could be considered anything but a bit player in contributing to the recent changes observed in the concentration of CO2 in the Earth's atmosphere.
Volcanoes can--and do--influence the global climate over time periods of a few years but this is achieved through the injection of sulfate aerosols into the high reaches of the atmosphere during the very large volcanic eruptions that occur sporadically each century. But that's another story...
Recommended further reading on CO2 and volcanoes can be found here: Terry Gerlach in Earth Magazine ; USGS
This post is the Basic version (written by Andy S) of the skeptic argument "Volcanoes emit more CO2 than humans". We're currently writing plain English versions of all the skeptic rebuttals. If you're interested in helping with this effort, please contact me.  0 0  0 0
Printable Version | Link to this page
thpritch: Thanks, I have fixed the link.
Andy
 0 0  0 0 0 0
Wow! RSVP are you trying to be sarcastic or are you putting down your "skeptic" mantle long enough to admit we have some serious issues ahead of us?!
0 0
Thanks, RSVP. If we tried to keep this up over the long term, I think the first limit we'd run into would be a shortage of burnable carbon.
But in any case, yes, I agree that the graphs show that we (or, more particularly the next couple of generations) are in for a wild ride.
I wish we had started dealing with this problem two decades ago. Somehow it just seems intuitive to me that when you're trying to change a system with a lot of momentum, it's easier to start early with a more gradual change than to wait until the last minute and have to make more radical adjustments. Right now the line on the far-right side of those two graphs seems to be headed implacably upward.
0 0
Ned,
Before reading your reply #15, (and as I was driving around town), I realized that while fossil fuels are bad news, they will ironically be counted on for transitioning to alternative technologies, and that this situation may not even be something that could have been avoided.
actually thoughtfull
No sarcasm intended... lets not confuse a little global warming with assured oxygen deprivation.
0 0
Further to Ned and RSVP's thoughts, I think of fossil fuels somewhat as a class 1 lever with the advantage end becoming shorter even as the load becomes heavier. Maybe the GHG problem is the fulcrum being moved in a way that makes supporting the load even more difficult? "Snap" goes the metaphor but we should acknowledge we need to slip something else under the load, soon, or it'll fall. The fossil fuel lever is a tool to be used for temporary application, best put away, it's not a cantilever we can use for permanent structural support.
0 0
Cloarec, M.-F. L. and Marty, B. (1991), Volatile fluxes from volcanoes. Terra Nova, 3: 17–27. doi: 10.1111/j.1365-3121.1991.tb00839.x
Feedback between deglaciation and volcanic emissions of CO2
harvard.edu [PDF]P Huybers, C Langmuir - … Letters, v286 (3-4), p479-491, 2009 - environment.harvard.edu
EMEP/EEA air pollutant emission inventory guidebook 2009
0 0 Moderator Response: Please pay attention to comments policy:
Links to useful resources are welcome (see HTML tips below). However, comments containing only a link will be deleted. At least provide a short summary of the content of the webpage to facilitate discussion (and show you understand the page you're linking to).
Naked and/or incomplete citations without any personal contribution are not helpful to discussion.
The second article TOP referred to can be downloaded here.
The paper discusses how deglaciation can temporarily speed up the rates of volcanic activity, as a result of the reduced ice load on the volcano.
The concluding sentences of the paper help put the magnitude of this effect into the perspective of modern, man-made changes in atmospheric CO2 concentrations.
Finally, we estimate that volcanoes emit an excess 0.1 to 0.5 Gt of CO2 during deglaciation. Humans presently emit ~30 Gt of CO2 per year. If volcanic emissions influence the course of glacial/interglacial climates, it gives us pause that the accumulated volcanic CO2 emissions during ~10,000 years of deglaciation would, at current rates, be replicated by only a century of anthropogenic emissions.
0 0
If every man, woman and child on the planet plants 5 trees a year the fossil fuel CO2 problem is fixed. Consider that each tree grows to 1 ton in ten years.
0 0
Great, TOP. How many trees have you planted? Your immediate family? Friends? Coworkers? Out of your first circle of acquainted men, women and children, how many or what fraction have planted 5 trees this year?
0 0
TOP: According to NASA there are about 400 billion trees on the planet. If 7 billion of us each planted 5 trees per year, then over 12 years, we'd have doubled that figure. That's a lot of grazing land, crop land or desert to convert to forest in such a short time. And I wish that each of the trees I planted recently would grow to be a ton in ten years - and I live in a temperate rainforest climate zone. For now.
0 0
I planted eight trees about 15 years ago. Only one of these is still alive. Meanwhile, two or three autochthonous species sprang up where nature dictated. The "CO2 problem" is the unnatural "population problem" that CO2 has amplified. Arguments based on per capita oil consumption are only part of the story. Its not an issue about energy or heat, as much as taking stock in what nature is able to deliver.
0 0
You need to be logged in to post a comment. Login via the left margin or if you're new, register here.
|
|


The Consensus Project Website
THE ESCALATOR

(free to republish)
|


 Arguments


 Figure 1: CO2 levels (parts per million) over the past 10,000 years. Blue line from Taylor Dome ice cores (NOAA). Green line from Law Dome ice core (CDIAC). Red line from direct measurements at Mauna Loa, Hawaii (NOAA).
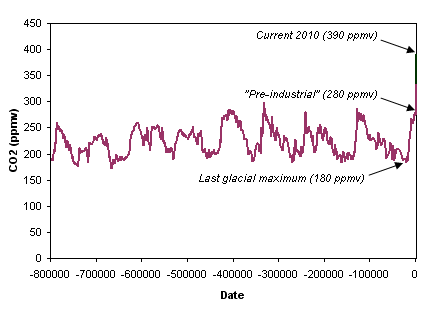 Figure 1: CO2 concentration over the past 800,000 years from ice cores at Dome C, Vostok, Taylor Dome, and Law Dome.


Comments