Climate Science Glossary

Term Lookup

Enter a term in the search box to find its definition.

Settings

Use the controls in the far right panel to increase or decrease the number of terms automatically displayed (or to completely turn that feature off).

Term Lookup

Settings


All IPCC definitions taken from Climate Change 2007: The Physical Science Basis. Working Group I Contribution to the Fourth Assessment Report of the Intergovernmental Panel on Climate Change, Annex I, Glossary, pp. 941-954. Cambridge University Press.

Home Arguments Software Resources Comments The Consensus Project Translations About Support

Twitter Facebook YouTube Mastodon MeWe

RSS Posts RSS Comments Email Subscribe


Climate's changed before
It's the sun
It's not bad
There is no consensus
It's cooling
Models are unreliable
Temp record is unreliable
Animals and plants can adapt
It hasn't warmed since 1998
Antarctica is gaining ice
View All Arguments...


Username
Password
New? Register here
Forgot your password?

Latest Posts

Archives

Has Arctic sea ice returned to normal?

What the science says...

Select a level... Basic Intermediate

Arctic sea ice has been steadily thinning, even in the last few years while the surface ice (eg - sea ice extent) increased slightly. Consequently, the total amount of Arctic sea ice in 2008 and 2009 are the lowest on record.

Climate Myth...

Arctic sea ice has recovered

"Those who have been following NSIDC and JAXA sea ice plots have noted that this has been an extraordinary year so far, with Arctic sea ice hitting the “normal” line on some datasets. ...

As of today, JAXA shows that we have more ice than any time on this date for the past 8 years of Aqua satellite measurement for this AMSRE dataset." (Anthony Watts, 22 April 2010)

When people talk about the state of Arctic sea ice, they most commonly refer to sea ice extent. This is the area of ocean where there is at least some sea ice (the most common cut-off is 15%). Sea ice extent shows a strong seasonal cycle as Arctic ice melts in the summer, reaching a minimum in September, then refreezes in the winter, peaking in March. Temperature is the main factor driving changes in sea ice extent, although other factors like wind patterns and cloudiness play a part. While sea ice extent has been steadily declining in recent decades, it fell to a record low in 2007 due to a combination of factors.

 Click to enlarge
Figure 1: Sea ice extent with trend from 1953 onwards.

Sea ice extent gives us a reasonable indication of the amount of Arctic sea ice but does have its limitations. Extent tells us about the state of the sea ice at the ocean's surface, not what's happening below. A better metric for the total amount of sea ice is, well, the actual total amount of sea ice, measured by sea ice volume. Satellite radar altimetry (Giles et al. 2008) and satellite laser altimetry (Kwok et al. 2009) find that Arctic sea ice has been thinning, even in 2008 and 2009 when sea ice extent showed a slight recovery from the 2007 minimum. So while some claimed Arctic sea ice was recovering after 2007, the total volume of Arctic Sea ice through 2008 and 2009 were the lowest on record (Maslowski et al. 2010, Tschudi et al. 2010).

Line chart showing a decreasing trend for arctic sea ice from 1980-2014
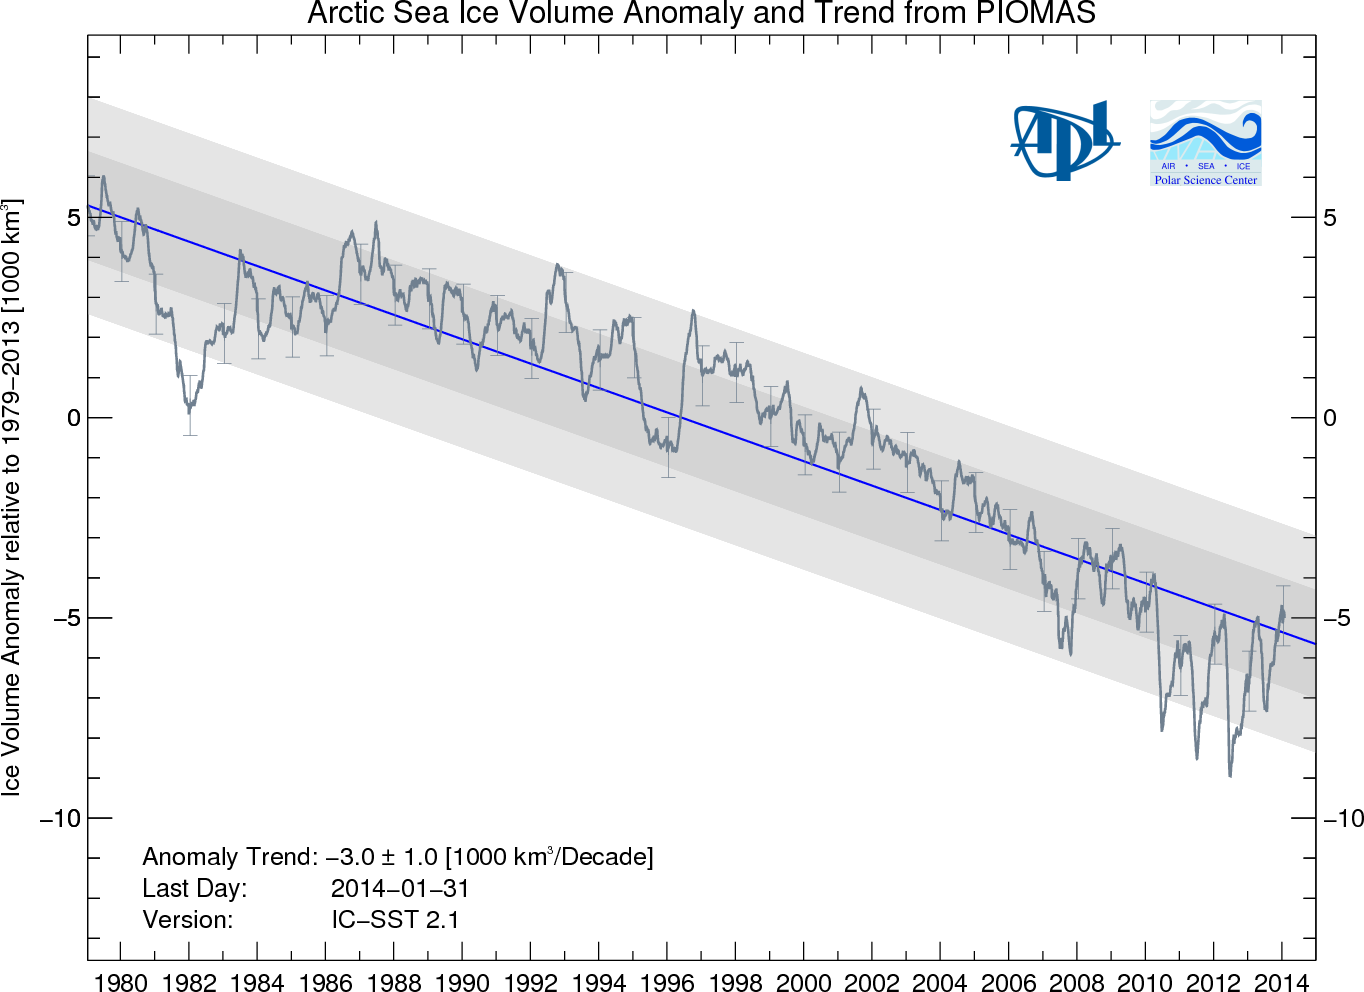
Figure 2: Continuously updated Arctic Sea Ice Volume Anomaly Polar Ice Center.

Currently, websites such as Watts Up With That are using sea ice extent in 2010 to claim Arctic sea ice has returned back to normal. A few days ago, Watts claimed that we had "more ice than any time on this date for the past 8 years". On the contrary, in March 2010, the total Arctic sea ice volume was 20,300 km3 - the lowest March value for total sea ice volume over the 1979-2009 period. Those who claim Arctic sea ice has returned to normal are focussing at the thin shell at the top and neglecting the steadily thinning sea ice below.

Intermediate rebuttal written by Daniel Bailey


Update July 2015:

Here is a related lecture-video from Denial101x - Making Sense of Climate Science Denial

This rebuttal was updated by Judith Matz on September 13, 2021 to replace broken links. The updates are a result of our call for help published in May 2021.

Last updated on 21 October 2016 by MichaelK. View Archives

Printable Version  |  Offline PDF Version  |  Link to this page

Argument Feedback

Please use this form to let us know about suggested updates to this rebuttal.

Comments

1  2  3  4  5  6  7  Next

Comments 1 to 25 out of 155:

  1. The volume chart above relies on the PIOMAS model. The model seems fine for predicting the summer minimum near the beginning of the melt season. See for example, the predictions for 2008: http://psc.apl.washington.edu/IDAO/seasonal_outlook.html Here they made an essentially correct prediction of substantially higher ice in Sept 2008 than Sept 2007. During the previous winter (2007-2008) they wrote a paper predicting the 2008 summer ice extent: LINK In this paper they predicted less ice than 2007 (a new record low) provided that weather forcings (not part of their model) remained substantially similar to 2007. Apparently they did not because the prediction was wrong. Unfortunately I have yet to find a followup paper explaining why the prediction was wrong. The paper emphasizes the use of thickness in the model as a major part of the prediction of extent. But if the thickness is wrong, then the predicted extent would also be wrong. Likewise, if the thickness is wrong in hindcasts when thickness was not measured extensively, then hindcasts of volume would also be invalid. I believe that caveat belongs on fig 2 above.

  2. Erik, fig. 2 above is not a forecast but a model calculation of ice volume, where the measured relevant parameters are fed in. Section 2 of the paper describes the model, the first paragraph of section 3 describe how they use it in forecast mode.
  3. Riccardo, thanks again for keeping track and responding. You are right that the figure is based on a model of the past which is different from a prediction of the future. But it is the same model. Many of the same factors are used both to model the past and predict the future, ocean and air temperatures being major examples. There are other factors can't be predicted or are very difficult to predict due to chaotic effects, like weather patterns and El Nino. As you point out, they use an ensemble for that purpose using the historical factors for the previous 7 seasons. However all of the ensemble predictions were less than the 2008 actual. So either 2008 was a very unusual year weatherwise or the model fails to properly integrate the recorded weather into the calculated ice volume. I'm inclined to believe the latter which is why I don't believe fig 2 above is accurate either.
  4. Not to barge in, Eric, but how -much- of figure 2 is inaccurate, in your estimation? How wrong is it? Is it useless? Is the trend reflected in the figure entirely absent?
  5. Eric, suppose that the ice volume model is perfectly able to calculate the true ice volume when you plug in past and current measured data. You then try to predict next season and plug in a GCM projection of the relevant physical quantities, i.e. weather evolution. It may well turn out to be wrong. What do you conclude? Sure the input data were wrong. Hence, a wrong forecast does not invalidate the ice volume calculations. So it is essential to separate the problem in two parts. The first is validation of the model calculation of ice volume. It has been done and it is shown here. And this is also the topic in this post. If the authors are confident with the results, they may want to try a forecast, but now they're adding the uncertainties of the GCM and chances are they dominate for the reasons you said. I can't tell if something went wrong or if it was just the expected uncertainty, one really need to be an expert on arctic ice behaviour. You might want to ask directly to the authors.
  6. doug, I think the latter part of the curve has been verified, which I believe is about 5 years worth of data. Prior to that the verification relies on measurements of the same factors to calculate volume that were used in the volume and extent prediction (made in 2007 for 2008), namely forcings like weather and ENSO. Obviously those are well known for the past rather than predicted for 2008, but the ensemble used a variety of them to attempt to predict 2008 which all resulted in an underestimated ice extent. Not useless and the trend is correct, but I don't know how accurate the long term slope is.
  7. Riccardo, keep in mind the "perfectly able" is qualified by the need for parameterizations related to the forcings. As a simple example, the extent and temperatures of ocean currents under the ice. Those calculations are very similar to a prediction except used for the present time. I can't interpret the graph you show without the description of how it was derived, but from the looks of it, the model is verifying about 5 years of actual volume measurements. I understand how the GCM adds both predictive value and uncertainties, but those are certainly not the only source of uncertainties in the model (except in the hypothetical case of a perfect model).
  8. Eric, I didn't mean that PIOMAS is a perfect model, just that even a hypothetical perfect model would fail the forecast if the input data are not good enough.
  9. Stop the presses, this just in: Mayans were right! North Pole to be ice-free (well, except for various edges) September 2012! From Neven's blog. Gimme lemons, I'll make lemonade... The Yooper
  10. Despite the offseason, Neven's blog (Arctic Sea Ice) continues to produce tasty morsels, like this comment by FrankD:
    "What comes out? A better than 50% probability of an ice free September by 2016, with the ice free period increasing by almost a month each year. By 2023, there is a good likelihood of five months ice free, from mid-July to mid December. After that it slows down somewhat, but March and April, the last months remaining, reach zero around 2032-33.
    Which he then links to the chart he created here: Melt season 2011 will be something to behold, now that Cryosat-2 is pumping out data... The Yooper
  11. Yooper, We count on you to be first with the good news. Those bottom curves (August-September) dropped 50% (from 10000 to 5000) in just 3+ years! Never mind Lake Superior, you'll be body surfing Baffin Bay in no time.
  12. Heh! I'll put my surfboard on my little deuce coupe as I head North To Alaska, where the curl of the Arctic swells generated by the 6-month long summer Arctic Dipole warms the toes of the windsurfers cruisin' the Northwest Passage to Baffin Bay, where the scenery is beautiful and the women...did I mention the scenery? BTW, the longer you stare at the chart, the more it resembles someone diving in the water... The Yooper
  13. Ok, here's some 'good news': Polar bears: On thin ice? Extinction can be averted, scientists say ... new Nature paper indicates that if greenhouse gas emissions were reduced substantially in the near future, rapid ice losses would be followed by substantial retention of the remaining ice through this century--and partial recovery of the ice that disappeared during the rapid ice loss. --emphasis added That's a fairly balanced way to report this new study. The same group (University of Washington) ran a model in 2007 forecasting that sea ice would reach a tipping point and polar bears would go down the drain by the end of century. One of the authors did a writeup in RC contrasting what the study actually said vs. what was said about it. That is an interesting read of its own. The full size graph is available there. But the new study has already generated headlines proclaiming the 'good news', even before the Nature issue comes out: Arctic ice cap safe from runaway melting No tipping point for Arctic icecap melting How fast will the actual message -- that substantial GHG mitigation must happen and soon (emphasized in the quote above) -- get lost as the deniersphere spins this one?
  14. Hits just keep on coming. Reduced ice extent decreases the albedo, which in turn reduces the negative feedback (and that increases the net positive forcing, no?) Flanner et al 2011: Radiative forcing and albedo feedback from the Northern Hemisphere cryosphere between 1979 and 2008 We find that cryospheric cooling declined by 0.45 W m−2 from 1979 to 2008, with nearly equal contributions from changes in land snow cover and sea ice. On the basis of these observations, we conclude that the albedo feedback from the Northern Hemisphere cryosphere falls between 0.3 and 1.1 W m−2 K−1, substantially larger than comparable estimates obtained from 18 climate models.
  15. Continuing from here, comment #23. "the 30's to 50's drop from very large extents to less large is only a bit less in magnitude." No, the '30s to '50s drop is a lot less in magnitude. Here is a graph of the Walsh data set, txt file here. Red is September min, blue is March max. Perhaps the variations reported by Mahoney et al 2008 in the Russian arctic are the mid-century blips. By way of contrast, we're on the downward Nantucket sleigh ride.
  16. Responding to Galloping Camel on the Monckton thread who wants to throw away the data: The data set that Muoncounter cited says the data is reliable back to 1953. I figure that is 60 years, not 40. The additional data back to 1900 can be used carefully. Scientists use all the available data to reach the most comprehensive conclusions. It is typical of "skeptics" to deny data that has been carefully gathered because it shows that AGW is much worse. People live in the Arctic and they record the conditions where they live. Explorers kept careful records of ice conditions where they were. Fishermen record the ice edge (watch Deadliest Catch). These records enable comparisions to current data. Cite a reference that says the graphs I have copied are not usable or stop your unscientific comments. It was not my intention to suggest that the ice was flat in the past. The data shows that the ice has been in significant decline because of AGW for longer than the 30 year satelite record. Deniers want to limit the data used to hide the decline in Arctic sea ice.
  17. Let me first answer the overt question of the thread: Has Arctic sea ice returned to normal? No, it is still near record lows for the post-Little-Ice-Age period. But there is also a covert question in this thread that came up in the thread linked by Muoncounter above. That question is: Has Arctic sea ice fluctuated in the past (i.e. what is normal)? The Walsh data that muoncounter provided is flat mainly because it is out of date. It doesn't include the Russian data http://nsidc.org/data/g02176.html) For example, the dip in the 30's is nonexistent. There are natural explanations for such dips, for example http://www.agu.org/pubs/crossref/2005/2005GL024254.shtml "The period from 1928–1935 also had a dipole structure in SLP, which contributed to the interdecadal arctic-wide warm temperature anomalies in the first half of the 20th century." Also as I pointed out in the other thread, the main cause of late 19th and early 20th century decline in both hemispheres was recovery from the LIA. The main cause of the current, abrupt decline is AGW plus local feedback from open ocean. I am not trying to hide anything.
  18. Overland has a more recent paper http://onlinelibrary.wiley.com/doi/10.1002/joc.1973/abstract attributing the 1920-1940 Arctic warming as partly AGW: "Our findings indicate that early climatic fluctuation is best interpreted as a large but random climate excursion imposed on top of the steadily rising global mean temperature associated with anthropogenic forcing."
  19. Eric (skeptic) sorry for being OT and a bit pedantic. Given that your comments are usually scientifically well reasoned, I'd like to suggest to not use the term "recovery from LIA". This term implies a planet that for some reason was pushed out of a well defined equilibrium and is now going back toward the previous (or any other) equilibrium. In reality, as I'm sure you'll agree, the forcings has changed, and are still changing for whatever reason, and the planet is changing accordingly.
  20. Riccardo, I will keep that in mind. The LIA was stuck in my mind because I wanted to caveat the record low in sea ice by saying post-LIA. But I actually do not have any evidence in hand that sea ice was lower before the LIA (e.g. MWP), so I should have left that out entirely.
  21. Anybody notice Arctic sea ice extent topping out for the winter season? -- JAXA Per their text file, the maximum extent was March 8. The Melt begins ...
  22. I did - I didn't want to mention it. Too depressing.
  23. The melt? Or the Plunge?
  24. Looking again at NSIDC today, it seems indeed the max extent was reached some days ago. If it remains there, that is quite low. However, there is till a possibility of a very unusual weather event that would cause an uptick, so a couple more weeks are necessary for absolute certitude on the max extent (note the shape of the standard deviation shaded area going into spring). Interestingly, Antarctic sea ice has been below average and is quite sluggish to pick up growth. The global sea ice area is very far below baseline.
  25. Philippe #24: Interesting point on the global area. Looking at the graph it seems like since 2005 the annual minimum area (blue line) has repeatedly been significantly below the long term average (grey line). There have also been several sharp dips in the growth cycle (about 6 months after the minimums) not often seen in previous years. Obviously, most of this is being driven by the collapse in the Arctic and it is too short a period to confirm that a new trend (steeper than the long term decline) has begun. That said, the latest PIOMAS update (included in the article above) shows basically no recovery of ice volume anomaly over the Winter. Not a good sign.

1  2  3  4  5  6  7  Next

Post a Comment

Political, off-topic or ad hominem comments will be deleted. Comments Policy...

You need to be logged in to post a comment. Login via the left margin or if you're new, register here.

Link to this page


The Consensus Project Website

THE ESCALATOR

(free to republish)


© Copyright 2024 John Cook
Home | Translations | About Us | Privacy | Contact Us