Climate Science Glossary

Term Lookup

Enter a term in the search box to find its definition.

Settings

Use the controls in the far right panel to increase or decrease the number of terms automatically displayed (or to completely turn that feature off).

Term Lookup

Settings


All IPCC definitions taken from Climate Change 2007: The Physical Science Basis. Working Group I Contribution to the Fourth Assessment Report of the Intergovernmental Panel on Climate Change, Annex I, Glossary, pp. 941-954. Cambridge University Press.

Home Arguments Software Resources Comments The Consensus Project Translations About Support

Twitter Facebook YouTube Mastodon MeWe

RSS Posts RSS Comments Email Subscribe


Climate's changed before
It's the sun
It's not bad
There is no consensus
It's cooling
Models are unreliable
Temp record is unreliable
Animals and plants can adapt
It hasn't warmed since 1998
Antarctica is gaining ice
View All Arguments...


Username
Password
New? Register here
Forgot your password?

Latest Posts

Archives

Is the climate warming or cooling?

Posted on 20 April 2009 by John Cook

The most popular skeptic argument in recent times is that global warming has stopped and we're now experiencing global cooling. For example, if we fit a linear trend line to global temperature from 1998 to 2008, we find no statistically significant trend. However, if we fit a trend line from 1999 to 2008, we do find a strong warming trend. It's all too easy to cherry pick start and end dates to reinforce whatever point of view you wish to promote. But what is the most appropriate way to view temperature data?

The paper Is the climate warming or cooling? (Easterling 2009) addresses this question. They examine the long term warming trend from 1975 to 2009 and find a number of periods where there is no statistically significant trend. Eg - 1977 to 1985 or 1981 to 1989 (eyeballing the graph, I might add 1987 to 1996).
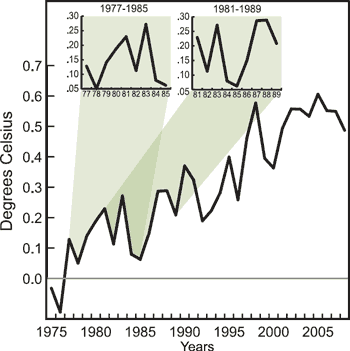

Figure 1: Globally averaged surface air temperature. Two periods with no statistical significant warming trends are 1977 to 1985 and 1981 to 1989.

If CO2 is steadily increasing from year to year and CO2 warms the atmosphere, why isn't the atmosphere steadily warming from year to year? The answer is natural climate variability. Effects such as the El Nino/La Nina cycle, volcanic eruptions and solar cycles are all  superimposed over the long term warming trend. This is why we've observed several periods of cooling (or no trend at all) amidst the last 30+ years of global warming. Such periods are to be expected.

So what is the likelihood of a decade of cooling during global warming? Easterling calculates the probability - both in the observed record and modelled results. The black line in Figure 2 shows the probabilities of various decadal trends in the observed record from 1901 to 2008. As expected, there is a greater chance of positive trends. But there is still a significant chance of a negative or no decadal trend. 
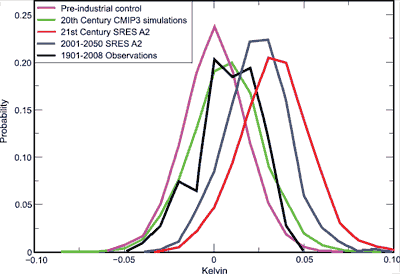

Figure 2: Probability distribution functions for decadal trends (kelvin/year) in global air temperature for the observed record (black), pre-industrial control runs (magenta), 20th century simulations (green), and 21st century simulations for the first half of the 21st century (blue) and entire 21st century (red).

For 21st Century model predictions, there is around 5% chance of a negative decadal trend (the red line in Figure 2). This doesn't even take into account volcanic eruptions or solar cycles which also impose several years of short term cooling. In the first half of the 21st Century, the probability increases to 10% (the blue line). In other words, as the warming trend increases this century, cooling periods will occur less often.
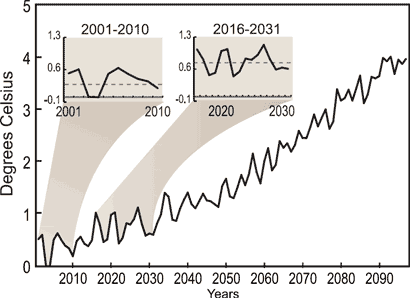

Figure 3: Modelled projections of global temperature (based on the SRES A2 "business as usual" greenhouse gas increase scenario) for the 21st century. Note two periods of statistically insignificant trends in 2001 to 2010 and 2016 to 2031.

So what's the take home from this paper? Climate is variable. This is why climate by definition deals in trends greater than a decade. It is simply not appropriate nor particularly illuminating to draw definite conclusions on where climate is headed based on short term trends. When you read an article stating global warming has ended based on the last 10 years or less, treat the conclusion with much skepticism.

1 0

Printable Version  |  Link to this page

Comments

Comments 1 to 38:

  1. I woke up today feeling great - like I was 10 years younger. So I cross referenced my birth certificate with the calender and was upset to discover that I am in fact continuing to age. Bummer, but good job I checked.
    0 0
    Response: I on the other hand tend to feel older than I really am. Dang natural variability!
  2. The proposition that a graph showing the variable response of one measurement to a causative factor will be variable is so self-evident that the idea of picking out individual shorter periods within the graph and pretending that they show an opposite trend must be a sign of deliberate deception. If every graph was a straight line relationship there would have been no need to develop the mathematics of regression. Well, maybe it isn't all deliberate deception, but it always shows people who are completely unfamiliar not just with statistics but with the basic idea of graphs. And don't get me started on the misuse of the term "model".
    0 0
    Response: It is self evident and completely obvious and yet the argument "global warming has stopped because it's been cooling over the last few years" is a prevalent argument these days. So the point must be made.
  3. Hi John, yes, I agree, sadly, that the point must be made, my comment wasn't a criticism of the subject being addressed. The "warming has stopped" nonsense appears vigorously on every thread to do even vaguely with climate change. And appears to be the core of Plimer's Denialist Manual". When scientists (although Plimer is a geologist, and therefore only an honorary scientist) pretend not to understand regression you know they are either fools or rogues.
    0 0
  4. Thanks for the post, but I have to point out that your argument can be applied to the very data that was presented. The initial graph displayed runs from 1975 until 2006 which is quite a short period of time. It also seems quite misleading to post the graph showing only the short term trend from the bottom of a cooling period that ended in 1975 and not show the current cooling trend, thereby displaying a longer term variability. If we step back even further and look at temperatures from 1880 to present we do see a rise in temperature of about .5c per 100 years which is quite consistent with the warming we should expect as we recover from the little ice age. Also, I always take exception to graphs produced by computer models since they are based on assumptions that simplify our climate to ridiculous degree . This one in particular is quite maddening since it shows a nice, neat linear increase in temperature over the next 100 years. Hardly a realistic prediction if you ask me (although I know your not asking). The creators of these models also argue that our climate simply is not variable enough to account for the rise in temperature from 1975 to present, however, this post would seem to say that it clearly is.
    0 0
    Response: The point of the paper is to show that even during a warming trend, you will find shorter periods of cooling or no trend. So it makes sense to try and find cooling periods during the "modern warming trend" from 1975 to present. As there was no statistically significant trend from around 1945 to 1975, it makes little sense to point out periods of no trend in that period.

    I address elsewhere the argument that we're coming out of an ice age.
  5. Thank you for the response. As I continue to do my research on this issue it is very interesting that the same data is often used by both sides to prove their various points. This temperature record http://en.wikipedia.org/wiki/File:Instrumental_Temperature_Record.png is often used by skeptics to point out that the rise in temperature from 1907 until 1944 is nearly identical in length and magnitude as the rise since 1975. Yet others point to the 1975 to present rise as an anomaly which proves that CO2 is the main cause. Can you provide your view on this. Another example would be volcanic activity. In your post about the ice age (link above) you state that volcanoes made the ice age worse. However, I have read other papers that identify volcanoes as a force for warming the earth, not cooling it. This warming coming as a result of volcanoes releasing massive amounts of CO2, methane and other greenhouse gasses into the atmosphere. Your insight on this would also be appreciated.
    0 0
    Response: These issues are addressed at it warmed before 1940 and it's volcanoes.
  6. "It warmed before 1940" I must respond to the above post and say that it is outlandish to claim that CO2 warming has only been dominant since the mid 70's. This would means that at the 1940's level of 300 ppm CO2 doesn't cause the planet to warm, but at the 1975 level of 368 ppm it does. This simply does not make since, especially considering that CO2's ability to reflect infrared radiation declines exponentially as it increases, not to mention that thousands of other variables (known and unknown) that affect climate.
    0 0
    Response: This site works best if you keep your comments on topic - you're better off discussing early 20th century warming on the it warmed before 1940 page. I would also strongly recommend reading two peer reviewed papers on the topic: Estimation of natural and anthropogenic contributions to twentieth century temperature change (Tett 2002) and Solar Forcing of Global Climate Change Since The Mid-17th Century (Reid 1997).
  7. Thinker, you're right that both sides of the "debate" uses the same data to support their arguements. But I think you'll find as you do your research that the skeptic side uses a very limited amount of the available data as support for their 'arguement'. And that it's very carefully chosen data. I.E. cherry picking.
    0 0
  8. Lee, they only need one piece of evidence for the theory to be disproven. That is the way science is supposed to work. Cherry picking is an argument that I would describe as tongue in cheek coming from the AGW side. Let us not forget the "Hockey Stick", or the entire GISS data set where cherry picking is supplemented by undocumented and often clearly illogical "corrections". John's choice of 1999-2008 is about the only recent series where his claim can even be made. 1998-2009 sure as heck wouldn't work nor would 2000-2008. None the less, I don't see much reason to believe any long term cooling has set in. I certainly hope not, another couple of years like 2008 and you may have something real to worry about in terms of world food production. We had 3 weeks shortened growing season last year and this year is running behind it. Local perhaps, and not a trend; but, in what is the most productive agricultural region I know of, this is not something we want happening long term. I continue to earnestly hope for some significant global warming.
    0 0
  9. Steve - you think "I continue to earnestly hope for some significant global warming" and what leads up to it (ie the continuing mythology of a "fall in global temperatures") should simply be left to sit there? Too much denialism, overt or subtle, goes unchecked, and next thing you have Plimer's magnum opus, providing ammunition for another ten years of delay in response by governments on the basis that the debate is continuing.
    0 0
    Response: Note - I've deleted some of the comments as they add nothing to the scientific debate. But I've left this one up just to make a point. David, I certainly do believe we should work hard to expose the erroneous science in global warming skeptic arguments. But how we do that is important too. Attacking people rather than their scientific arguments is mental laziness. Taking a combative approach really achieves nothing except alienate people - both the person you're opposing and third party onlookers - who are the people you're more likely to persuade than a hard core skeptic. Sometimes it's difficult to take a polite, respectful tone - I find myself getting a little hot under the collar in some discussions - but try to discipline myself to control my emotions. I suggest you do the same, particularly on this site. Thanks!
  10. Well,part of exposing the erroneous science is understanding the tactics used by the skeptics to keep the illusion of a debate alive. Like trying to start an arguement about whether plants need CO-2 to live. I've seen lots of people get sucked into that one. A prime example on this site is the 'tectonic plate' arguement. A more intelligent arguement to be sure, but still a manufactured arguement, and pointless to the discussion. And you clearly don't understand those tactics. which puts you at a disatvantage when it comes to communicating with the Average Joe. Or the average Lee. Like me.
    0 0
  11. Wondering Aloud, if you're trying to disprove my arguement,you can't use as the basis for your arguement evidence that I'm using in my arguement ,to disprove my arguement, unless you have further evidence , which, combined with my evidence which you chose to use can be used to disprove my arguement. You've yet to provide that further evidence.
    0 0
  12. 1998 to 2009 is the longest post industrial flat/cooling trend. I'm curious, how long of a period without temperature increase would it take (without a Volcanoe, etc) with continued C02 increase before you would accept it as evidence against C02 as a significant cause of warming? Also, how low would temps need to go before accepting it as evidence against AGW?
    0 0
  13. Gary, that’s what is becoming known as the Roger Pielke Take: what needs to happen to invalidate the AGW theory (or what is inconsistent with the AGW theory as he has put it). When Pielke posed that question, it became clear that… short from an Iceberg in New York, nothing! And that has a reason. AGW is a political movement. And juvenile reasoning has it that political movements are related to truth or reality. They do not! From the point that AGW has become a political movement it will not be invalidated. Some might argue, no way, if facts become clear, there is no way it can not happen. Truth is, it’s a political movement… Global warming became Climate change and currently is becoming, just to be on the safe side, climate change and energy conservationism! – See, whatever results from the coming years, the “climate change” can even be dropped that the “energy conservationism” stay on, and what ever are the objectives of the political movement subsist. – That’s how our species survive. Just face it.
    0 0
  14. David Horton, 1)What action do you expect out of govements that can have any, any impact on global warming? 2)do you aknowledge that taking action has consequences too. If time disproves AGW, what should the penalties be to people like you? thank you.
    0 0
  15. David Horton, 1)What action do you expect out of govements that can have any, any impact on global warming? 2)do you aknowledge that taking action has consequences too. If time disproves AGW, what should the penalties be to people like you? thank you.
    0 0
  16. Lee I was trying to explain that a theory that fails to explain the observations. All observations, not just selected ones, must be discarded. A theory is an explanation it must explain what has been observed and be useful to predict the results of future experiments. What I am trying to get across is that if their is one piece of evidence that contradicts theory the theory is the thing that is wrong. This is not a majority vote, if 99.9% of data support a theory and 0.1% disagree that means the theory is wrong and that's all there is to it. This is the way science works and the politicization of this issue is what is creating the huge backlash. In reality when a theory is well established we look for errors first and then for modifications or a variable we missed. This is where we are right now. It is clear that the hypothesis of AGW by CO2 as popularized by people like James Hansen and Steve Schneider 20 years ago, i.e. 2-3 degrees C net warming by the year 2000, was totally wrong. The theory has to change and is changing. Back off a bit let honest science debate, pretending the science is other than it is harms your cause.
    0 0
  17. W.A. -- could you point me to the late '80's / early 90's paper by Hansen and/or Schneider where they indicate 2-3 C by the year 2000? Regarding disproval of AGW, etc, my understanding is that theories are discarded when others are shown to be better. More usually, modifications are made to an existing theory to improve its predictive power. Interestingly, estimates of climate sensitivity to 2x CO2 have been quite invariant. See: http://tinyurl.com/yzdled (>30 years ago 1.5-4.5 C) http://tinyurl.com/66tphc (4th IPCC note#4 2.0-4.5 C) Those who think AGW is not scientifically supported should provide scientific arguments (especially on a website dedicated to examining those arguments), and they should hopefully use citations to bolster their arguments.
    0 0
  18. Hi Steve L Can you provide scientific arguments that clouds are a positive feedback on CO2 warming? Because the theory resides on the fact that they are! Can you provide scientific arguments that increase temperature, from CO2 added, will increase precipitation systems and that those systems are a positive feedback? Because the theory resides on the fact that those are a positive feedback. – If they don’t, there is no AGW.
    0 0
    Response: Here is a good summary of the empirical evidence for positive feedback in the climate system.
  19. Dear O.M., Your comments are frustrating to me. You say the theory 'resides on the fact' ... fact A, fact B(1), and fact B(2). You should provide citations that support your assertions that AGW depends on A, B(1), & B(2). If you did that, readers would be able to figure out what you're saying. Of course, doing that would also mean you would have in your possession a good clue as to why those assumptions would be made. AGW does not, however, depend on positive feedbacks -- anthropogenic CO2 provides a positive forcing regardless of water vapour; however the response of water vapour to the CO2 forcing will enhance the climate's sensitivity.
    0 0
  20. #15 Well OM: 1. Rapidly phase out coal mines; invest heavily in energy conservation measures and renewable energy sources; end land clearing. 2. Hmm, tricky, but I'm expecting sainthood. You see even if I am wrong (and I dearly wish I was), the measures in the first answer would make this a much better planet for all its inhabitants (human and non-human).
    0 0
  21. Steve L at 04:57 AM on 29 April 2009 Steve, now I’m the one confused. I’m no expert on the science of global warming, but I’m pretty sure, doubling CO2 on the atmosphere will only be able, per se, to increase temp 1 degree per W/m2. If these were what are at stake here, we would not be here. There would be no issue at all! So this is not the global warming theory. The global warming is about positive feedbacks (as you say climate sensitivity, right). It is about cloud cover, it is about water vapor. It is about behavior on LW and SW radioactive values. So yes, it is all about the positive feedback of cloud cover and what is the behavior of the extra amount of water vapor when that same water vapor organizes itself in precipitation systems. Are those precipitation systems a positive or negative feedback; is cloud cover a fixed value and, since it isn’t, in that form is it a positive or a negative feedback. If you know any scientific study that tries to postulate that those are positive feedbacks, please redirect me to them. Because most scientific paper I’ve been able to grab about this issue, are by any means --- Jokes. I confess that regarding how those feedbacks operate my source is reading Gavin Schmit and Real climate. I know not a reliable source and that is why I'm asking for something more trustworthy. Thank you for your time.
    0 0
  22. Oh, and btw, the question of "what would have to happen to make me doubt AGW" or what is “inconsistent with AGW theory” is valid for anyone here who believes in it. Because if you don’t know this…
    0 0
  23. David Horton, None of those measures would do anything to offset AGW. Absolutely nothing. You can’t answer the question (the Roger Pielke paradigm), can you?
    0 0
  24. [ Response: Here is a good summary of the empirical evidence for positive feedback in the climate system. ] Don't think so. You should update info. Of course looking these up on the web is excruciatingly difficult. Now, finding stuff that takes the AGw stance is by the millions. Most of what is postulate there is old stuff. Very much pre “oh my god, global temps are not increasing anymore”. But, anyway, here goes a couple to help out: http://translate.google.com/translate?js=n&prev=_t&hl=en&ie=UTF-8&u=http%3A%2F%2Fwww.radiobremen.de%2Fwissen%2Fnachrichten%2Fwissenawipolararktis100.html&sl=de&tl=en&history_state0= http://www.abc.net.au/news/stories/2009/04/24/2552225.htm
    0 0
  25. [ Response: Here is a good summary of the empirical evidence for positive feedback in the climate system. ] Don't think so. You should update info. Of course looking these up on the web is excruciatingly difficult. Now, finding stuff that takes the AGw stance is by the millions. Most of what is postulate there is old stuff. Very much pre “oh my god, global temps are not increasing anymore”. But, anyway, here goes a couple to help out: http://translate.google.com/translate?js=n&prev=_t&hl=en&ie=UTF-8&u=http%3A%2F%2Fwww.radiobremen.de%2Fwissen%2Fnachrichten%2Fwissenawipolararktis100.html&sl=de&tl=en&history_state0= http://www.abc.net.au/news/stories/2009/04/24/2552225.htm
    0 0
  26. I completely agree with the substantive points made in this essay. I disagree, however, with its conclusion. Let me explain. The basic point made in this essay is that many factors influence temperature change over a time frame of a few years to a decade. Thus, decade long data does not necessarily tell us anything. I totally agree. But, from that you conclude, therefore the skeptics are wrong. No, that conclusion does not follow from your evidence. What your evidence indicates is that the temperature data from the last decade does not prove anything one way or the other. It does not prove the skeptical case. It also does not prove the global warming case. It simply proves nothing. You also do not address the real issue, which is, if we want to assess the theory of global warming, what time frame for climate data is, in fact, relevant? As I understand it, the basic skeptic's case is as follows. There are many natural trends in global climate, which generally operate on a time frame of centuries, not decades. The world, in general, had a cooling period, which bottomed out at roughly the time of the American Revolution. Since then, with some ups and downs, the long-term trend has been up. The global warming theories say that this long trend proves their theory. However, the skeptical answer is that this upward trend: (a) started before the Industrial Revolution; and (b) is a natural trend, which should be expected, after the prior natural downturn. What is the scientific answer to those skeptical points?
    0 0
  27. I would like to add a comment about averages - they are made up of extremes. Perhaps humans get caught up with their own existance, particularly if it is possible that change is a 'threat' to their stable lifestyle. I would be very surprised if the climate remained the same. One area which has been little discussed with global warming is the 'reflective ability of clouds'. As the temp and humidity go up more cloud reflects radiation, so limiting further absorption within the lower atmosphere. Expansion of the tropical zones ought to occur. If the sun is not responsible for variation seen ,could the slight increase in temp be coming from within the earth rather than exterior ? Why assume core activity remains constant ? For 'olympus mons' on feedback - observe a specie of tree which may have existed in an area for say several million years. If its climatic zone is specific then it stands as an example of 'averaging' the seasons over a much greater span than our personal memories. Thank you for the opportunity.
    0 0
  28. Dear RG, go to this "hottest arguments" part of this website and look up your favorite skeptic arguments: http://skepticalscience.com/argument.php The "we're coming out of an ice age" argument is currently number 26, I believe. To Homer: I failed to find you a citation of a scientific paper, so I'm resorting to rhetoric: permafrost is melting from the top down, not the bottom up; same with the oceans; etc -- heating from the earth's core is not consistent with observations. To OM: Yours are the actions of a troll. Specify exactly what you want to argue about, choose the appropriate venue, and use scientific arguments. Changing topics, throwing in needless character assassinations, and simply calling explanations "Jokes" is a waste of everyone's time.
    0 0
  29. Steve, I got into trouble, earlier in this thread from ... You are quite right to call OM on trolling, and WA is also trolling, as I suggested (and I have suspicions of homer). Neither (if they are indeed separate people) are adding anything other than denialist talking points. Over and over.
    0 0
  30. Hi Steve and David. Sorry for having upset you both. Was not intentionally. English is not my native language (I’m Portuguese) so I have to concede that although I can not see how or when I have trolled (if I really know what that is) I might really have. Based on previous paragraph I will assume that calling someone troll is not really “Foul language, trolling, personal attacks or non-relevant links will be deleted” , because the moderator as allow it to be in here. About WA, thank you David for even considering It could be the same person. I’m sort of honored. PS: actually I think me and WA (given the obvious differences) are made of the same cloth (hope I get it right) and actually we were born like this. It’s how our brain is sort of organized. Same is truth for you and Steve. Your brains are “organized” the way they are and that has a huge influence on how you perceive reality. But that is my turf and, in there, Im pretty sure you would be upset. Oh boy, you both would, really quickly.
    0 0
  31. Often I've heard how 1934 was the hottest year in US climate records. Often in response, people will say then that 1998, and closely behind 2005 are the warmest 'global' recorded years. Take a look at this: http://www.globalwarmingart.com/wiki/Image:GHCN_Temperature_Stations_png The vast majority of sites going back over 90 years are in the continental USA. So, the long term records are really only good for the USA and parts of western Europe. These areas have also become much more urbanized over these time periods, so the UHI effect is very important. Now days we have a much more 'global' temperature gathering network. So, I have to wonder--how do we know what the true global temperatures were, say in the 30's? i.e., if we had the capabilities then to record remote locations, that 'global' temperature may have been higher--or even lower. There seems to be so much in our temperature records that are suspect. The US shows a definite cooling trend, with the 'global' trend there as well--so I'd say it's cooling now after a couple of decades of warming. Going back further, I think a lot of guess work come's into play.
    0 0
  32. Often I've heard how 1934 was the hottest year in US climate records. Often in response, people will say then that 1998, and closely behind 2005 are the warmest 'global' recorded years. Take a look at this: http://www.globalwarmingart.com/wiki/Image:GHCN_Temperature_Stations_png The vast majority of sites going back over 90 years are in the continental USA. So, the long term records are really only good for the USA and parts of western Europe. These areas have also become much more urbanized over these time periods, so the UHI effect is very important. Now days we have a much more 'global' temperature gathering network. So, I have to wonder--how do we know what the true global temperatures were, say in the 30's? i.e., if we had the capabilities then to record remote locations, that 'global' temperature may have been higher--or even lower. There seems to be so much in our temperature records that are suspect. The US shows a definite cooling trend, with the 'global' trend there as well--so I'd say it's cooling now after a couple of decades of warming. Going back further, I think a lot of guess work come's into play.
    0 0
  33. John, you are quite correct that start and end dates can change statistical results dramatically. These are issues that need to be discussed. But they need to be discussed, in part, within the context of relevant physical theories. For example, everyone knows about the warm period from 1975 to 2007. The climate regime shift that occurred in 1975 was very strong. A similarly strong climate regime shift happened in about 1942 from a warm period to a cool period. This is discussed in the 2002 Bratcher and Giese paper http://www.agu.org/pubs/crossref/2002/2002GL015191.shtml Based on observations Bratcher and Giese made in 2002, they predicted a return to a cool climate regime "soon" based on observations they made on the oscillation in the tropical Pacific ocean. Others have written about the link between shifts in the PDO from its cool phase to warm phase in 1975. And the PDO did shift back into a cool phase in late 2007. While one can claim the planet was still warming from 1999 to 2007, it is very hard to ignore the strong drop in temperature between 2007 and 2008. It will take time to see if this is the start of a persistent trend. But to be honest, looking at surface temps is not really a good metric for monitoring climate change. James Hansen wrote about the radiative imbalance due to anthropogenic CO2 and claimed the earth's energy budget was out of balance causing the oceans to warm and this stored heat was "heat in the pipeline" that would show up in the atmosphere later. I really do not like this way of thinking about it. The oceans are an important part of the climate system. In fact, because water stores heat so much more efficiently than the atmosphere, the ocean is the best place to monitor climate change. If Jim Hansen is correct that OC2 has caused the earth's energy budget to be out of balance, the oceans should be warming year over year consistently. After all, where else can the heat go? But Josh Willis from JPL has published on this. The oceans have not warmed since 2003. This is a significant finding because the start and end dates do not play a big role. Because of the nature of the physics involved, warming should be measurable year over year consistently because the signal is significantly more than noise, this is THE most important climate metric we can study. Roger Pielke, an ISI highly cited climatologist, has blogged on this at http://climatesci.org/2009/02/09/update-on-a-comparison-of-upper-ocean-heat-content-changes-with-the-giss-model-predictions/ Ocean heat content really gets to the heart of the issue of "warming vs. cooling." It should be discussed more often.
    0 0
  34. Yes, decadal periods are too short to determine whether there are long term trends. If you calculate trends using 30 yrs over the length of the Hadley global anomaly data you get the following: Total number of trends calculated: 1551 total positive trends 994 total negative trends 560 total trends gt .1 deg per decade 444 Which leads to the question is not if the climate is warming but how much? Here is a plot of the trends in Deg/Yr Hadley20-30yr-trends Notice the peaks at 60 yr intervals. Even if the temps are going up on the long term it appears we are due for a decrease over the next 30 years, which is not going to do much for those that are trying to promote changes based on near term measurements.
    0 0
  35. re #16 WA you make two entirely contradictory statements:
    Lee I was trying to explain that a theory that fails to explain the observations. All observations, not just selected ones, must be discarded.
    and:
    It is clear that the hypothesis of AGW by CO2 as popularized by people like James Hansen and Steve Schneider 20 years ago, i.e. 2-3 degrees C net warming by the year 2000, was totally wrong.
    Unfortunately you are continually reluctant to address observations, and just make stuff up. A made up falsehood is not an "observation". That amounts to little more than trolling. It's very easy to establish, for example, what Hansen predicted 20 years ago. He set up early GCM models, published in 1988, that projected warming under different emission scenarios [*]. The projections under modest emission scenarios very similar to those actually accruing in the intervening years were that the global temperature would warm in 2000 (from 1960 levels) by 0.4 oC (scenario C; emissions to stop after 2000) or 0.5 oC (scenario B; this is the emissions scenario that most closely matches the intervening reality). Even the scenario (scenario A) designed to assess excess emissions "on the high side of reality", only projected a warming by 2000 of around 0.75 oC. Add about 0.3 oC if you wish to normalise these values with respect to mid 19th century temperatures. The actual global surface temperature at 2000 was rather close to Hansen's modelled projections. since you can download this stuff (try: http://pubs.giss.nasa.gov/docs/2006/2006_Hansen_etal_1.pdf for a description of this work - see Figure 2)... ...it's very difficult to see what you gain by creating obvious falsehoods. You may not have much understanding of science, but you should at least know that it's based on evidence ,and generally individuals post here accordingly. Making up stuff to support an agenda isn't skepticism! [*]Hansen J et al. (1988) Global climate changes as forecast by Goddard Institute for Space Studies three-dimensional model. J Geophys Res 93:9341–9364.
    0 0
  36. In reading through the post the comments on this thread I find it amazing that no-one has mentioned the effect of the volcanoes, El Chichon in Apr 1982 & Pinatubo in June 1991. If you look at the top chart the significant cooling effect of these events is self evident & further they explain in large part the low/negative trends mentioned in1977-1985 & 1987-1996. The cooling effects of these events occur in the latter years of these periods. What is unique about the flat period abt 2000-2009, since after 1960, is that this has occurred in the absence of a major, cooling, volcano. Furthermore the trends calculated over the past 30 years would have been significantly less if El Chichon & Pinatubo had not occurred (these events occurred in the first half of the past 30 year period). See also: - http://rankexploits.com/musings/2009/how-would-figure-95a-from-the-ar4-look-today/
    0 0
  37. Instead of taking everything for face value, I downloaded the global land/ocean temp data from NCDC and plotted it out on excel. While it is obvious that global warming has occurred for many years, what happened around 1997 to 2009? The data plainly shows nearly any change with no significant warming or cooling with the exception of a couple of years the trend has been neutral. So if Carbon dioxide is supposedly causing the earth to warm, why has the temperature trends for the past 12 years not continued to increase? This shows the flaws and uncertainties in the science. What about ocean currents, the sun, PDO, AMO, etc? If you don't believe me, pull up the raw data and look at it closely.
    0 0
  38. Gidday. I live in North Queensland, Oz. I notice the role of melting ice has not been mentioned. I suggest warming is continuing, however it is being taken up in the form of latent heat and in the steady warming of the deep oceans. Greenland, for example, is shedding 200 cu. km. of ice per year. If it were not for this buffering effect of the ice and the oceans we would be broiling by now. And soon enough even melting ice and cool oceans will not be able to stop the warming of the biosphere.
    0 0
    Response:

    Of the two phenomena, warming of the deep ocean should be taking up much more heat than melting ice. The paper  An imperative for climate change planning: tracking Earth's global energy (Trenberth 2009) actually examines this question and finds the amount of heat going into melting ice is around 1.4 x 10²⁰ joules per year. In contrast, the heat being absorbed by the ocean is between 20 to 95 x 1020 joules per year. More on Trenberth's paper...

You need to be logged in to post a comment. Login via the left margin or if you're new, register here.


The Consensus Project Website

THE ESCALATOR

(free to republish)


© Copyright 2024 John Cook
Home | Translations | About Us | Privacy | Contact Us