


 Arguments


Observed Warming of the Ocean and Atmosphere is Incompatible with Natural Variation
Posted on 9 January 2013 by Rob Painting
Key points:
- Sedlá?ek & Knutti (2012) uses a simple analysis of the patterns of combined ocean and atmosphere warming in climate model simulations to ascertain whether recent global warming is consistent with natural variability, or with external forcing (i.e unrelated to internal variability of the climate system).
- They accomplish this by comparing model simulations of natural variability only, with simulations of the early and late 20th century, which include natural and human contributions to climate.
- The authors found that the smoothly progressing pattern of warming, at the ocean surface and with increasing ocean depth, observed in the 20th century simulations is highly consistent with a smoothly increasing and externally-driven forcing.
- Natural variability, on the other hand, exhibited a much smaller magnitude of warming and was characterized by a very patchy distribution of temperatures at the surface and at depth.
- The smoothly progressing pattern of warming in the model simulations is similar to historical measurements of sea surface temperatures and ocean heat content observations.
- These simulations and historical observations are incompatible with natural variability as a possible cause of ocean warming.
Figure 1 - Sea surface temperature trends scaled with global surface air temperature trends for half the climate models used in the study. First three columns are control (internal variability only) simulations. E20=early 20th century, and L20=late 20th century, simulations. The historical observations from Hadley Centre & Simple Ocean Data Assimilation (SODA) datasets are at the bottom. From Sedlá?ek & Knutti (2012).
Warming of the Global Oceans
Arguably the most significant climate-related impact of increased concentrations of greenhouse gases in the atmosphere, is that they trap more heat in the ocean. Over the last half-century around 93% of global warming has actually gone into heating the ocean. A little-known fact is that the oceans are almost exclusively heated by sunlight (shortwave radiation) entering the surface layers. Geothermal heat emanating from deeper layers of the Earth does contribute a small amount to ocean warming but, on the time scale of decades & centuries, this contribution is effectively constant as it is determined by the rate of radioactive decay.
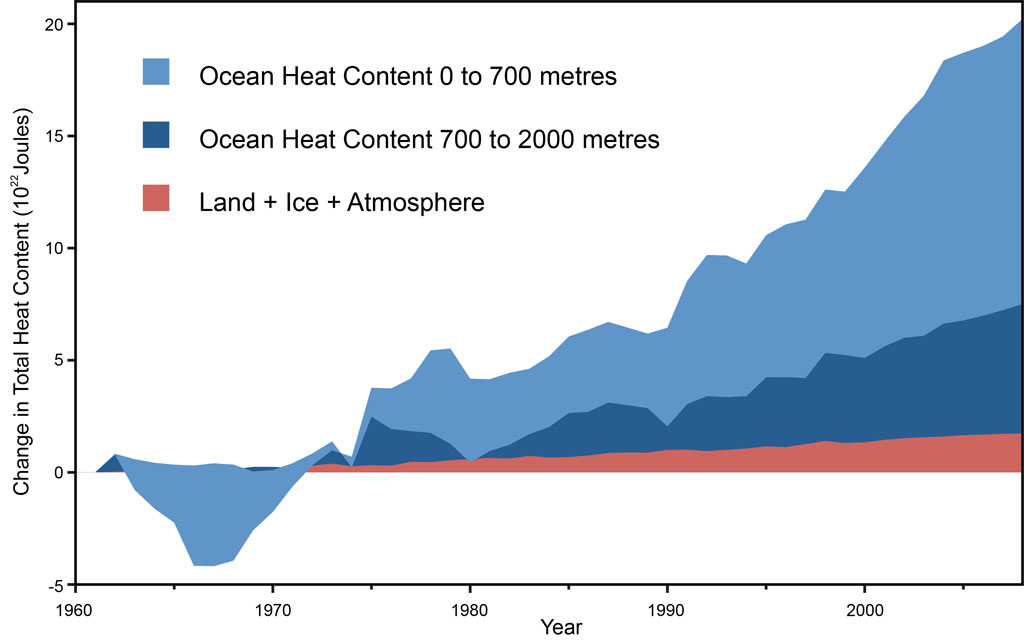
Figure 2 - Land, atmosphere, and ice heating (red), 0-700 meter OHC increase (light blue), 700-2,000 meter OHC increase (dark blue). From Nuccitelli (2012).
So how do greenhouse gases accomplish this ocean heating? This is discussed in this SkS post, but briefly; greenhouse gases radiate heat (longwave radiation) back toward the surface and, although they cannot penetrate into the ocean itself, they warm the uppermost surface of the thin cool-skin layer. The thermal gradient through this layer dictates the rate of heat loss from the (typically) warmer ocean surface, to the cooler atmosphere above. When greenhouse gases increase, more longwave radiation is directed back at the ocean surface, which warms the cool-skin layer, lowers the thermal gradient, and consequently reduces the rate of heat loss. The sum effect is that the oceans trap more of the sun's energy and therefore warm over time.
Gathering Evidence for External Forcing on 20th Century Climate
In contrast to other peer-reviewed papers which have employed complex statistical fingerprinting techniques to identify a human influence on the climate (see Gleckler [2012] for instance), Sedlá?ek & Knutti (2012) used a much simpler approach to distinguish between natural variability and external forcing. As such the paper serves as a complement, rather than an alternative, to other methods of attributing climatic change to human activity (fossil fuel burning).
To determine whether the observed warming of the ocean (Von Schuckmann & Le Traon [2011], Levitus [2012], Nuccitelli [2012]) might yield indications of external forcing or natural internal variability of the climate system, the paper's authors turned to 12 climate models used in the Climate Model Intercomparison Project Phase 5 (CMIP5).
The climate models provided pre-industrial control simulations (i.e natural variability only) and 20th century simulations, with the control simulations being a mimimum of 500 years long. From the control simulations the authors selected three non-overlapping 50-year periods for every model with the largest surface air temperature trends. This resulted in 36 periods with a noticeable warming trend. A similar process was applied to the historical simulations of the 20th century, however this time two non-overlapping 50-year periods were selected for each historical simulation (early and late 20th century) - resulting in 24 periods of warming from combined internal variability and external forcing.
The ocean warming rates are much larger in the 20th century simulations, with an average four times larger than the control in the late 20th century simulations. To remove this difference in magnitude and focus instead on the patterns of change, the authors scaled the vertical profiles of ocean temperature (area-weighted with respect to each vertical ocean layer) with the global surface air temperature trend of each period.
External Forcing is Smooth; Natural Variability is Lumpy
The results of the scaled simulations are shown below.
Figure 3 - Ocean temperature trends for the a) control (aka natural variability), b) early 20th century, and c) late 20th century, simulations. Note that the temperature profiles have been scaled relative to the global surface air temperature (SAT) trend in each simulation. Each colour represents a different model. Figure 3 (d) shows the correlation between ocean & surface air temperatures in the control (natural) simulations only. The bold black line in 3(c) is the scaled observational data (SODA) between 1955-2004.
Not surprisingly, given that the surface ocean is responsible for much of atmospheric warming, ocean warming and global surface air temperatures vary largely in phase with one another. The authors calculated a strong statistical relationship between the two for the top 300 metres of ocean in the climate models used (Figure 3 (d). On a multi-decadal time scale the changes in surface air temperature and ocean heat down to 700 metres are generally in phase too.
There are two standout features in Figure 3. First is the ocean warming pattern in the top 100 metres of ocean shown in panel 3(a). These are the control simulations. Here, in the absence of external forcing, there is a large spread of scaled-warming in the top 100 metres of ocean. By comparision, the early 20th century simulations - a period of weaker-than-present greenhouse gas-induced warming and substantial solar warming - shows greatly reduced variability (the lines are more tightly-spaced) in ocean warming with depth. For the late 20th century, a period of strong greenhouse gas increases, but with diminishing solar influence, variability in ocean warming shown in the profiles falls much further still. The ocean warming with depth, in fact, exhibits a very smooth progression - a marked contrast to the control (internal variability) simulations.
The second standout feature is in the deeper layers of ocean. The surface layers are well-mixed (turned over by wind especially), meaning that any additional heat gained by the ocean can quickly get distributed throughout this layer. Below that, away from the influence of the wind, heat penetrating downwards relies heavily upon advection (currents) and diffusion. Figure 3(a) shows that in the control (natural) simulations, below the well-mixed layer, the ocean is just as likely to be cooling or warming. In the 20th century simulations, however, the ocean overwhelmingly exhibits warming in these deeper layers.
The actual observations for the late 20th century are shown as the black line in Figure 3(c). These are the Simple Ocean Assimilation Data (SODA) scaled with the surface air temperature trends from the National Center for Enviromental Prediction (NCEP)/National Center for Atmospheric Research (NCAR). Although the model simulations do not faithfully portray the surface stratification noticed in observations, the simulated and observed warming are closely aligned. The authors comment:
"The distribution of the warming with depth (without arguing about the overall magnitude) is consistent with a strong surface signal that is propagating slowly towards deeper layers by advection and diffusion, and is very similar in the 20th-century simulations and the observations."
Sea Surface Temperature Patterns
As shown in Figure 1, warming at the sea surface demonstrates the same general trends as the vertical ocean heat profiles - patchy surface warming (large variability) in the control simulation and a much smoother warming pattern in the early 20th century simulations. Once again, surface warming variability diminishes even further in the late 20th century simulations, and once again these late 20th century simulations are much closer to the observed trends of sea surface warming, than the control and early 20th century simulations.
To appreciate the contrast in surface temperatures shown in Figure 1, the authors have quantified the spatial variability in a statistical sense. See Figure 4.
Figure 4 - Spatial variability of the sea surface temperature (SST) trends scaled with the global surface air temperature (SAT) trend for each simulation used in the study. The blue colour on the left-hand side shows the natural variability periods, the yellow=early 20th century, red=late 20th century, and the grey and black denote data from SODA and HadlSST (scaled with NCEP/NCAR SAT) respectively. The two insets on the right show the root mean square error (a quantitative measure of the difference , or deviation, between the model simulations and actual observations). The closer to zero the closer the fit to observed trends. From Sedlá?ek & Knutti (2012)
Global Warming Incompatible with Natural Variation
Climate models are, of course, only rough approximations of the real world that they seek to emulate. One legitimate objection could be that they vertically mix heat into the ocean more efficiently than the observations support (Forest [2008], Hansen [2011], & Kuhlbrodt & Gregory [2012]), i.e they have weaker-than-observed surface stratification - the black line bulge in Figure 3(c) in the top 200 metres of ocean. But this would also afflict the control (natural only) simulations, since the same models were used for both, and is therefore unlikely to be a factor in the modelled differences.
Scaling sea surface and ocean depth temperatures with the surface air temperatures, also accounts for any possible bias the climate models may have in simulating (i.e.underestimating ) natural variatibility. The scaling process removes the difference in magnitude between the larger average warming trends in the 20th century simulations, and the smaller trends in the control. This, therefore, allows a comparison of ocean warming patterns, rather than magnitudes of warming.
It should also be noted that the authors examined whether the large-scale ocean circulation, the Meridional Overturning Circulation (MOC), and two other ocean phenomena - the Pacific Decadal Oscillation (PDO) and Atlantic Meridional Oscillation (AMO) - could explain the warming in the 20th century simulations, but found no evidence in the models.
Another Arrow in the Quiver
This analysis by Sedlá?ek & Knutti (2012) does not attempt to connect modelled and observed ocean warming patterns with human activity, but does demonstrate that natural variability is incompatible with the warming in the 20th century simulations, and with historical observations. As such it serves as a complement to other studies, such as Gleckler (2012), which have shown a clear human fingerprint in ocean warming.


 0
0  0
0


Comments